RESEARCH ARTICLE
OPTIMIZATION OF BEETROOT PEEL OSMOTIC DEHYDRATION PROCESS USING RESPONSE
SURFACE METHODOLOGY
Dr.P.Nazni* and D. Karuna Thara
Department of Food Science, Periyar University, Salem, Tamil Nadu, India
ARTICLE INFO ABSTRACT
Beetroot peel contained higher antioxidant compounds thus promising a more intense utilization of the peels in food and nutraceuticals. The betalains and phenolics found in beetroot peel. Osmotic dehydration is used as a pretreatment for many processes which is used to improve nutritional, sensorial and functional properties of food without changing its integrity. Hence, the study was undertaken with the objective, to optimize the osmotic dehydration of beetroot peel using Response Surface Methodology (RSM) and analyze the beetroot peel waste for its chemical composition .The physical characteristics such as (rehydration ratio, water absorption capacity, oil absorption capacity, and bulk density) and nutrient content were analyzed. The independent process variables for osmotic dehydration process, temperature (25 - 450c), processing time (30 -150 minutes), salt Concentration (5-25% ) and Solution to sample to ratio (5:1 - 25:1 w/w).The osmotic dehydration process was optimized for water loss, weight reduction and solute gain. The optimum conditions were found to be for salt solution: Temperature (300c), Processing Time (60 min), Salt concentration (10%) and Solution to sample ratio (10:1) and for salt solution. At this optimum point, V1 got maximum water loss, weight reduction and minimum solute gain were found to be respectively. Further, peel powder can be used to incorporate in food products.
Copy Right, IJCR, 2011, Academic Journals. All rights reserved
INTRODUCTION
In recent years increased attention has been focused on the utilization of by-product and wastes from food processing. Such utilization would contribute to maximizing the available resources and result in the production of various products for food. .At the same time, a major contribution to waste disposal problems could be made. [1]. A considerable amount of vegetable can be wasted in the peeling. Through value addition a product can be produced from the peelings that would otherwise have been discarded [2]. Peel has been found to be a good source of polyphenols, carotenoids, vitamin E, dietary fiber and it also exhibited good nutritional quality, availability in different tastes good antioxidant properties the processes were evaluated by characterization and quantification of the pectins and phenolic compounds in the peels and in the polyphenol-enriched eluates [3].The polyphenolics from waste materials, being derived from agro-industrial production, may be used as functional food ingredients and as natural antioxidants to replace their synthetic equivalents that have experienced growing rejection. During the peeling process, 30.40% of the beetroot and vegetables become waste. In addition to this, some of the
*Corresponding author: [email protected], [email protected]
vegetables and beetroot are rejected during sorting. Waste generated by peeling commonly called peeling waste is very wet, with about 90% water content. There are different methods of handling waste generated during the peeling process. [4]. Osmotic dehydration is a process that entails the partial removal of water of food items such as vegetables and fruits. The water then passes through the food into the concentrated solution under the osmotic pressure gradient influence. This process is done because fruits and vegetables are generally 75 percent water, and as a result spoil rapidly. Osmotic dehydration enables fruits and vegetables to be stored for a longer period of time [5]. Osmotic dehydration (OD) of food got attention due to its importance in food processing industries. It is used for partial removal of water from materials such as fruits and vegetables by immersing in aqueous solutions of high osmotic pressure such as sugar and salts. The most commonly used osmotic agents are sucrose for fruits and sodium chloride for vegetables. OD can be conducted at low temperature and is less energy intensive than convective drying or freezing. The main advantages of OD include better colour, texture and flavour retention along with minimum heat damage [6]. It is effective around ambient temperatures, so heat damage to texture, colour and flavour can be minimized [7]. The other major application is to reduce the water activity of food materials so that microbial growth
ISSN: 0975-833X
International Journal of Current Research
Vol. 3, Issue, 8, pp.027-032, August, 2011
INTERNATIONAL JOURNAL OF CURRENT RESEARCH
Article History:
Received 8th April, 2011 Received in revised form 6th
May, 2011 Accepted 5th June, 2011 Published online 5th
August, 2011
Key words:
Osmotic dehydration, Beetroot,
Salt solution,
will be inhibited. Since most food materials contain large amount of water, they are cost intensive to ship, pack and store [8]. Osmotic dehydration is acknowledged to be an energy efficient method of partial dehydration, since there is no need for a phase change. There are numerous studies on osmotic dehydration of vegetables [9]. The Response Surface Methodology (RSM) was developed to overcome those disadvantages by reduction of the number of experimental trials needed to evaluate multiple parameters and their interactions, thus, less time consuming compared to other approaches. RSM has been widely applied in optimization processes in food industries [10]. In RSM, several factors are simultaneously varied. The multivariate approach reduces the number of experiments, improves statistical interpretation possibilities, and evaluates the relative significance of several affecting factors even in the presence of complex interactions. It is employed for multiple regression analysis using quantitative data obtained from properly designed experiments to solve multivariable equations simultaneously. Hence, the purpose of this study was to optimize the osmotic dehydration of beetroot peel using Response Surface Methodology (RSM) and to analyze the beetroot peel for its chemical composition.
MATERIAL AND METHODS
Materials
Fresh beetroot peels were collected from hostel and hotels. They thoroughly washed with water to remove adhering soil and other debris. Then, they were cut into small pieces (3-5cm) using clean knife. Salt, the osmotic agent, was purchased from a local supermarket. The osmotic solution is prepared by mixing the salt with proper amount of pure water.
Experimental Design and Statistical Analysis
Response surface methodology (RSM) was used to estimate the main effects of osmotic dehydration process on water loss (WL) and solid gain (SG) in beetroot peel. A central composite design was used with temperature (25 – 45oC), processing time (30 -150 minutes), salt concentrations (5 - 25% w/w) and solution to sample to ratio (5:1 – 25:1) being the independent process variables (Table I). For the generated 30 experiments, RSM was applied to the experimental data using design expert 7.1.5.
Osmotic dehydration Procedure
The osmotic dehydration was conducted in a 500 ml Erlenmeyer flask, which is placed in a thermostatically controlled water bath shaker. Beetroot peel was cut into small pieces and weighed and then placed into dehydrating vessel containing salt and sugar solution of varying concentrations (5–25%). The vessel was placed into the water bath at a constant temperature. The solution to sample ratio is varied between 5:1–25:1. At each sampling time (0.5–2.5 h), the beetroot peel were taken out and then gently blotted with adsorbent paper and weighed. The effect of temperature was also investigated and the experiments were conducted between temperatures of 25 - 45oC. The average moisture and dry matter content of the samples were determined by tray drying at 70oC. In each of the experiments fresh osmotic syrup was used. All the experiments were done in triplicate and the
average value was taken for calculations. Agitation was necessary to improve mass transfer, maintain uniform concentration, temperature profile and prevent the formation of a dilute solution film around the samples.
Physical parameters of beetroot peel powder
The rehydration ratio, water absorption capacity, oil absorption and Bulk Density (BD) were determined by using Ige, (1984).
Experimental design for optimization of osmotic dehydration of beetroot peel
Response surface methodology was applied to the experimental data using a commercial statistical package (Design expert, Trail version 7.0, State Ease Inc., Minneapolis, IN statistical software) for the generation of response surface plot and optimization of process variables. The experiments were conducted according to Central Composite Rotatable Design (CCRD) (11). A factorial experiment was used to study the effects of temperature (X1),
processing time (X2) salt concentration (X3) solution to
sample ratio (X4) on the response variables such as water loss
[image:2.612.317.544.354.418.2](Y1), Weight reduction (Y2), solute gain (Y3) of the beetroot peel.
Table 1. Process variables and their levels of experimental design
Symbol Independent Variables Range and Levels
-2 -1 0 +1 +2
X1 Temperature (˚C) 25 30 35 40 45
X2 Processing time (min) 30 60 90 120 150
X3 Salt concentration (%) 5 10 15 20 25
X4 Solution to sample
ratio (w/w)
5:1 10:1 15:1 20:1 25:1
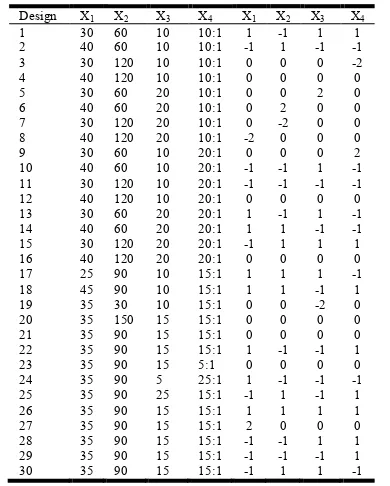
Table 2. Observed values of dependent variables for different runs of optimization experiments
Design X1 X2 X3 X4 X1 X2 X3 X4
1 30 60 10 10:1 1 -1 1 1
2 40 60 10 10:1 -1 1 -1 -1
3 30 120 10 10:1 0 0 0 -2
4 40 120 10 10:1 0 0 0 0
5 30 60 20 10:1 0 0 2 0
6 40 60 20 10:1 0 2 0 0
7 30 120 20 10:1 0 -2 0 0
8 40 120 20 10:1 -2 0 0 0
9 30 60 10 20:1 0 0 0 2
10 40 60 10 20:1 -1 -1 1 -1
11 30 120 10 20:1 -1 -1 -1 -1
12 40 120 10 20:1 0 0 0 0
13 30 60 20 20:1 1 -1 1 -1
14 40 60 20 20:1 1 1 -1 -1
15 30 120 20 20:1 -1 1 1 1
16 40 120 20 20:1 0 0 0 0
17 25 90 10 15:1 1 1 1 -1
18 45 90 10 15:1 1 1 -1 1
19 35 30 10 15:1 0 0 -2 0
20 35 150 15 15:1 0 0 0 0
21 35 90 15 15:1 0 0 0 0
22 35 90 15 15:1 1 -1 -1 1
23 35 90 15 5:1 0 0 0 0
24 35 90 5 25:1 1 -1 -1 -1
25 35 90 25 15:1 -1 1 -1 1
26 35 90 15 15:1 1 1 1 1
27 35 90 15 15:1 2 0 0 0
28 35 90 15 15:1 -1 -1 1 1
29 35 90 15 15:1 -1 -1 -1 1
30 35 90 15 15:1 -1 1 1 -1
X1-Temperature, X2-Processing time, X3-Salt concentration, X4-solution to sample ratio
[image:2.612.336.531.449.692.2]these water loss (WL), weight reduction (WR), and solid gain (SG) data were obtained, according to the expressions
WR = [(M0-M)/M0]
(W0-Wt) +St-So) x 100
WL= Wo
St-So x 100
SG= Wo
Where M0 - initial mass of sample (g), M - mass of sample
after dehydration (g), Wo is the initial weight taken for
osmotic dehydration (g),Wt is the weight of after osmotic
dehydration at any time (g),So is the initial dry matter(g),St is
the dry matter of after osmotic dehydration for any time(g). Each design point consists of the replicates. For the statistical analysis the numerical levels are standardized to -2, -1, 0 and +1, +2. The experiments were carried out in randomized order (Gacula and Singh, 1984) [12]. The relationship between standardized variables values is given as follows
X1 = Temperature -35
5
X2= Processing time-90
3
X3= Salt concentration-15
5
X4= Solution to sample ratio-15
5
The standard scores were fitted to a quadratic polynomial regression model for predicting individual Y responses by employing at least square technique (Wanasaundara and Shahidi, 1966). The second order polynomial equation was fitted to the experimental data of each dependent variable as given. The model proposed to each response of Y was
3
1 1
2 3
1 0
i
j i j i
ij i
ii i
i
i
X
X
X
X
Y
Where ß0, ßi, ßij are intercepts, quadratic regression coefficient terms. Xi and Xj are independent variables. The model permitted evaluation of quadratic terms of the independent variables on the dependent variable. The response surface and contour plot were generated for different interactions of any two independent variables, where holding the value of third variables as constant at central level. The optimization of the process was aimed at finding the optimum values of independent variables [12].
RESULTS AND DISCUSSION
The Result indicate that Rehydration ratio(40g), Water absorption capacity(5.1ml), Oil absorption capacity(7.4ml), Bulk density(7.2g) in beetroot peel powder. The nutritive value and such as, Total ash (18.7), Fiber (6.7), Protein (12.7), Fat (2.3), Calcium (0.37), Phosphorus (0.9) in osmotic dehydrated beetroot peel powder.
Fitting Models
Experiments were performed according to the CCD experimental design given in Table 2 in order to search for the optimum combination of parameters for the osmotic dehydration of beetroot peel. A Model F-value of 1.52, 1.29 and 1.29 for WL, SG and WR implies respectively that the
model is not significant. There is only a 31.52 % chance that a "Model F Value” this large could occur due to noise. The Lack of Fit Fvalue of 0.4, 0.97 and 0.97 for WL, SG and WR implies the Lack of Fit is not significant. There is only a 97.81 % chance that a "Lack of Fit F-value" this large could occur due to noise. The goodness of fit of the model is checked by the determination coefficient (R2). The coefficient of determination (R2) was calculated to be 0.5859, 0.5461 and
0.5859 for WL, SG and WR respectively. The R2 value is always between 0 and 1, and a value >0.75 indicates aptness of the model. For a good statistical model, R2 value should be close to 1.0. The adjusted R2 value corrects the R2 value for the sample size and for the number of terms in the model. The value of the Adj R2 (0.1994 for WL, 0.1225 for WR, 0.1994 for SG). The Pred R2 for WL - 0.8245, WR -0.2643 and SG - 0.2643 indicate that negative value for WL, WR, and SG. The experimental results are analyzed through RSM to obtain in empirical model for the best response. The results of theoretically predicted response are shown in Table II. The mathematical expression of relationship to the response with variables are shown below
Y1 =
y1=12.66+0.13x1-0.14x2-0.40x3-5.76x4-8.33x12=8.79x22
Y2 = 0.74+3.50x1-5.27x2-3.50x3+6.50x4-7.50x1 2
+3.472x22 Y3 = 9.75-0.35x1+0.052x2+0.350x3-0.650x4+7.50x1
2
-3.472x22
where Y1,Y2, Y3 are water loss (%), solid gain (%) and weight
reduction (%) respectively, and X1,X2,X3 and x4are the coded
values of the test variables, temperature (oC), processing time (min), salt concentration (%w/w), and solution to sample ratio (%w/w) respectively. The results of multiple linear regressions conducted for the second order response surface model are given in Table 2. The significance of each coefficient was determined by Student’s t-test and p-values, which are listed in Table 3 - 5. Values of "Prob > F" less than 0.0500 indicate model terms are significant. Values greater than 0.10 indicate the model terms are not significant. In this case, X1, X2, X3,
X4, X1X2, X1X4, X1 2
, X3 2
and X1, X2, X3, X4, X1X2, X1X4,
X1 2
,X2 2
X3 2
are non significant model terms for WL and WR,SG respectively .This implies that the linear and square effects of temperature, processing time, salt concentration and solution to sample ratio are more non significant than the other factors.
Response Surfaces and Contour Plots
Water Loss
The magnitude of P and F values in Table 3 indicates the maximum positive contribution of temperature, process time and negative contribution of salt concentration and solution to sample ratio on the water loss during osmotic dehydration. It implies decreased water loss with increase in temperature, processing time and solution to sample. The quadratic terms of, processing time and concentration have positive effect and solution to sample ratio, Temperature have negative effect on water loss. Further, the interactions of X1-X2, X1-X4, X2-X4,
and X1-X3 have positive effect, whereas the interactions of X2
-X3, and X3-X4 have negative effect on water loss.
The magnitude of P-values indicates that is not significant. The quadratic terms of all the process variables have not significant effect on water loss. Where as the interaction terms
of all the process variables have not significant effect on water loss. The effect of on water loss has been shown in 3D effect.
Weight Reduction
The magnitude of P and F values in Table 4 gives the maximum positive contribution of temperature, processing time, and negative contribution of salt concentration and solution to sample ratio on the water loss during osmotic dehydration. It implies decreased weight reduction with decrease of temperature, process time, salt concentration and solution to sample ratio. This is clearly shown in Figures 2. The quadratic terms of processing time and salt concentration have negative effect and temperature have positive effect on weight reduction and temperature.
[image:4.612.126.474.238.448.2]Further, the interactions of X1-X2, X1-X3, X2-X3 have a positive effect, whereas the interactions of X1-X4 ,X2-X4and X3-X4 have negative effect on weight reduction.
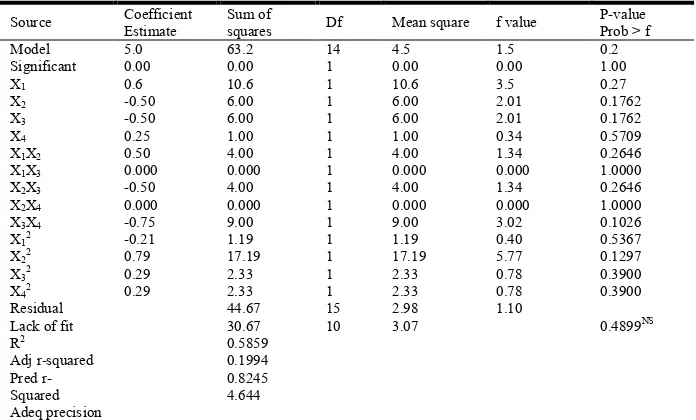
Table 3. Analysis of variance (Anova) for response surface quadratic Model for the osmotic dehydration of beetroot peel-water loss
Source Coefficient
Estimate
Sum of
squares Df Mean square f value
P-value Prob > f Model
Significant X1
X2
X3
X4
X1X2
X1X3
X2X3
X2X4
X3X4
X1 2
X22
X3 2
X4 2
Residual Lack of fit
R2
Adj r-squared Pred r- Squared Adeq precision
5.0 0.00 0.6 -0.50 -0.50 0.25 0.50 0.000 -0.50 0.000 -0.75 -0.21 0.79 0.29 0.29
63.2 0.00 10.6 6.00 6.00 1.00 4.00 0.000 4.00 0.000 9.00 1.19 17.19 2.33 2.33 44.67 30.67 0.5859 0.1994 0.8245 4.644
14 1 1 1 1 1 1 1 1 1 1 1 1 1 1 15 10
4.5 0.00 10.6 6.00 6.00 1.00 4.00 0.000 4.00 0.000 9.00 1.19 17.19 2.33 2.33 2.98 3.07
1.5 0.00 3.5 2.01 2.01 0.34 1.34 0.000 1.34 0.000 3.02 0.40 5.77 0.78 0.78 1.10
0.2 1.00 0.27 0.1762 0.1762 0.5709 0.2646 1.0000 0.2646 1.0000 0.1026 0.5367 0.1297 0.3900 0.3900
0.4899NS
Design-Expert® Software Factor Coding: Actual Water loss
8
4
X1 = A: Temperature X2 = B: Processing Time
Actual Factors C: Salt Concentration = 10.53 D: Solution to Sample Ratio = 19.75
60.00 66.00 72.00 78.00 84.00 90.00 96.00 102.00 108.00 114.00 120.00 30.00
32.00
34.00
36.00
38.00
40.00 4
5
6
7
8
9
W
a
ter
lo
ss
A: Temperature
B: Processing Time
[image:5.612.61.268.46.428.2]8 .00001 8 .00001
Fig.1. 3D Effect of RSM on Osmotic dehydrated Beetroot peel on Water loss
Design-Expert® Software Factor Coding: Actual Weight reduction
0.84
0.8
X1 = A: Temperature X2 = B: Proces sing Time
Actual Factors C: Salt Concentration = 10.14 D: Solution to Sample Ratio = 20.00
60.00 66.00 72.00 78.00 84.00 90.00 96.00 102.00 108.00 114.00 120.00
30.00 32.00
34.00 36.00
38.00 40.00 0.812
0.814 0.816 0.818 0.82 0.822
We
ig
h
t
red
u
cti
o
n
A: Temperature
B: Processing Time
Warning! Surface truncated by selected response (Y) range
0.822897 0.822897
Fig. 2. Effect of RSM on Osmotic dehydrated Beetroot peel on Weight reduction
The magnitude of P-values indicates that is not significant. The quadratic terms of all the process variables have not significant effect on Weight reduction. Where as the interaction terms of all the process variables have not significant effect on weight reduction. The effect of on water loss has been shown in 3D effect.
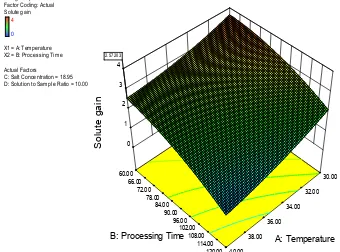
Solute gain
The linear effects of variables show positive effect on salt concentration and solution to sample ratio and temperature, processing time, shows negative contribution on solid gain. It implies increased solid gain with increase of process variables.
Design-Expert® Software Factor Coding: Actual Solute gain
4
0
X1 = A: Temperature X2 = B: Processing Time
Actual Factors C: Salt Concentration = 18.95 D: Solution to Sample Ratio = 10.00
60.00 66.00
72.00 78.00
84.00 90.00
96.00 102.00
108.00 114.00
120.00
30.00
32.00
34.00
36.00
38.00
40.00 0
1 2 3 4
Solut
e
g
ain
A: Temperature B: Processing Time
2.57203 2.57203
Fig. 3. Effect of RSM on Osmotic dehydrated Beetroot peel on solute gain
Solute gain
The linear effects of variables show positive effect on salt concentration and solution to sample ratio and temperature, processing time, shows negative contribution on solid gain. It implies increased solid gain with increase of process variables .The quadratic terms of processing time and concentration, sample ratio have negative effect on solid gain and temperature has positive effect. The interactive effects of X1-X4, X2-X4and X3-X4 have positive effect on solid gain, whereas the interactive effects of X1-X2, X1-X3, and X2-X3 have negative effect. The magnitude of P-values indicates that is not significant. The quadratic terms of all the process variables have not significant effect on solute gain. Where as the interaction terms of all the process variables have not significant effect on solute gain. The effect of on water loss has been shown in 3D effect.
Optimum Condition for Osmotic Dehydration
Optimum condition for osmotic dehydration of beetroot Peel was determined to obtain maximum water loss, weight reduction and minimum solid gain. Second order polynomial models obtained in this study were utilized for each response in order to determine the specified optimum conditions. The sequential quadratic programming in using design expert 7.1.5 is used to solve the second-degree polynomial regression equation. The optimum values obtained by substituting the respective coded values of variables are: temperature – 30oC, processing time – 60 min, salt concentration – 10% w/w, solution to sample ratio – 10:1w/w. At this point, water loss, solid gain and weight reduction was achieved in osmotic dehydration processes.
CONCLUSION
[image:5.612.341.511.124.250.2]ratio were statistically significant. Second order polynomial models were obtained for predicting water loss, solid gain and weight reduction. Among 30varablies, V1 has got the optimum conditions for temperature – 30oC, processing time –
60 min, salt concentration – 10% and solution to sample ratio 10:1 respectively.
REFERENCES
Biswal, R. N. and M. Le Maguer, 1989. Mass transfer in plant material in contact with aqueous solution of ethanol and sodium chloride: equilibrium data”, Journal of Food
Process Engineering, vol. 11, pp. 159-176.
Chang, Y.C., C.L. Lee, and T.M. Pan, 2006. Statistical optimization of media components for the production of Antrodia cinnamomea AC0623 in submerged cultures”, Applied Microbiology and Biotechnology, vol.72, pp. 654-661.
David, E. L. 2007,Powers of Beet Root. Journal of Food Science 53:17-18. http://www.science direct.com/ science. html
Khuri, A.I. and Cornell, J.A. 1997. Secondary Design Considerations for Minimum Bias Estimation." Commun.
Statist., A6, 631-647.
Lee, W.C., S. Yusof, N.S.A. Hamid and B.S. Baharin, 2006. Optimizing conditions for enzymatic, Clarification of banana juice using response surface methodology (RSM). J. Food Eng., 73: 55-63.
Mudahar, G. S. and R. T. Toledo, J. D. Floros, and J. J. Jen,1989. Optimization of carrot dehydration process using response surface methodology”, Journal of Food
Science, vol.54,pp. 714-719.
Raoult-Wack, L 1994. Advances in osmotic dehydration”,
Trends in FoodScience Technology, vol.5, pp. 255–260.
Sodhi N S, (2006).Osmotic dehydration kinetics of carrots.
Journal of Food Science and Technology, Vol.
43(4):374-376,
Sodhi N S, (2006).Osmotic dehydration kinetics of carrots.
Journal of Food Science and Technology, Vol.
43(4):374-376,
Sukhvir, 1989. Food Science’, soundariya Publishers, Sambath Nagar.Pp:60-61.
Torrengiani, D. 1993. Osmotic dehydration in fruits and vegetable processing”, Food Research International, vol. 26, pp. 59 – 68.
Wanasundara, F. Shahidi 1996. optimization of hexa metaphosphate-Assisted Extraction of Flaxseed Proteins Using Response Surface Methodology Journal of Food
Science, Volume 61, Issue 3, pages 604–607.