RESEARCH ARTICLE
THE ADVANTAGES OF MULTI DIMENSIONAL DATA MODEL – A CASE STUDY
1
Srimani, P.K. and
2Rajasekharaiah K.M.
1Former Chairman, Dept. of Computer Sc. & Maths, Bangalore Univeristy, Director, R & D, BU, Bangalore, India 2Department of Comp. Sc. & Engg., Gharda Institute of Technology, At & Po. Lavel, Tq. Khed, Dt. Ratnagiri,
MH State, India
ARTICLE INFO ABSTRACT
In Multi-dimensional Data Model [MDDM], a Data Warehouse uses a data model that was based on a multi-dimensional data model. This model was also known as a data cube which allows
data to be modeled and viewed in multiple dimensions. Dimensionsare the different perspective
for an entity that an Organization was interested in.In this study, the design implementation and
improvisation of MDDM for the case study of Super Market was considered.
Copy Right, IJCR, 2011, Academic Journals. All rights reserved
INTRODUCTION
Discovery of relevant information was one of the major challenges faced in the present Information Age. From tables and spreadsheets to Data Cubes, a Multi-dimensional Data Model comes into picture. A data warehouse was based on a multi-dimensional data. Simultaneous modeling of group differences in the item responsed and the underlying ability (Inmon, 2002). The aim was to propose a scalable model for online Distributed Data Warehouses. A Model was a
population of adaptive agents and will be unique per data
warehouse. The canonical data model for data warehouse was typically a specialized form of the Relational Data Model, the so called Multi-dimensional Data Model. A new data modeling technique was used to represent the
multi-dimensional data stored. They consist of Tables having
attributes and are populated by Tuples. We use the E-R data model which used to store transactional data and are called OLTP systems. The main goal was to have Data Accuracy and Consistency, Concurrency, Recoverability, Reliability (ACID PROPERTIES).
Need for multi-dimensional data model
Presently, every organization is facing many Data and Information Storage problems for Decision Support Systems.
(Gerald Kowalski et al., 2000). To overcome this problem,
Organizations presently are implementing Data Warehousing
*Corresponding author: [email protected]
Concept by using multi-dimensional data models. In relational data model we view the relation between data in two dimensions in the form of rows and columns, across multiple tables using keys. The same database can be represented using the multi-dimensional model as cube with multiple dimensions. To create cubes we have to consider two aspects
of data i.e. Dimensions and Facts. (Langseth, 2004).
Dimensions are nothing but descriptions which help us to categorise data or information into comparable groups. Like
nouns, they can be place names, object names or even time
and date.Facts are numeric information such as price, quantity
or length, which give us a sense of magnitude or size. We are using fact table to store data. So, facts are numerical measures and are quantities by which we want to analyze relationships between dimensions. Examples of facts are qty_sold, Unit_price, Total_amt and so on. The fact table contains the names of the facts as well as keys to each of the related dimension tables. The entity-relationship data model was commonly used in the design of relational databases. However, such a schema was not appropriate for a data warehouse. A data warehouse requires a concise, subject oriented schema that facilitates on-line data analysis.
Implementing multi-dimensional data model
The most popular data model for a data warehouse was a
multi-dimensional data model.In Data Warehousing literature,
an n-D base cube was called a base cuboids.Thetop most
0-D cuboids, which holds the highest level of summarization,
ISSN: 0975-833X
International Journal of Current Research Vol. 3, Issue, 11, pp.110-115, October, 2011
INTERNATIONAL JOURNAL OF CURRENT RESEARCH
Article History:
Received 22nd
July, 2011 Received in revised form 16th
August, 2011 Accepted 18th
September, 2011 Published online 15th
October, 2011
Key words:
Data Warehouse, Dimension, Fact, Data Model, Data Cube, Multi-dimensional,
was called the apex cuboids. The lattice of cuboids forms a
data cube. (Gerald Kowalski et al., 2000)
What is a Data Model?
A data model in Software Engineering is an abstract model that describes how data was represented and accessed. A Data Model is a way to describe data and to issue queries against it. So, a complete model was a mechanism to answer any query.
A computer based representation of the real world
Terms, Concepts, Patterns are often universal
In science and GIS, we focus on data models, not the
behavior models (Simulations, Geo processing on single data structures)
Described initially in a Conceptual Data Model
What was a Conceptual Data Model?
A view of the system being developed
Describes – Entities, Attributes, Relationships
Sometimes data types, constraints, behavior
Typically uses a formal Notation
Includes a vocabulary that reflects our disciplinary
knowledge
How Do We Represent a Data Model?
Entity-Relationship (E-R) Diagrams/Models
[Relational tables with Primary & Foreign Keys]
Unified Modeling Language (UML) models [Objects
with Properties & Methods]
Table Structures
Sketches to describe spatial models
Multidimensional Data Model
A Data Warehouse was based on multidimensional data
model, which views data in the form of a data cube. The
multidimensional data model represents the data of interest by means of multi dimensions. It means, multidimensional N-Grid Q which was a Cartesian product of certain discrete sets
Di called Dimensions. The elements of a dimension are called
members. The set of dimensions and members form Meta Data. (Langseth, 2004).
Meta Data and Data
A relation was a collection of tuples which may be regarded as elements of a Cartesian product of certain data domains. To each data domain, one associates an attribute. An attribute usually has a name and defines the type of data. The set of attributes forms Meta Data. A table was an instance of
relation. Attributes correspond to columns in the table and
tuples (records) form the rows. Rows and columns cannot be interchanged. Two tables are said to be equivalent if there was a one-to-one mapping between the corresponding metadata. Metadata fully determines the maximal amount of data in a database.
Cells and Data
A combination of members from each of the dimensions uniquely defines a Cell in the Grid. We have two choices:
Assign a Single Data Value to a Cell or
Assign a tuples of values
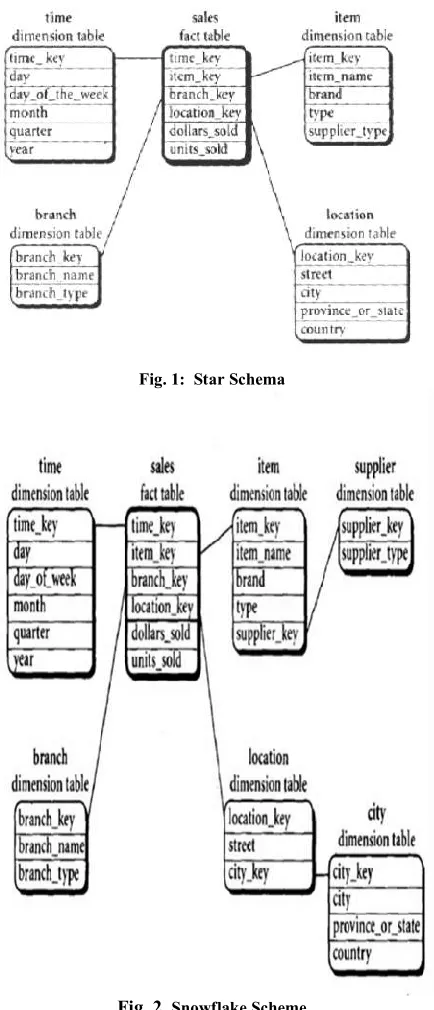
[image:2.612.326.543.89.594.2]Fig. 1: Star Schema
Fig. 2. Snowflake Scheme
Data Cubes
The members mij………..min that define a cell ‘C’ in the grid are
called the cell’s coordinates. So, we write cj = mij.
So, an instance of a multidimensional grid whose cells contain
data values was for some reason called “Cube”. So, a cube
was a set. {Q N} where Q was an N-grid and V was a
function, such that V(miJ…….miN) was the data value
corresponding to the cell C((miJ…….miN). For. For our
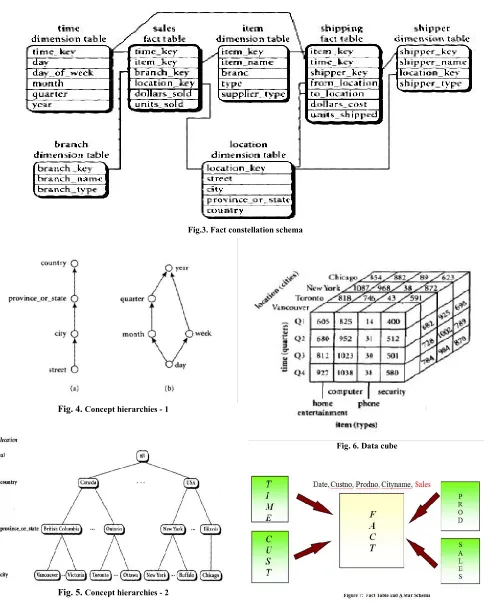
Fig. 4. Concept hierarchies - 1
Fig. 5.Concept hierarchies - 2
This multidimensional data can be represented using a Data Cube as shown in the figure:
The above figure shows A 3-Dimensional Data Model – X –Dimension: Item type
Fig. 6. Data cube
Y –Dimension: Time/Period Z –Dimension: Location
[image:3.612.65.549.74.683.2]Measures Dimension
The choice between a tuples and a single value for the cell data reflects the desire to imitate a certain relational table design more or less closely. For this purpose, one can introduce a distinguished dimension called Measures. The members of the Measures dimension serve the same purpose as columns in a table and they define data types. The analogy however breaks here since there are no rows. A more general approach, “multidimensional” approach was to define the data type on a per cell basis. Also, as a unifying approach, one may
support to wrap the cell contents into one “object”.
What Operations do we interested in?
We need to decide, what operations do we need in our model? It was desirable that our operations on multidimensional objects return multidimensional objects as well, so that, we could issue queries against them again. We can always consider Grids as Unions of Cells and say that any operation
thatmaps a set of cells into another set of cells was acceptable.
This would closely follow the Fact Table representation of cubes.
Operations on a Cube:
Since there are no rows, the only possible operator on data in a
cube was Selection. Contrary, to the relational case, this
operation affects the metadata as well.
This was one of the properties of the multidimensional algebra – all of the operators change metadata, directly or indirectly.
The Relational Implementations of the Multidimensional Data Model
It typically exist in the form of the -
A STAR SCHEMA
A SNOWFLAKE SCHEMA
A FACT CONSTELLATION
SCHEMA
We can say that each Schema has a Fact table that stores all the facts about the subject/measure. Secondly, each fact was associated with multiple dimension keys that are linked to Dimension Tables
A Star Schema
A Single Fact Table with N - dimension tables linked to it. It means a Fact Table in the middle was connected to a set of
dimensions tables. It consists of the following –
1. Fact Table – A large central table containing the bulk of data.
2. Dimension Tables - A set of smaller dimensional tables one
for each dimension.
The above figure shows –
There was a central large Fact table with no
redundancy
Each tuple in the fact table has a foreign key to a
dimension table which describes the details of that dimension
Problem: Redundancy
Values of city, province_or_state and country would
be repeated for two streets in the same city.Thus we can normalize the table by splitting location into sub tables. (Snowflake Schema)
Advantage: Performance
Very less number of joins was required
A Snowflake Schema
Single Fact Table with n-Dimension Tables organized on a hierarchical manner. It means a refinement of Star Schema where some dimensional hierarchy was normalized into a set of smaller dimensional tables.
The figure shows that –
Some of the dimension tables are normalized thus
splitting data into additional tables.
Problem: Performance
Too many joins are required to form the result. Thus
Snowflake schema was not as popular as the Star Schema
A Fact Constellations Schema
Multiple Fact Tables share dimension tables, viewed as a collection of stars, therefore, it was called Galaxy Schema or Fact Constellation.
The figure shows that –
Two or more fact tables share dimension tables.
the ‘Sales’ fact table and ‘Shipping’ fact table Share
the dimension tables
As the multiple fact tables are linked to each other by
dimension tables, its called as “Fact Constellation Schema”
Concept Hierarchies
The figure shows that –
It was a sequence of mappings from a set of
low-level concepts to higher-low-level, more general concepts.
A Concept Hierarchy may also be a total order or
It may also be defined by discretizing or grouping values for a given dimension or attribute , resulting in a set-grouping hierarchy
Concept Hierarchies may be provided manually by
1. System Users-
2. Domain Experts
3. Knowledge Engineers
4. Automated Statistical Analysis
OLAP Operations:
1. Roll-up
Performs aggregation on a data cube, either by climbing up a concept hierarchy for a dimension or by dimension reduction
2. Drill-down
Can be realized by either stepping down a concept hierarchy for a dimension or introducing additional dimensions
3. Slice and Dice:
Slice performs a selection on one dimension of the given cube, resulting in a sub cube
Dice defines a sub cube by performing a selection on two or more dimensions
4. Pivot (rotate):
It’s a visualization operation that rotates the data axes in view in order to provide an alternative presentation of the data.
OLAP SERVERS USED:
1. ROLAP – Relational OLAP Server:
They stand between relational back-end server
and client front-end tools
Use relational or extended relational DBMS to
store and manage warehouses. It also contain optimization for each DBMS back end
ROLAP technology tends to have greater
scalability than MOLAP technology
Examples: DSS Server of Micro Strategy, Meta Cube of Informix
2. MOLAP – Multidimensional OLAP Server
Supports multidimensional views of data through
array based multidimensional storage engines
They map multi dimensional views directly to data
cube array structures
Data Cube allows faster indexing to pre computed
summarized data
Many MOLAP servers adopt a two-level storage
representation
Examples: Essbase of Arbor
3. HOLAP – Hybrid OLAP Server
This combines MOLAP and ROLAP technology
Benefits from greater scalability of ROLAP
Benefits from faster computation of MOLAP
HOLAP servers may allow large volumes of detailed
data to be stored in a relational database while aggregations are kept in a separate MOLAP store
Examples: Microsoft SQL Server 7.0 OLAP Services
4. Specialized SQL Server
It provides an advanced query language and query
processing support for SQL queries over star and snowflake schemas in a read-only environment
[
Examples: Redbrick of Informix
A CASE STUDY OF MULTIDIMENSIONAL DATA MODEL
Data Warehouse uses a Data Model that was based on a Multidimensional Data Model. It is also known as a Data Cube which allows data to be modeled and viewed in multiple Dimensions. Dimensions are the different Perspectives for an entity that an Organization was interested
CASE STUDY
BHARTI ENTERPRISES – A SUPER MARKET
(Indian Journal of Information Science & Technology)
In India Super Market – Bharti Enterprises, based in New Delhi, operating across India and also in some other countries. It was founded by Sunil Bharti Mittal, Chairman & CEO, products like Telecom, Retail, Insurance, Digital TV, Mobil Phones (Airtel Brand) in the year 1985.
It was one of the largest Super Market Chains in the India
Supermarket + Retail Stores
Wholesalers Stores
Many more outlets
Super Market
It includes Purchasing, Sales, Inventory, Accounts Payable
and Receivables, Supplier Promotions – National, Regional,
Local and Store Level Management of all information’s.
Suppliers:
It includes Accept Orders, Promote Products, Provide Special Incentives Monitor and Track the Incentives, Bill and Collect Receivables and Estimate Retailer Demands. New retail paradigm in present business was J-i-T i.e. Just-in-Time. Information presently was called a strategic weapon to take DSS for any Organization as follows:
Daily Summary of all Sales Information
Regional Analysis of all Stores in a logical area
Specific Supplies Sales
Trend Analysis, etc.
It uses information when negotiating with
Suppliers
Advertisers etc.
SCHEMA DESIGN
1. Database Organization
must look like business
must be recognizable by business user
approachable by business user
Must be simple
2. Schema Types
Star Schema
Snowflake Schema
Fact Constellation Schema
Star Schema
A single fact table and for each dimension one
dimension table
Does not capture hierarchies directly
Dimension Tables
Define business in terms already familiar to users
Wide rows with lots of descriptive text
Small tables (about a million rows)
Joined to fact table by a foreign key
heavily indexed
typical dimensions
time periods, geographic region (markets, cities),
products, customers, salesperson, etc.
Fact Table: (Central table)
Typical example: individual sales records
mostly raw numeric items
narrow rows, a few columns at most
large number of rows (millions to a billion)
Access via dimensions
Snowflake Schema
Represent dimensional hierarchy directly by
normalizing tables.
Easy to maintain and saves storage
Fact Constellation Schema:
The figure shows that –
Multiple fact tables that share many dimension tables
Data Granularity in Warehouse
Summarized data stored
Reduce Storage Costs
Reduce CPU usage
Increases performance since smaller numbers of
records to be processed
Design around traditional high level reporting needs
Tradeoff with volume of data to be stored and
detailed usage of data
Solution was to have dual level of granularity
Store summary data on disks
100% of DSS processing done against this data
Store details on tapes
Therefore, this paper, for a detailed study of this research was made taking a case study – Bharti Enterprises, a largest super market chain having retail stores which uses multi-dimensional data model.
CONCLUSIONS:
The study finally reveals the following major advantages of using multi-dimensional data model –
It facilitates better comparison of the data
It facilitates better understanding of the data
Queries can be performed faster on data segregated
based on dimensions and facts
Analysis can be performed faster on data segregated
based on dimensions and facts
It allows us as and when new information was
gathered, which can be easily, quickly and properly organized.
It reduces storage costs
It reduces CPU usage
It increases performance since smaller number of
records can be processed.
Good solution to data for dual level of granularity
100% of DSS will be done against this data
For all these above mentioned advantages, presently, all most all Organizations are implementing this concept in their
business to reap the benefits. (Gerald Kowalski et al., 2000)
(Alex Berson et al., 2004)
REFERENCES
Alex Berson & Stephen J Smith, 2004. Data Warehousing, Data Mining & OLAP - Tata McGraw-Hill Edition (TMH) Ben-Gal I.Maimon O and Ruckaeh L (Eds.) 2005, Data
Mining and Knowledge Discovery an Handbook: “A Complete Guide for Practioners and Researchers” Kluwer Academic Publishers, ISBN
Fawceti T and Provost F, 1997, Data Mining and Knowledge Discovery
Gerald Kowalski, Mark T. Maybury, 2000, “Information storage and retrieval systems: theory and implementation” Edition: 2, illustrated Published by Springer, ISBN Inmon, W.H. 2002, Building the Data Warehouse, John Wely
& Sons,
Kimball John, R. 2000. The DW Toolkit –Wely & Sons.
Langseth, J., 2004, “Real-Time Data Warehousing:
Challenges and Solutions", DSSResources.COM,