1
Title: A Framework of Conditions of Success for Earned Value Analysis in Projects
ABSTRACT
2 1. Introduction
An effective performance measurement system (PMS) is a key element to achieving organisational effectiveness (Updadhaya et al., 2013). It needs to encompass all key actors (Jääskelainen et al., 2014) and facilitate collaboration where multiple parties are involved (Pekkola and Ukko, 2016). In many outsourced project environments, the key actors come together in a temporary organisation, with multiple parties often comprising of different companies that work together for the common good of the project.
Two key criteria of project management (PM) success that are typically measured by the PMS in such environments are the extent to which the project is delivered to cost and to time; with performance typically being measured quantitatively in terms of: adherence to, and variance from, baselined budgets (cost) and schedules (time). Traditionally the PMS would comprise of two separate and un-linked systems, one focused on the budget and one on the schedule. This lack of integration between the two systems is a potential weakness in terms of quality of the feedback given to the project team. For example, the cost-based data might show that the project is over-spending, yet without cross-reference to the time-based data, which might be difficult and cumbersome to do, given that it will be held in a completely different system, the reason for the over-spend is not immediately clear. It could be that the project is in trouble in terms of adhering to the budget i.e. the work scheduled was completed to plan but cost more than was originally estimated. Alternatively, it is in trouble in terms of adhering to the schedule i.e. the cost estimates were accurate but there was less work done than planned. A similar lack of clarity can exist when trying to understand the reasons for and the implications on the budget of a lack of progress against the schedule.
3
the Earned Value (EV). Hence it gives a more complete picture as to the reasons for and consequences of over-spend, under-spend, early and late delivery. In doing so, it potentially passes one test of a well-designed PMS, which is to align at both the strategic and operational levels (McAdam, et al., 2014). It does this by providing detailed information at the project level, useful for managing the day-to-day activities, whilst also providing information of the overall performance of the project, through reporting the EV, which is particularly useful for those at a strategic level above the project.
Yet EVA-based performance measurement is far from being universally adopted in all projects and, whilst there are reports of its effectiveness (see, for example, DeMarco et al., 2009 and Chou et al., 2010), there are also reports that highlight negative outcomes of using EVA (i.e. Vargas, 2003 and Lukas, 2008). In addition, with some notable exceptions, there is still a paucity of empirical studies focused on the experiences of using EVA on live projects and an over-reliance on anecdotal data when selling its benefits. Much of the recent EVA literature is conceptual in character, looking to refine and extend, with illustrative examples or simulations, the EVA techniques (see, for example, Chen et al., 2016, Acebes et al., 2015, Colin, et al., 2015 and Narbaev and De Marco, 2014). Whilst such work is worthy, the need for empirical work on the topic provides a rationale for this paper, which seeks to answer the research question: What are the conditions of success for EVA-based methods for performance measurement in project environments?
4
undertaking performance measurement, as such projects create coalitions (Winch, 1989) made up of temporary multi-organizations (TMOs) (Cherns and Bryant, 1984). In a TMO, the project team comprises of people that differ not only in their roles and responsibilities but also in their affiliation to different companies. Overcoming the differences is a further challenge to meet for effective performance measurement to take place.
To address the research question we view the use of EVA-based methods in such outsourced projects through the theoretical lenses of agency theory and organizational justice theory. Given our study’s emphasis on the crucial role of the relationship between the dyad of client and contractor, agency theory appears to provide a suitably firm alternative theoretical anchor for our research. In addition, our study has novelty by using a second theory, namely organizational justice, to support the analysis of the conditions for success of EVA in such project environments.
5 2. Literature Review
2.1 The agency problem in projects
Many projects involve clients and vendors from different companies and create potentially difficult to manage principal-agent relationships – leading to the so-called “agency problem”. A principal-agent relationship exists where there is a contract by which a person “the principal” engages another person “the agent” to perform a service on his or her behalf;
and which involves the delegating of decision-making authority by the principal to the agent (Jensen and Meckling, 1976). In such projects, the principal is in an owner (client) organisation and the agent is a different project (contractor) organisation (Turner and Műller, 2004). (In the remainder of the paper, the terms “client” and “contractor” denote principal and agent, respectively, in an outsourced project environment. The term “outsourced project(s)” denoting those where the principal and the agent reside in different companies.)
Agency theory has proved useful in facilitating understanding of a variety of non-project specific outsourcing environments. See for example: Zhang et al., 2015; Van der Valk and Iwaarden, 2011; Bhattacharya et al., 2013; Ruth et al., 2015; Gorla and Somers, 2014; Chen and Anandhi, 2009; Taylor, 2007; Lamminmaki, 2011; Gefen et al., 2008; Liberatore and Wenhong, 2010; Handley and Gray, 2013. Hence, our confidence that it would provide useful insights relating to the use of EVA for measuring performance in outsourced projects.
6
relating to the perceived appropriateness of decisions being made by the contractor, referred to as the “adverse selection problem” (Turner and Műller, 2004). There may also be opportunistic
behaviour on the part of the contractor if they decide to act on information not shared in ways that are not beneficial to the client. Such opportunistic behaviour is a fundamental assumption of agency theory, where people act in their own self-interest. Which is referred to as the “moral hazard problem” (Turner and Műller, 2004). In this context, they act in the interest of their
own company at the expense of the project.
Early work in the 1970’s and 1980’s on developing agency theory focused on the “contract” as the unit of analysis (Melnyk, et al. 2004) and the various factors that influence
the choice of contract. For example, an early distinction is between outcome and behaviour-based contracts, which is roughly equitable to the distinction between fixed and fee-for-service contracts. With an early proposition of agency theory being that where the contract is outcome based – or the principal has information to verify the behaviour of the agent - the agent is more likely to act in the principal’s best interest (Eisenhardt, 1989).
Moving into the 1990’s there is recognition that other concepts besides the contract could be used as motivating and control mechanisms to address the agency problems – with one such concept being that of the metric. Here, it is the metric, used in tandem with the contract, which allows the principal to manage and direct the activities of the agent and hence propositions relating to the development, selection, use and refinement of metric are developed (Melnyk, et al. 2004). For PM this would mean a focus on the individual metrics, the sets of metrics and
7 2.2 Use of EVA for performance measurement
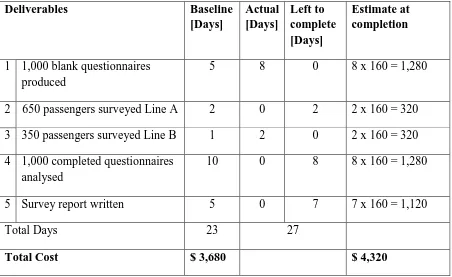
The building blocks for EVA are those found in traditional PM approaches. A list of deliverables needs to be constructed, which is a constituent of a planning process that results in a product-oriented work breakdown structure (Ruskin, 2004). To illustrate this using a simple example, table 1 shows a list of 5 deliverables that make up a project to write a report on the attitudes and experiences of rail passengers travelling on two particular routes (Line A and Line B). Corresponding to each deliverable is an estimate of how long it will take in days to produce, which is recorded in the 2nd column: Baseline [Days]. In the example, a daily cost of $160 is used. Hence the total estimate for the cost of the project is the total number of days (23) x $160 = $3,680 – also referred to as the Budget at Completion (BAC). Baseline costs can also be identified for each deliverable i.e. for the first one, 1,000 blank questionnaires produced, it is $160 x 5 days i.e. $800.
Take in table 1
The next stage involves the creation of a dependency network, resulting in a baseline plan shown in figure 1. This shows that the project will take 4 weeks and 2 days to complete, if everything goes to plan.
Take in figure 1
8
collect the following information: 1) how many days of work spent working on the deliverable 2) how many days needed to complete the work and provide the deliverable.
In table 1 and figure 1 the EVA calculations are given for the monitoring point (MP now) at the end of week 2. Table 1 shows the information on work completed and left to do in columns 3 and 4. A new calculation of the estimated cost at completion (EAC) can also be calculated - in this case it is now estimated to take 27 days rather than the original 23 days i.e. 27 x $160 = $4,320 and revised costs for each individual deliverable can be generated, as shown in column 5 of table 1. With the baseline plan frozen, as the tracking of progress takes place a, there is the creation of second plan reflecting the status. This plan is shown in figure 1 and allows a simple visual comparison be made between the current and the baseline plan. This highlights though the end of project milestones that the project will finish 2 days later than originally planned. Next three EVA metrics are calculated; the PV, EV and AC. Their definitions are as follows:
PV (Planned Value) – the budgeted cost of work scheduled at the monitoring point
in time (MP now). This being taken from the baseline plan and was previously referred to as the BCWS.
EV (Earned Value) – the budgeted cost of work performed at MP now. Again, this
is with reference to the baseline plan - referred to previously as the BCWP.
AC (Actual Cost) – the actual cost of work performed at MP now, previously referred
to as ACWP.
9
So the PVs are 320 and 160. For deliverable 2 no work has been done, so the EV is 0. For deliverable 3 the deliverable is 100% complete, so the EV = 1 x 160 =$160, though 2 day’s work were carried out, giving an AC of $320. Deliverable 4 was expected to have 3 days of work undertaken by MP now, hence a PV of $480, yet it has not been started (EV = 0). The last deliverable was not expected to have been started at MP now (PV = 0) and indeed that is the case (EV =0).
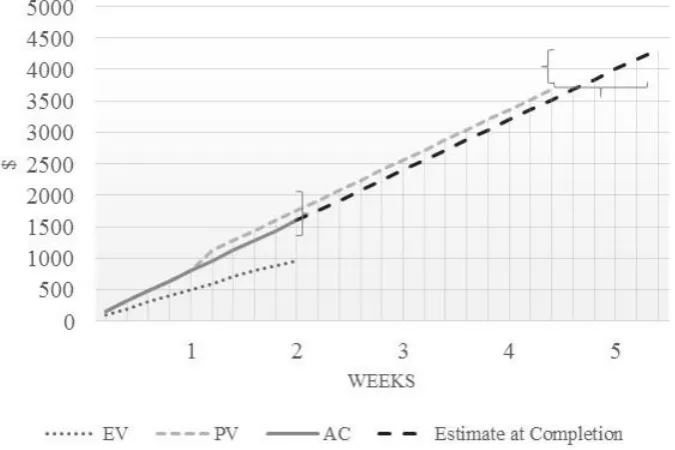
In the example one previous MP (MP-1w) would have been passed, with the EVA calculations collected at that point and, hence, for reporting purposes those figures for MP now would be added to those for MP-1 (as shown in figure 2 below). As the project progresses and each MP reached the PV, EV and AC would build up cumulatively. In the example, at MP they are now $1,760, $960 and $1,600 respectively.
The data from the EVA analysis is then typically put into graphical form to facilitate the communicate progress. For the illustrative example, this is in figure 2. The figure shows that against the baseline there is an underspend but that this is reflected in the fact that progress has been much slower than expected and indeed the graph predicts that if the current trend continues the project will actually be late and also over-budget. In non-EVA PMS’s the information to make such a prediction will exist but might typically be held in different places and in different systems i.e. a scheduling system and cost control system. Hence, it is not such an easy task to marry the two systems as it is with the EVA output shown in figure 2.
Take in figure 2
10
Cost Variance (CV) = EV – AC = 960 – 1600 = -640
Schedule Variance (SV) = EV – PV = 960 – 1760 = -800
Cost Performance Index (CPI) = EV/AC = 960/1600 = 0.60
Schedule Performance Index (SPI) = EV/PV = 0.55
To Complete Performance Index [based on BAC] (TCPI) = (BAC-EV/BAC-AC) =
(3680-960/3680-1600) = 1.31
Negative CV and SV values reflect a lack of progress against the plan, as does a CPI less than 1. The CPI is a particularly powerful index as it reflects how much it costs to earn one dollar of budget i.e. it is a value for money indicator (Wake, 2008, p. 25-29). In the example 0.60 means for every dollar spent the project is earning $0.60 or, put another way, to earn $1 of value it costs $1.67. The TCPI is also a useful index as it shows the uplift in cost performance required to complete the remaining work as per the baseline, with a rule of thumb being that once it goes above 1.1 such a shift in performance is difficult to achieve.
In theory, using EVA mitigates for some of the agency problems highlighted earlier in the paper. The sharing of the graphical outputs enables all parties to obtain a visual and easy to understand report as to the salient points re project performance (Chou et al., 2010). Such graphical outputs, along with the simple EVA calculations, help to raise awareness of performance trends (Anbari, 2003). This can reduce information asymmetry from the perspective of the client, leading to greater trust for the client. As a method, its key advantage is the low level of effort required to track the performance of a project (Kerkhove and Vanhoucke, 2017).
11
2009). For example, parameters can be set, such as the CPI dropping below 0.9 that automatically trigger exception reports requiring some corrective action.
Whilst in theory the use of EVA makes sense there are potential limitations and obstacles to its use. These cover system, relational, organizational and cultural-related problems and highlight that the way EVA is both designed, integrated into other elements of the PM system and operated is important (Kim et al., 2003).
In terms of limitations of EVA, there are literatures that focus on the method itself. Much of the limitations focus on the deterministic project duration and cost forecasting formulae (Kim and Kim, 2014) and the fact that traditional EVA-based formulae for cost and schedule forecasting do not deal with uncertainty and do not provide information on a range of possible outcomes (Kim and Reinschmidt, 2010). A further limitation is the assumption that each activity or costed element is independent (Kim and Ballard, 2002). These limitations restrict the predictive power of EVA metrics, such as the PV (Chen, et al., 2016). Hence, one area of attention has been to address the deficiencies by integrating EVA with other methods to deal with uncertainty and risk, such as fuzzy logic, exponential smoothing, logarithm linear transformation, non-linear cost profiling and reference class forecasting (Naeni, et al., 2011; Chen, et al., 2016; Warburton and Cioffi, 2016; Batselier and Vanhoucke, 2017). Or else, by creating new EVA metrics, such as the Customer Earned Value (CEV) (Kim and Ballard, 2002; Kim, et al., 2016). Such approaches seek to avoid unrealistic EVA metrics such as PV and BAC, which undermine the integrity of the method when reporting the EV. For example, they build buffers into the initial planning that reflect uncertainty making the initial planning more realistic.
12
and for the EVA system to treat people in an equitable, impartial and fair way in terms of assessing performance (Storms, 2008; Vargas, 2005). This need for fairness in the design and operation of the EVA system highlights the potential important role of organizational justice in ensuring EVA contributes to successful PM. In an outsourced project, organizational justice is about how the individuals in the TMO from the client and the contractor organizations perceive their treatment in relation to the measuring and rewarding performance. Organizational justice theory states there are three elements of justice that affect individual perceptions. Firstly, “distributive justice”, which relates to the fair distribution of outcomes, such as payment for work undertaken (Greenberg, 2009). Secondly, “procedural justice”,
which relates to the processes and procedures used to make decisions (Luo, 2007). Thirdly, “interactional justice”, which relates to the treatment of an individual on a personal level
(Colquitt, et al. 2001). Evidence suggests the most beneficial outcomes when all three elements of organizational justice are present (Colquitt, et al. 2005).
Hence, one can posit that if the EVA system contributes to high levels of organizational justice amongst the individuals in the TMO then the EVA metrics will drive positive behaviours that will be to the benefit of the project. For example, adopting fair procedures in delivering bad news shows positive responses from the individuals concerned, despite the bad news being shared (Richter, et al., 2016). Furthermore, when there is a perception that procedures are fair, individuals are more likely to be open with and trusting of other people, which has a positive effect on co-operative behaviours between team members (Lui and Ngo, 2004).
3. Method
13
empirical evidence about a phenomenon (Eisenhardt, 1989a) – as with the topic of EVA implementation. It is also an approach that has been previously utilized in operations management research to gain better understanding of aspects of project management (see, for example, Mello, et al., 2015; Reddy et al., 2013; Verma and Sinha, 2002) and performance measurement (see, for example, Pellinen et al., 2016). Therefore, using multiple case studies offers the prospect of developing a good understanding of the impact of using EVA in a project environment. Having decided upon a multiple case study approach, the guidance provided by Stuart et al., (2002) on undertaking effective operations management/project management case research informed the specific research method adopted for the study.
The unit of analysis was the outsourced project, with the project organisation being conceptualised as a temporary-multi-organisation (TMO) between client and contractor.
3.1 Sample selection
The sample comprised of two projects that utilised EVA to monitor progress on a day-to-day basis, with one classed as “successful” from a PM point of view and one classed as “unsuccessful”. PM success were defined as a multi-dimensional construct, which is consistent
14 3.2 Data collection and analysis
There were diverse sources for data collection, which enables data triangulation and enhances reliability (Barratt, et al., 2011). Initially a complete picture of the wider macro-environment in which each project was undertaken was painted. It was important to understand activities undertaken before the project started and by other groups in the client organisations, such as contract management. Hence, there were meetings held with the client representatives to gain a sound understanding of any strategic evaluation activities undertaken pre-contract award, the nature of the contract between the client and contractor(s) and the PM structures, systems and personnel in place prior to project execution. As well as talking to clients, where appropriate, there was access given to the researchers of non-confidential documentation detailing the processes and procedures relating to the PM systems. In addition, desk research was undertaken to collect secondary data in the public domain relating to the client and contractor organisations i.e. their ownership structures, markets, products, services etc.
After gaining a sound understanding of the macro-project environment, data collection focuses on the execution stage of each project. This took the form of semi-structured interviews with staff working for both client and contractor on the project including client and contractor project managers. Various project documentation produced during execution were also analysed.
The first stage of the data analysis involved initial sense making of each case. This enabled an understanding of the variables that potentially shed light on the reasons for the different levels of project performance. It also allowed for cross case analysis to be undertaken. Data held in the interview transcripts were analysed using a phrase as the unit of analysis. To enhance reliability and validity two members of the research team independently coded the data.
15 4. Summary of case studies
4.1 Airport Terminal Construction
This project utilized EVA and was a successful from a PM perspective. The client was highly satisfied with the outcome. It finished on time, with the outturn cost perceived to offer a high level of value for money. The scope was the construction of a new purpose built terminal that was part of a wider refurbishment programme. The programme value was approximately $300 billion and the original cost for the project was $1130 million. It would result in a terminal approximately 6 times larger than the existing terminal, complete with up-to-date facilities for the air traveller, including leisure and retail offerings. The client was the owner of the airport and the contractor comprised of a joint venture between two contracting organisations. A Managed Service Provider (MSP) appointed by the client provided a full client programme management service. The MSP had a long-term contract to provide such a service to the client. Incentivised contracts were let on a competitive basis. The project duration from demolition of old terminal buildings to the opening of the new terminal was 5 years.
An EVA Master Report presented the EV, AC, CPI and CV, as well as other EVA metrics, for the project as a whole, though the option to drill down and report on the EVA calculations for individual components was possible. In order to ensure there was a minimum level of understanding there was extensive EVA training across the project team disciplines.
16
There was a clear understanding of which work was critical to the overall completion of the project i.e. the activities on the critical path. With particular attention paid to the EVA calculations relating to activities on this path. As illustrated by a situation with one year left in the execution phase of the project when it became clear that the indicators (SPI etc.) were showing it unlikely that the project would be completed on time, unless dramatic changes were achieved in performance. In response, the client introduced more incentives, including completion bonuses, as well as giving up the liquidated damages arising from previous late delivery. These actions re-mobilized the project team and helped ensure the project completed to schedule.
The attention given to the implementation of the EVA-based system was evident throughout its use. A lot of time was spent on education and training of the TMO in relation to the whole PM process, including the use of EVA. There was also recognition in the client and MSP organisations that some in the TMO saw the PMS as, at best, a necessary evil and that buy-in was needed to obtain data that accurately reflected the actual progress being made. To this end, there was time spent explaining and talking face-to-face with individuals and teams in the supply-side of the TMO about the benefits and reasons for collecting all the detailed tracking data to enable the EVA metrics to be derived.
4.2 Haemophilia Drug Trial
17
able to market the drug for the treatment of haemophilia. The cost of the project was approximately $3m. The project scope included the identification and monitoring of suitable patients. The project was set up on a fixed price basis, through a competitive bidding process. The client and the contractor had not worked together before. It was planned to be completed within a 22-month time period.
The client decided to adopt an EVA-based approach to monitor progress and to pay the contractor for work undertaken. On a monthly basis, the client derived the EVA using data on progress provided by the contractor. The metrics reported were PV, EV, AC and EAC, though indices were not calculated. A deliverable classed as a certain percentage complete i.e. 50% triggered payment.
This was the first time that the client and the contractor had used EVA. There was no formal training provided and no activities linked to getting buy-in from the contractor to the approach by the client prior to starting the project.ni
At a very early stage, the EVA metrics flagged up that the project was hitting problems. The EV was less than the PV and the AC was greater than the EV, so the deliverables were being provided slower than planned for in the baseline and those provided were costing more money to deliver than originally estimated. Both parties were unhappy. The client because they were not receiving the products they wanted on time. The contractor because they were incurring additional costs in undertaking the activities, yet as payments were linked to the deliverables they were not being paid for the extra work undertaken. As the weeks passed, the EVA metrics clearly showed that the problem was getting bigger: the SV and CV were both negative and the absolute value of both was getting larger.
18
getting the deliverables as planned. Hence, the client withheld payments to the contractor. For the contractor the SV and CV were evidence of an unrealistic BAC and PV, which was, in their opinion, the result of the project being much more complex and difficult to deliver than originally thought. The client’s response to this was unsympathetic, responding that the
contractor had accepted the risk when signing the contract. These opposing views were not reconciled. With no agreement between the two parties on a strategy for getting the project back on track the client cancelled the contract.
5. Cross-case analysis
Overall patterns are detectable between the two projects that, through the lenses of agency theory and organizational justice, provide indications of some of the conditions of success for the use of EVA.
The project with the highest level of goal conflict was the Haemophilia Drug Trial. This high level of goal conflict was evident in some of the language used by participants, with references made to it being a “battle” and “bombardments” taking place in project meetings.
The root cause of this conflict was an outcome-based contract which reflected a widely optimistic estimate of the costs to deliver the project and which made no allowance, in the form of a contingency budget, for uncertainty and risk. The other project did not exhibit such goal conflict. They paid great attention to dealing with uncertainty and risk by building “shock absorbers” into the program, basing the data produced from the EVA formulae realistic
estimates.
19
opportunistic behaviour and information asymmetry. The contractor failed to share information with the client, which might have helped to alleviate some of the client’s concerns and help address the low level of trust that was building up in the client organisation, and the high levels of concealment of negative outcomes on the part of both parties.
The fact that EVA-based metrics was used on this project could be interpreted as evidence of its ineffectiveness and yet, if one looks at the level of information available to verify contractor performance it is clearly very high. Such a condition is favourable in terms of delivering successful outcomes. In agency theory, it is also suggestive of a positive relationship with the selection of outcome-based contracts, which was the case in the Airport Terminal Construction project. Indeed, for both the projects, the PMS was highly effective in providing the client with the right information in a timely fashion to verify contractor performance. EVA did its job in terms of acting as an effective set of metrics for performance measurement.
The distinguishing feature between the two projects as to why this did not translate into project success and client satisfaction for both was in large parts down to the different responses of the client organisations. In the Haemophilia Drug Trial the metrics flagged up very early the flaws with the contractor’s pricing model. Hence exposing the inadequacies of the baseline budget and schedule. Rather than addressing these flaws and inadequacies the client withheld payments for non-performance, as highlighted early on in delivery by the EVA-metrics and they insisted that the contractor bore all the costs associated with the realised risk of underestimating the costs of delivering the project.
20
evidence of some of the other desirable factors to address the agency problem being present. Yet these did not prove problematic as the lack of information asymmetry, coupled with the extensive amount of information generated to verify contractor performance, meant the relationship between client and contractor, as reflected in the revised contractual arrangements, was resilient to instances of high threat.
Viewed through the prism of organizational justice, there is clear differences in the PM conditions between the two projects. Great attention given in the Airport Terminal Construction project to ensuring that the contracting organizations perceived the EVA system as fair. In the words of one of the client staff members:
“… the key is having the right behaviours and attitudes. … We’re not gathering data
[using the EVA system] to beat them [contractors and suppliers] up, we are gathering data and analysing the data and providing valued outputs to the benefit of everybody.”
In the Haemophilia Drug Trial a very different picture is painted relating to the interaction between client and contractor through the EVA system, as described by a client representative:
“… they [the contractor] would bring all their people and you would get bombarded … At the end of the day you can just show them the [EVA] graph and just say “that’s fine - but
this is where we are”.”
These two quotes demonstrate very different scenarios in terms of the dealings between individuals on a personal level, illustrating that interactional justice was high for the Airport Terminal Construction project and low for the Haemophilia Drug Trial.
21
in the contractor organization from the start that the new EVA system was imposed without any discussion or input from them and hence inherently unfair and loaded in favour of the client. So by comparison procedural justice was low.
The payment for work undertaken, which relates to distributive justice, was a major issue on the Haemophilia Drug Trial, with the contractor’s negative view of EVA being in part due to the fact that “it’s not working for us.” The contractor’s viewpoint was that they were
spending many hours on essential tasks, such as teleconferences, not explicitly linked to a deliverable. Hence, the EV calculations did not recognise them and the client did not pay for them. By contrast in the Airport Terminal Construction project the client recognised that the contractor needed to be fairly paid for work undertaken and that this involved ensuring that the definitions of “value” aligned both client and contractor perspectives. By doing so, distributive
justice was high, whereas it was low on the Haemophilia Drug Trial.
6. Discussion
22
A second condition for success is the avoidance or quick resolution of agency-related problems. A common and potentially destructive agency problem is goal conflict. Through its visually arresting graphical reporting and use of indices that set clear parameters to trigger timely corrective action, the cases confirm that the method quickly raises awareness of performance trends (Anbari, 2003). In addition, the two projects confirm the method is highly efficient and effective in terms of the level of effort required to track performance (Kerkhove and Vanhoucke, 2017).
The EVA graphs, showing a small number of key metrics, alongside the judicial use of indices to set tolerances provide a highly effective and efficient early warning system of potential goal conflict in outsourced projects. Using this approach proves to be effective in addressing another agency problem, high information asymmetry, that typically exists between client and contractor when outsourcing has taken place, regardless of whether the project is ultimately successful or not; with such a reduction in information asymmetry illuminating situations in which the client and the contractor are in conflict.
23 6.1 Framework of EVA Conditions and Propositions
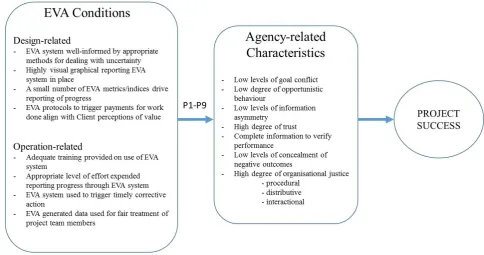
Figure 3 shows the framework of EVA conditions for project success. As discussed earlier in the paper, a combination of design-related and operational-related EVA conditions influence project success by helping ensure that favourable agency-related characteristics are present. The agency-related characteristics shown in the framework combine elements of agency theory and organisational justice theory.
Take in Figure 3
The framework enables the derivation of a number of propositions. The overall proposition (P1), as shown by the arrow between the EVA Conditions and Agency-related Characteristics is: A well-designed and well-operated EVA-based system for reporting project progress is more effective at ensuring the agency-related characteristics conducive to success
are present than a non-EVA-based system.
In terms of the design-related conditions in the framework, there are four derived propositions. The first relates to the need for the EVA metrics to utilise methods for dealing with uncertainty such as fuzzy logic and exponential smoothing. In doing so, the data generated is more likely to be an accurate representation of the actual performance of the project. Such accurate representation helps addresses agency problems and hence P2 is: An EVA-system well informed by appropriate methods for dealing with uncertainty is more likely to address agency
problems than one that is not. P3 is: An approach based on a highly visual graphical reporting
of EVA generated data is more effective in communicating progress than one based on
reporting the values calculated through the EVA metrics; and such communication helps
overcome agency problems. This proposition suggests that a focus of EVA design needs to be
24
generation of the data itself. Linked to this is the fourth proposition highlighting the need for simplicity and clarity in choosing the EVA metrics and indices to report progress, so that the project is not drowned with irrelevant information. Hence P4 is: A small number of simple EVA metrics/indices are more effective at communicating performance of the project, which
will better address agency-related problems, than a large number that includes ones generated
by complicated calculations. The final design-related proposition, P5, is: EVA is most powerful
as a means of control if it includes protocols to trigger payments for work done and that these
triggers are aligned with the client’s perceptions of value; such alignment ensures the
agency-related characteristics conducive to success are present. So there must be a clear link between
the work undertaken and the outputs delivered to the client, as measured by the EVA system. The first of four propositions relating to the operation of the EVA system focuses on the crucial role of adequate training of all members of the project team, including the contractor, in the use of the system. Hence P6 is: The EVA system operates most smoothly when the client invests in adequate training and awareness raising in the use of the system for
all member of the project team; with such a smooth operation helping to ensure the
agency-related characteristics conducive to success are present. P7 is: The EVA system is likely to
remain most useful during project execution, and addressing agency-related problems, if a
level of effort deemed appropriate by all project team members is expended in reporting
progress through the system. This is likely to be influenced by decisions made at the design
25
when the EVA system triggers a call for corrective action; acting on such calls is necessary to
ensure the agency-related characteristics conducive to success remain present. As well as
being used to control, an effective EVA system drives desired behaviours amongst the project team members. It is a moot point as to which is the most important element, a “control”-based EVA system or a “behaviour”-based one, which highlights that not only is the
interdependencies between elements important but their relative strength of association with the agency-related characteristics. In terms of driving behaviours the final proposition (P9) is: EVA generated data will only drive the desired behaviours of the project team members by the
client when it is used for the fair treatment of individuals and organisations that make up the
TMOs; such treatment is necessary to ensure the agency-related characteristics conducive to
success remain present. This aspect of the EVA is likely to be highly associated with
perceptions of organisational justice, a concept recognised as leading to enhanced project performance.
In summary, the framework shows how agency-related characteristics, derived from agency and organisational justice theory, relate to project success. The framework further shows that conditions relating to both the design and the operation of the EVA method are antecedents to such conditions.
6.2 Future work
Overall, prior research into the use of EVA has produced mixed results in terms of its impact on project success. Some have reported its positive impact, for example, DeMarco et al. (2009) and Chou et al. (2010) whilst others report a negative impact, i.e. Vargas 2003 and
26
agency and organisational justice that has the potential to explain any contradictory findings in relation to the impact of EVA. Future work should validate the proposed framework with a particular focus being on a large-scale quantitative study. Such a study would explore the propositions and test the strength of the relationships between the main constructs i.e. EVA conditions (design and operational), agency-related characteristics and project success and the strength of the interdependencies between items in the EVA conditions construct, would build on the research findings reported here.
6.3 Practical implications
27 6.4Limitations
Our research has a number of limitations that future studies can address. Firstly, our theoretical lens is that of agency and organisational justice. Further research could incorporate other lens through which to view project success and then validate the EVA conditions of success through a modified and extended theoretical framework. Secondly, we develop the framework from a synthesis of the literature and from the findings of two case studies. This means that claims of wider generalisability of the results are not possible. Further empirical study is required to test its wider validity, incorporating data from other project contexts besides construction and clinical trials.
7. Conclusions
28 Acknowledgements
29 References
Acebes, F., Pereda, M., Poza, D., Pajares, J., Galán, J., 2015. Stochastic earned value analysis using Monte Carlo simulation and statistical learning techniques. International Journal of Project Management, 33 (7), 1597-1609.
Anbari, F.T., 2003. Earned Value Project Management Method and Extensions. Project Management Journal, 34 (4), 12-23.
Barratt, M., Choi, T.Y., Li, M., 2011. Qualitative case studies in operations management: Trends, research outcomes, and future research implications. Journal of Operations Management, 29 (4), 29 (4), 329-342.
Batselier, J., vanhoucke, M., 2017. Improving project forecast accuracy by integrating earned value management with exponential smoothing and reference class forecasting. International Journal of Project Management, 35 (1), 28-43.
Bhattacharya, A., Singh, P.J., Bhakoo, V., 2013. Revisiting the outsourcing debate: two sides of the same story. Production Planning and Control, 24 (4/5), 399-422.
Chen, Y., Anandhi, B., 2009. An Empirical Analysis of Contract Structures in IT Outsourcing. Information Systems Research, 20 (4), 484-506.
Chen, H.L., Chen, W.T., Lin, Y.L., 2016. Earned value project management: Improving the predictive power of planned value. International Journal of Project Management, 34 (1), 22-29.
30
importance of project success/failure factors. International Journal of Operations & Production Management, 34 (3), 364 – 389.
Cherns, A.B. & Bryant, D.T., 1984. Studying the client's role in construction management. Construction Management and Economics, 2 177-184.
Chou, J-S., Chen, H-M., Hou, C-C., Lin, C-W., 2010. Visualized EVM system for assessing project performance. Automation in Construction, 19 (5), 596-607.
Colin, J., Martens, A., Vanhoucke, M., Wauters, M. A., 2015. Multivariate approach for top-down project control using earned value management. Decision Support Systems, 79, 65-76.
Colquitt, J.A., 2001. On the Dimensionality of Organizational Justice: A Construct Validation of a Measure. Journal of Applied Psychology, 86 (3), 386-400.
Colquitt, J.A., Greenberg, J., Zapata-Phelan, C.P., 2005. What is Organizational Justice? A Historical Overview. In: Greenberg, J., Colquitt, J.A. (eds.) Handbook of
Organizational Justice. Lawrence Erlbaum Associates, Mahwah, NJ, US.
DeMarco, A., Briccarello, D., Rafele, C., 2009. Cost and Schedule Monitoring of Industrial Building Projects: Case Study. Journal of Construction Engineering and Management, 135 (9), 853-862.
DeMarco, A., Briccarello, D., Rafele, C., 2009. Cost and Schedule Monitoring of Industrial Building Projects: Case Study. Journal of Construction Engineering and Management, 135 (9), 853-862.
31
Eisenhardt, K.M., 1989a. Building theories from case study research. Academy of Management Review, 14 (4), 532-550.
Gefen, D., Wyss, S., Yossi, L., 2008. Business Familiarity as Risk Mitigation in Software Development Outsourcing Contracts. MIS Quarterly, 32 (3), 531-542.
Gorla, N., Somers, T.M., 2014. The impact of IT outsourcing on information systems success. Information and Management, 51 (3), 320-335.
Greenberg, J., 2009. Everybody Talks about Organizational Justice but Nobody does Anything about it. Industrial and Organizational Psychology, 2 (2), 181-195.
Jääskeläinen, A., Laihonen, H., Lönnqvist, A. 2014. Distinctive features of service performance measurement. International Journal of Operations & Production Management, 34(12), 1466-1486.
Jensen, M.C., Meckling, W.H., 1976. Theory of the Firm: Managerial Behavior, Agency Costs and Ownership Structure. Journal of Financial Economics, 3 (4), 305-360.
Kerkhove, L-P., Vanhoucke, M., 2017. Extensions of earned value management: Using the earned incentive metric to improve signal quality. International Journal of Project Management, 35 (2), 148-168.
Kim, B-C., Kim, H-J., 2014. Sensitivity of Earned Value Schedule Forecasting to S-Curve Patterns. Journal of Construction Engineering and Management, 140 (7), 04014013.
32
Kim, E., Wells Jr, W.G., Duffey, M.R., 2003. A model for effective implementation of Earned Value Management methodology. International Journal of Project Management, 21 (5), 375-382.
Kim, T., Kim, Y-W., Cho, H., 2016. Customer Earned Value: Performance Indicator from Flow and Value Generation View. Journal of Management in Engineering, 32(1), 04015017(7).
Kim, Y., Ballard, G., 2002. Customer-earned-value method. Journal of Construction Research, 3 (1), 55-66.
Lamminmaki, D., 2011. An examination of factors motivating hotel outsourcing. International Journal of Hospitality Management, 30 (4), 963-973.
Libertore, M., Wenhong, L., 2010. Coordination in Consultant-Assisted IS Projects: An Agency Theory Perspective. IEEE Transactions on Engineering Management, 57 (2), 255-269.
Lui, S.S., Ngo, H.-y., 2004. The Role of Trust and Contractual Safeguards on Cooperation in Non-equity Alliances. Journal of Management, 30 (4), 471-485.
Luo, Y., 2007. The Independent and Interactive Roles of Procedural, Distributive and
Interactional Justice in Strategic Alliances. Academy of Management Journal, 50 (3), 644-664.
33
McAdam, R., Hazlett, S-A., Galbraith, B. 2014. The role of performance measurement models in multi level alignment: An exploratory case analysis in the utilities sector. International Journal of Operations and Production Management, 34 (9), 1153-1183.
Mello, M.H., Strandhagen, J.O., Alfnes, E. 2015. Analyzing the factors affecting coordination in engienrr-to-order supply chain. International Journal of Operations & Production Management, 35(7), 1005-1031.
Melnyk, S.A., Stewart, D.M. & Swink, M. 2004. Metrics and performance measurement in operations management: dealing with the metrics maze. Journal of Operations Management, 22 (3), 209-217.
Naeni, L.M., Shadrokh, S., Salehipour, A., 2014. A fuzzy approach for the earned value management. International Journal of Project Management, 29 (6), 764-772.
Narbaev, T., De Marco, A., 2014. An Earned Schedule-based regression model to improve cost estimate at completion. International Journal of Project Management, 32 (6), 1007-1018.
Owen, J., Linger, H., 2011. Knowledge-based Practices for Managing the Outsourced Project. Scandinavian Journal of Information Systems, 23 (2), 85-108.
Pellinen, J., Teittinen, H., Järvenpää, M. 2016. Performance measurement system in the situation of simultaneous vertical and horizontal integration. International Journal of Operations & Production Management, 36(10), 1182-1290.
34
Raby, M., 2000. Project Management via Earned Value. Work Study, 49 (1), 6-9.
Reddy, S., Raja, M., Nasina, J., Prabhu, K., 2013. Key Determinants of Successful Project Delivery in Pharmaceutical Outsourcing. IUP Journal of Operations Management, 12 (3), 6-15.
Richter, M., König, C.J., Koppermann, C., 2016. Displaying Fairness While Delivering Bad News: testing the Effectiveness of Organizational Bad News training in the Layoff Context. Journal of Applied Psychology, 101 (6), 779-792.
Ruth, D., Brush, T.H., Ryu, W., 2015. The use of information technology in the provision of HR compensation services and its effect on outsourcing and centralization. Journal of Purchasing and Supply Management, 21 (1), 25-37.
Shenhar, A., Dvir, D., Levy, O., Maltz, A.C. 2001. Project Success: A Multidimensional Strategic Concept. Long Range Planning, 34(6), 699-725.
Stuart, I.S., 2002. Effective case research in operations management. Journal of Operations Management, 20(5), 419-433.
Storms, K., 2008. Earned Value Management Implementation in an Agency Capital Improvement Program. Cost Engineering, 50 (12), 17-40.
Taylor, H., 2007. Outsourced IT Projects from the Vendor Perspective: Different Goals, Different Risks. Journal of Global Information Management, 15 (2), 1-27.
35
Turner, J.R., Műller, R., 2004. Communication and Co-operation on Projects Between the
Project Owner As Principal and the Project Manager as Agent. European Management Journal, 22 (3), 327-336.
Upadhaya, B., Munir, R., Blount, Y. 2014. Association between performance measurement systems and organisational effectiveness. International Journal of Operations and Production Management, 37 (4), 853-875.
Van der Valk, W., Iwaarden, J.V. 2011. Monitoring in service traids consisting of buyers, sub-contractors and end customers. Journal of Purchasing and Supply Management, 17 (3), 198-206.
Vanhoucke, M., 2011. On the dynamic use of project performance and schedule risk information during project tracking. Omega, 39 (4), 416-426.
Vargas, R.V., 2003. Earned value analysis in the control of projects: success or failure? AACE International Transactions, CS2.11-CS2.14.
Vargas, R.V., 2005. Using Earned Value Management Indexes as Team Development factor and a Compensation Tool. Cost Engineering, 47 (5), 20-25.
Verma, D., Sinha, K., 2002. Toward a theory of project interdependencies in high tech R&D environments. Journal of Operations Management, 20 (5), 451-468.
Winch, G., 1989. The construction firm and the construction project: a transaction cost approach. Construction Management and Economics, 7 (4), 331-345.
Yin, R. K., 1994. Case study research (2nd ed.). Sage, Thousand Oaks CA.
36
Wake, S., 2008. Earned Value Analysis (8th ed.). Steve Wake Projects Ltd, Palmers Green, London.
Warburton, R.D.H, Cioffi, D.F., 2016. Estimating a project’s earned and final duration.
International Journal of Project Management, 34 (8), 1493-1504.
37
Deliverables Baseline
[Days]
Actual [Days]
Left to complete [Days]
Estimate at completion
1 1,000 blank questionnaires produced
5 8 0 8 x 160 = 1,280
2 650 passengers surveyed Line A 2 0 2 2 x 160 = 320 3 350 passengers surveyed Line B 1 2 0 2 x 160 = 320 4 1,000 completed questionnaires
analysed
10 0 8 8 x 160 = 1,280
5 Survey report written 5 0 7 7 x 160 = 1,120
Total Days 23 27
[image:37.595.73.525.71.348.2]Total Cost $ 3,680 $ 4,320
38
[image:38.595.132.470.477.702.2]Figure 1: Rail passenger survey - schedule and EVA calculations
39