2952
Correlating neural and symbolic representations of language
Grzegorz Chrupała Tilburg University g.chrupala@uvt.nl
Afra Alishahi Tilburg University a.alishahi@uvt.nl
Abstract
Analysis methods which enable us to better understand the representations and functioning of neural models of language are increasingly needed as deep learning becomes the domi-nant approach in NLP. Here we present two methods based on Representational Similarity Analysis (RSA) and Tree Kernels (TK) which allow us to directly quantify how strongly the information encoded in neural activation pat-terns corresponds to information represented by symbolic structures such as syntax trees. We first validate our methods on the case of a simple synthetic language for arithmetic ex-pressions with clearly defined syntax and se-mantics, and show that they exhibit the ex-pected pattern of results. We then apply our methods to correlate neural representations of English sentences with their constituency parse trees.
1 Introduction
Analysis methods which allow us to better under-stand the representations and functioning of neu-ral models of language are increasingly needed as deep learning becomes the dominant approach to natural language processing. A popular technique for analyzing neural representations involves pre-dicting information of interest from the activation patterns, typically using a simple predictive model such as a linear classifier or regressor. If the model is able to predict this information with high accu-racy, the inference is that the neural representation encodes it. We refer to these asdiagnostic models. One important limitation of this method of anal-ysis is that it is only easily applicable to rela-tively simple types of target information, which are amenable to be predicted via linear regression or classification. Should we wish to decode acti-vation patterns into a structured target such as a syntax tree, we would need to resort to complex
structure prediction algorithms, running the risk that the analytic method becomes no simpler than the actual neural model.
Here we introduce an alternative approach based on correlating neural representations of sen-tences and structured symbolic representations commonly used in linguistics. Crucially, the cor-relation is in similarity space rather than in the original representation space, removing most con-straints on the types of representations we can use. Our approach is an extension of the Representa-tional Similarity Analysis (RSA) method, initially introduced by Kriegeskorte et al. (2008) in the context of understanding neural activation patterns in human brains.
In this work we propose to apply RSA to neural representations of strings from a language on one side, and to structured symbolic representations of these strings on the other side. To capture the sim-ilarities between these symbolic representations, we use atree kernel, a metric to compute the pro-portion of common substructures between trees. This approach enables straightforward compari-son of neural and symbolic-linguistic representa-tions. Furthermore, we introduce RSAREGRESS, a
similarity-based analytic method which combines features of RSA and of diagnostic models.
2 Related work
2.1 Analytic methods
The dominance of deep learning models in NLP has brought an increasing interest in techniques to analyze these models and gain insight into how they encode linguistic information. For an overview of analysis techniques, seeBelinkov and Glass (2019). The most widespread family of techniques are diagnostic models, which use the internal activations of neural networks trained on a particular task as input to another predictive model. The success of such a predictive model is then interpreted as evidence that the predicted in-formation has been encoded by the original neural model. The approach has also been called aux-iliary task(Adi et al.,2017), decoding(Alishahi et al., 2017),diagnostic classifier(Hupkes et al.,
2018) orprobing(Conneau et al.,2018).
Diagnostic models have used a range of predic-tive tasks, but since their main purpose is to help us better understand the dynamics of a complex model, they themselves need to be kept simple and interpretable. This means that the predicted infor-mation in these techniques is typically limited to simple class labels or values, as opposed to sym-bolic, structured representations of interest to lin-guists such as syntactic trees. In order to work around this limitationTenney et al.(2019) present a method for probing complex structures via a for-mulation named edge probing, where classifiers are trained to predict various lexical, syntactic and semantic relations between representation of word spans within a sentence.
Another important consideration when analyz-ing neural encodanalyz-ings is the fact that a randomly initialized network will often show non-random activation patterns. The reason for this depends on each particular case, but may involve the dy-namics of the network itself as well as features of the input data. For a discussion of this issue in the context of diagnostic models seeZhang and Bow-man(2018).
Alternative approaches have been proposed to analyzing neural models of language. For exam-ple, Saphra and Lopez (2019) train a language model and parallel recurrent models for POS, se-mantic and topic tagging, and measure the correla-tion between the neural representacorrela-tions of the lan-guage model and the taggers.
Others modify the neural architecture itself to make it more interpretable: Croce et al.
(2018) adapt layerwise relevance propagation (Bach et al., 2015) to Kernel-based Deep Archi-tectures (Croce et al., 2017) in order to retrieve examples which motivate model decisions. A vec-tor representation for a given structured symbolic input is built based on kernel evaluations between the input and a subset of training examples known as landmarks, and the network decision is then traced back to the landmarks which had most in-fluence on it. In our work we also use kernels be-tween symbolic structures, but rather than building a particular interpretable model we propose a gen-eral analytical framework.
2.2 Representation Similarity Analysis
Kriegeskorte et al.(2008) present RSA as a vari-ant of pattern-information analysis, to be applied for understanding neural activation patterns in hu-man brains, for example syntactic computations (Tyler et al., 2013) or sensory cortical process-ing (Yamins and DiCarlo, 2016). The core idea is to find connections between data from neu-roimaging, behavioral experiments and computa-tional modeling by correlating representations of stimuli in each of these representation spaces via their pairwise (dis)similarities. RSA has also been used for measuring similarities between neural-network representation spaces (e.g. Bouchacourt and Baroni,2018;Chrupała,2019).
2.3 Tree kernels
For extending RSA to a structured represen-tation space, we need a metric for measuring (dis)similarity between two structured representa-tions. Kernels provide a suitable framework for this purpose: Collins and Duffy(2002) introduce convolutional kernels for syntactic parse trees as a metric which quantifies similarity between trees as the number of overlapping tree fragments between them, and introduce a polynomial time algorithm to compute these kernels; Moschitti (2006) pro-pose an efficient algorithm for computing tree ker-nels in linear average running time.
2.4 Synthetic languages
con-trolled. The tradition goes back to the first gen-eration of connectionist models of language ( El-man, 1990; Hochreiter and Schmidhuber, 1997). More recently, Sennhauser and Berwick (2018) and Skachkova et al. (2018) both use context-free grammars to generate data, and train RNN-based models to identify matching numbers of opening and closing brackets (so called Dyck lan-guages). The task can be learned, butSennhauser and Berwick(2018) report that the models fail to generalize to longer sentences. Paperno (2018) also show that with extensive training and the ap-propriate curriculum, LSTMs trained on synthetic language can learn compositional interpretation rules.
Nested arithmetic languages are also appealing choices since they have an unambiguous hierar-chical structure and a clear compositional seman-tic interpretation (i.e. the value of the arithmeseman-tic expression). Hupkes et al.(2018) train RNNs to calculate the value of such expressions and show that they perform and generalize well to unseen strings. They apply diagnostic classifiers to ana-lyze the strategy employed by the RNN model.
3 Similarity-based analytical methods
RSA finds connections between data from two dif-ferent representation spaces. Specifically, for each representation type we compute a matrix of sim-ilarities between pairs of stimuli. Pairs of these matrices are then subject to second-order analysis by extracting their upper triangulars and comput-ing a correlation coefficient between them.
Thus for a set of objects X, given a similar-ity functionskfor a representationk, the function
Skwhich computes the representational similarity
matrix is defined as:
Sk(X) =U
Ui,j =sk(Xi, Xj), (1)
and the RSA score between representationskand
lfor dataX is the correlation (such as Pearson’s correlation coefficientr) between the upper trian-gularsSk(X)andSl(X), excluding the diagonals.
Structured RSA We apply RSA to neural repre-sentations of strings from a language on one side, and to structured symbolic representations of these strings on the other side. The structural proper-ties are captured by defining appropriate similarity
functions for these symbolic representations; we use tree kernels for this purpose.
A tree kernel measures the similarity between a pair of tree structures by computing the number of tree fragments they share. Collins and Duffy
(2002) introduce an algorithm for efficiently com-puting this quantity; a tree fragment in their for-mulation is a set of connected nodes subject to the constraint that only complete production rules are included.
FollowingCollins and Duffy(2002), we calcu-late the tree kernel between two trees T1 and T2
as:
K(T1, T2) =
X
n1∈T1
X
n2∈T2
C(n1, n2, λ), (2)
wheren1andn2are the complete sets of tree
frag-ments inT1andT2, respectively, and the function
[image:3.595.333.499.457.536.2]C(n1, n2, λ) is calculated as shown in figure 2. The parameter λis used to scale the relative im-portance of tree fragments with their size. Lower values of this parameter discount larger tree frag-ments in the computation of the kernel; the value 1 does not do any discounting. See Figure1for the illustration of the effect of the value of λon the kernel.
Figure 1: Distribution of values of the tree kernel for two settings of discounting parameter λ, for syntax trees of a sample of English sentences.
We work with normalized kernels: given a func-tionKwhich computes the raw count of tree frag-ments in common between treest1andt2, the nor-malized tree kernel is defined as:
K0(t1, t2) =
K(t1, t2)
p
K(t1, t1)K(t2, t2). (3)
C(n1, n2, λ) =
0, ifprod(n1)6= prod(n2)
λ, ifpreterm(n1)∧preterm(n2)
λQnc(n1)
[image:4.595.116.246.203.320.2]i=1 (1 +C(ch(n1, i),ch(n2, i), λ)) otherwise.
Figure 2: Dynamic programming formula for computing a convolution kernel, afterCollins and Duffy(2002). Herenc(n)is the number of children of a given (sub)tree, andch(n, i)is its ithchild;prod(n)is the production of noden, andpreterm(n)is true ifnis a preterminal node.
NP
N
apple D
the
NP
N D
the
NP
N
apple D
NP
N D
D
the N
apple
Figure 3: The complete set of tree fragments as defined by the tree kernel for the syntax tree corresponding to the apple, afterCollins and Duffy(2002).
RSAREGRESS Basic RSA measures correlation
between similarities in two different representa-tions globally, i.e. how close they are in their total-ity. In contrast, diagnostic models answer a more specific question: to what extent a particular type of information can be extracted from a given rep-resentation. For example, while for a particular neural encoding of sentences it may be possible to predict the length of the sentence with high accu-racy, the RSA between this representation and the strings represented only by their length may be rel-atively small in magnitude, since the neural repre-sentation may be encoding many other aspects of the input in addition to its length.
We introduce RSAREGRESS, a method which
shares features of both classic RSA as well as the diagnostic model approach. Like RSA it is based on two similarity functions sk and sl specific to
two different representations kand l. But rather than computing the square matrices Sk(X) and Sl(X) for a set of objectsX, we sample a
refer-ence set of objectsRto act as anchor points, and then embed the objects of interestX in the repre-sentation spacekvia the representational
similar-ity functionσkdefined as:1
σk(X, R) =V
Vi,j =sk(Xi, Rj),
(4)
Likewise for representationl, we calculateσl for
the same set of objectsX. The rows of the two re-sulting matrices contain two different views of the objects of interest, where the dimensions of each view indicate the degree of similarity for a partic-ular reference anchor point. We can now fit a mul-tivariate linear regression model to map between the two views:
d
B,a= arg min B,a
MSE(Bσk(X, R) +a, σl(X, R))
(5) wherekis the source andlis the target view, and
MSE is the mean squared error. The success of this model can be seen as an indication of how predictable representationlis from representation
k. Specifically, we use a cross-validated Pearson’s correlation between predicted and true targets for anL2-penalized model.
4 Synthetic language
Evaluation of analysis methods for neural network models is an open problem. One frequently re-sorts to largely qualitative evaluation: checking whether the conclusions reached via a particular approach have face validity and match pre-existing intuitions. However pre-existing intuitions are of-ten not reliable when it comes to complex neural models applied to also very complex natural lan-guage data. It is helpful to simplify one part of the overall system and apply the analytic technique of interest on a neural model which processes a sim-ple and well-understood synthetic language. As our first case study, we use a simple language of
1Note thatσ
Syntax Meaning
E→L E1O E2R [E] = [O]([E1],[E2])
E→D [E] = [D]
O→+ [O] =λx, y.x+ymod10
O→ − [O] =λx, y.x−ymod10
L→(
R→)
D→0 [D] = 0 ..
. ...
[image:5.595.309.528.65.232.2]D→9 [D] = 9
Table 1: GrammarG(L)of a languageL expressing addition and subtraction modulo 10 in infix notation. The notation[·]stands for the semantic evaluation func-tion. Subscripts on symbols serve to distinguish their multiple occurrence.
arithmetic expressions. Here we first describe the language and its syntax and semantics, and then introduce neural recurrent models which process these expressions.
4.1 Arithmetic expressions
Our language consists of expressions which en-code addition and subtraction modulo 10. Con-sider the example expression((6+2)-(3+7)). In order to evaluate the whole expression, each parenthesized sub-expression is evaluated modulo 10: in this case the left sub-expression evaluates to 8, the right one to 0 and the whole expression to 8. Table1gives the context-free grammar which generates this language, and the rules for seman-tic evaluation. Figure4shows the syntax tree for the example expression according to this grammar. This language lacks ambiguity, has a small vocab-ulary (14 symbols) and simple semantics, while at the same time requiring the processing of hierar-chical structure to evaluate its expressions.2
Generating expressions In order to generate expressions in L we use the recursive function GENERATE defined in Algorithm 1. The func-tion receives two input parameters: the branching probabilitypand the decay factord. In the recur-sive call to GENERATEin lines4and5the prob-ability p is divided by the decay factor. Larger values of dlead to the generation of smaller ex-pressions. Within the branching path in line6the operator is selected uniformly at random, and like-wise in the non-branching path in line9the digit is sampled uniformly.
2The grammar is more complex than strictly needed in
or-der to facilitate the computation of the Tree Kernel, which assumes each vocabulary symbol is expanded from a
pre-E
R
) E
R
) E
D
7 O
+ E
D
3 L
( O
-E
R
) E
D
2 O
+ E
D
6 L
( L
(
Figure 4: Syntax tree of the expression
((6+2)-(3+7)).
Algorithm 1Recursive function for generating an expression of languageL.
1: functionGENERATE(p,d) 2: branch∼BERNOULLI(p) 3: if branch then
4: e1←GENERATE(p/d,d)
5: e2←GENERATE(p/d,d)
6: op∼UNIFORM([+,−])
7: return[E[L( ]e1[Oop ]e2[R) ] ]
8: else
9: digit∼UNIFORM([0, . . . ,9]) 10: return[E[Ddigit ] ] 11: end if
12: end function
4.2 Neural models of arithmetic expressions
We define three recurrent models which process the arithmetic expressions from languageL. Each of them is trained to predict a different target, re-lated either to the syntax of the language or to its semantics. We use these models as a testbed for validating our analytical approaches. All these models share the same recurrent encoder architec-ture, based on LSTM (Hochreiter and Schmidhu-ber,1997).
Encoder The encoder consists of a trainable em-bedding lookup table for the input symbols, and a single-layer LSTM. The state of the hidden layer of the LSTM at the last step in the sequence is used as a representation of the input expression.
SEMANTIC EVALUATION This model consists
of the encoder as described above, which passes its representation of the input to a multi-layer per-ceptron component with a single output neuron. It is trained to predict the value of the input expres-sion, with mean squared error as the loss function. In order to perform this task we would expect that the model needs to encode the hierarchical
ture of the expression to some extent while also encoding the result of actually carrying out the op-erations of semantic evaluation.
TREE DEPTH This model is similar to SEMAN
-TIC EVALUATION but is trained to predict the depth of the syntax tree corresponding to the ex-pression instead of its value. We expect this model to need to encode a fair amount of hierarchical in-formation, but it can completely ignore the seman-tics of the language, including the identity of the digit symbols.
INFIX-TO-PREFIX This model uses the encoder
to create a representation of the input expression, which it then decodes in its prefix form. For ex-ample, the expression((6+2)-(3+7))is con-verted to (-(+62)(+37)). The decoder is an LSTM trained as a conditional language model, i.e. its initial hidden state is the output of the en-coder and its input at each step is the embedding of previous output symbol. The loss function is categorical cross-entropy. We would expect this model to encode the hierarchical structure in some form as well as the identity of the digit symbols, but it can ignore the compositional semantics of the language.
4.3 Reference representations
We use RSA to correlate the neural encoders from Section4.2with reference syntactic and semantic information about the arithmetic expressions. For the neural representations we use cosine distance as the dissimilarity metric. The reference repre-sentations and their associated dissimilarity met-rics are described below.
Semantic value This is simply the value to which each expression evaluates, also used as the target of theSEMANTIC EVALUATIONmodel. As a measure of dissimilarity we use the absolute dif-ference between values, which ranges from 0 to 9.
Tree depth This is the depth of the syntax tree for each expression, also used as the target of the
TREE DEPTH model. We use the absolute
differ-ence as the dissimilarity measure. The dissimilar-ity is minimum 0 and has no upper bound, but in our data the typical maximum value is around 7.
Tree kernel This is an estimate of similarity be-tween two syntax trees based on the number of tree fragments they share, as described in Section 3. The normalized tree kernel metric ranges between
0 and 1, which we convert to dissimilarity by sub-tracting it from 1.
The semantic value and tree depth correlates are easy to investigate with a variety of analytic meth-ods including diagnostic models; we include them in our experiments as a point of comparison. We use the tree kernel representation to evaluate struc-tured RSA for a simple synthetic language.
4.4 Experimental settings
We implement the neural models in PyTorch 1.0.0. We use the following model architecture: encoder embedding layer size 64, encoder LSTM size 128, for the regression models, MLP with 1 hidden layer of size 256; for the sequence-to-sequence model the decoder hyper-parameters are the same as the encoder. The symbols are predicted via a linear projection layer from hidden state, fol-lowed by a softmax. Training proceeds following a curriculum: we first train on 100,000 batches of size 32 of random expressions sampled with de-cay d = 2.0, followed by 200,000 batches with
d= 1.8and finally 400,000 batches withd= 1.5. We optimize with Adam with learning rate0.001. We report results on expressions sampled with
[image:6.595.327.504.436.613.2]d = 1.5. See Figure 5for the distribution of ex-pression sizes for these values ofd.
Figure 5: Distribution of expression sizes when vary-ing the value of the decay parameterd. The size of an expression is measured as the number of its digit nodes.
are reported on separate test data consisting of 2,000 expressions and 200 reference expressions for RSAREGRESSembedding.
4.5 Results
Table 2 shows the results of our experiments, where each row shows a different encoder type and each column a different target task.
Semantic value and tree depth As a first san-ity check, we would like to see whether the RSA techniques show the same pattern captured by the diagnostic models. As expected, both diagnostic and RSA scores are the highest when the objec-tive function used to train the encoder and the ana-lytical reference representations match: for exam-ple, the SEMANTIC EVALUATION encoder scores high on thesemantic valuereference, both for the diagnostic model and the RSA. Furthermore, the scores for the value and depth reference repre-sentation according to the diagnostic model and according to RSAREGRESS are in agreement. The
scores according to RSA in some cases show a dif-ferent picture. This is expected, as RSA answers a substantially different question than the other two approaches: it looks at how the whole representa-tions match in their similarity structure, whereas both the diagnostic model and RSAREGRESS focus
on the part of the representation that encodes the target information the strongest.
Tree Kernel We can use both RSA and
RSAREGRESS for exploring whether the hidden
ac-tivations encode any structural representation of syntax: this is evident in the scores yielded by the TK reference representations. As expected, the highest scores for both methods are gained when using INFIX-TO-PREFIXencodings, the task
that relies the most on the hierarchical structure of an input string. RSAREGRESSyields the
second-highest score for TREE DEPTHencodings, which
also depend on aspects of tree structure. The over-all pattern for the TK with different values of the discounting parameter λ is similar, even though the absolute values of the scores vary. What is unexpected is the results for the random encoder, which we turn to next.
Random encoders The non-random nature of the activation patterns of randomly initialized models (e.g., Zhang and Bowman, 2018) is also strongly in evidence in our results. For exam-ple the random encoder has quite a high score for
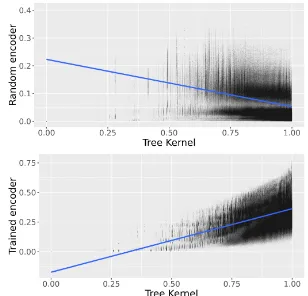
Figure 6: Scatterplot of dissimilarity values according to random encoder or trained INFIX-TO-PREFIX en-coder and the Tree Kernel (λ= 0.5)
diagnostic regression on tree depth. Even more striking is the fact that the random encoder has substantialnegative RSA score for the Tree Ker-nel: thus, expression pairs more similar according to the Tree Kernel are less similar according to the random encoder, and vice-versa.
When applying RSA we can inspect the full cor-relation pattern via a scatter-plot of the dissimilar-ities in the reference and encoder representations. Figure 6 shows the data for the random encoder and the Tree Kernel representations. As can be seen, the negative correlation for the random en-coder is due to the fact that according to the Tree Kernel, expression pairs tend to have high dissim-ilarities, while according to the random encoder’s activations they tend to have overall low dissimi-larities. For the trained INFIX-TO-PREFIXencoder the dissimilarities are clearly positively correlated with the TK dissimilarities.
Thus the raw correlation value for the trained encoder is a biased estimate of the effect of learn-ing, as learning has to overcome the initially sub-stantial negative correlation: a better estimate is the difference between scores for the learned and random model. It is worth noting that the same approach would be less informative for the diag-nostic model approach or for RSAREGRESS. For
a regression model the correlation scores will be positive, and when taking the difference between learned and random scores, they may cancel out, even though a particular information may be pre-dictable from the random activations in a com-pletely different way than from the learned acti-vations. This is what we see for the RSAREGRESS
[image:7.595.338.492.63.211.2]Diagnostic RSA RSAREGRESS
Encoder Loss Value Depth Value Depth TK(1) TK(0.5) Value Depth TK(1) TK(0.5)
RANDOM 0.01 0.80 0.01 0.23 -0.24 -0.33 -0.01 0.57 0.41 0.63
SEMANTIC EVAL. 0.07 0.97 0.70 0.62 0.05 0.02 0.01 0.97 0.55 0.38 0.61
TREEDEPTH 0.00 -0.03 1.00 0.01 0.72 0.10 -0.06 -0.03 0.97 0.49 0.87
[image:8.595.71.533.65.133.2]INFIX-TO-PREFIX 0.00 0.02 0.97 -0.00 0.64 0.35 0.53 0.02 0.88 0.58 0.96
Table 2: Scores for diagnostic regression, RSA, and RSAREGRESSwith respect to expression value, expression tree
depth and the Tree Kernel (TK) withλ= 1andλ= 0.5. All scores are Pearson’s correlation coefficients. For the diagnostic model and RSAREGRESSthey are cross-validated correlations between target and predicted values. The
randomly initialized encoder is the same for all encoder types, and thus there is only a single row for the RANDOM
encoder. The loss column shows the loss of the full model on the test data: mean squared error for SEMANTIC EVALUATIONand TREE DEPTH, and cross-entropy for INFIX-TO-PREFIX.
the scores partially cancel out, and given the pat-tern in Figure6it is clear that subtracting them is misleading. It is thus a good idea to complement the RSAREGRESSscore with the plain RSA
correla-tion score in order to obtain a full picture of how learning affects the neural representations.
Overall, these results show that RSAREGRESScan
be used to answer the same sort of questions as the diagnostic model. It has the added advantage of being also easily applicable to structured sym-bolic representations, while the RSA scores and the full RSA correlation pattern provides a com-plementary source of insight into neural represen-tations. Encouraged by these findings, we next ap-ply both RSA and RSAREGRESSto representations
of natural language sentences.
5 Natural language
Here we use our proposed RSA-based techniques to compare tree-structure representations of natu-ral language sentences with their neunatu-ral represen-tations captured by sentence embeddings. Such embeddings are often provided by NLP systems trained on unlabeled text, using variants of a lan-guage modeling objective (e.g.Peters et al.,2018), next and previous sentence prediction (Kiros et al.,
2015; Logeswaran and Lee, 2018), or discourse based objectives (Nie et al., 2017; Jernite et al.,
2017). Alternatively they can be either fully trained or fine-tuned on annotated data using a task such as natural language inference (Conneau et al.,
2017). In our experiments we use one of each type of encoders.
5.1 Encoders
Bag of words As a baseline we use a classic bag of words model where a sentence is represented by a vector of word counts. We do not exclude
any words and use raw, unweighted word counts.
Infersent This is the supervised model de-scribed inConneau et al.(2017) based on a bidi-rectional LSTM trained on natural language infer-ence. We use theinfersent2model with pre-trained fastText (Bojanowski et al., 2017) word embeddings.3 We also test a randomly initialized version of this model, including random word em-beddings.
BERT This is an unsupervised model based on the Transformer architecture (Vaswani et al.,
2017) trained on a cloze-task and next-sentence prediction (Devlin et al., 2018). We use the Pytorch version of the large 24-layer model (bert-large-uncased).4 We also test a ran-domly initialized version of this model.
5.2 Experimental settings
Data We use a sample of data from the English Web Treebank (EWT) (Bies et al., 2012) which contains a mix of English weblogs, newsgroups, email, reviews and question-answers manually an-notated for syntactic constituency structure. We use the 2,002 sentences corresponding to the de-velopment section of the EWT Universal Depen-dencies (Silveira et al.,2014), plus 200 sentences from the training section as reference sentences when fitting RSAREGRESS.
Tree Kernel Prior to computing the Tree Ker-nel scores we delexicalize the constituency trees by replacing all terminals (i.e. words) with a single placeholder valueX. This ensures that only syntac-tic structure, and not lexical overlap, contributes to kernel scores. We compute kernels for the values ofλ∈ {1,12}.
3
Available athttps://github.com/facebookresearch/InferSent.
Encoder Train λ RSA RSAREGRESS
BoW 0.5 0.18 0.50
Infersent − 0.5 0.24 0.51
BERT last − 0.5 0.12 0.49
BERT best − 0.5 0.14 0.53
Infersent + 0.5 0.30 0.71
BERT last + 0.5 0.16 0.59
BERT best + 0.5 0.32 0.70
BoW 1.0 -0.01 0.40
Infersent − 1.0 0.00 0.48
BERT last − 1.0 -0.08 0.50
BERT best − 1.0 -0.07 0.52
Infersent + 1.0 0.10 0.59
BERT last + 1.0 0.03 0.53
[image:9.595.88.279.61.222.2]BERT best + 1.0 0.18 0.60
Table 3: Correlation scores for encoders against Tree Kernel with varying λ. Scores for both RSA and RSAREGRESS are Pearson’s r. The columnTrain
indi-cates whether the encoder (including the word embed-dings) is randomly initialized (−), or trained (+). For BERT, we report scores for the topmost (last) layer and for the layer which maximizes the given score (best).
Embeddings For the BERT embeddings we use the vector associated with the first token (CLS) for a given layer. For Infersent, we use the default max-pooled representation.
Fitting When fitting RSAREGRESS we use
L2-penalized multivariate linear regression. We re-port the results for the value of the penalty= 10n, for n ∈ {−3,−2,−1,0,1,2}, with the highest
10-fold cross-validated Pearson’srbetween target and predicted similarity-embedded vectors.
5.3 Results
Table 3 shows the results of applying RSA and RSAREGRESS on five different sentence encoders,
using the Tree Kernel reference. Results are re-ported using two different values for the Tree Ker-nel parameterλ.
As can be seen, with λ = 12, all the en-coders show a substantial RSA correlation with the parse trees. The highest scores are achieved by the trained Infersent and BERT, but even Bag of Words and untrained versions of Infersent and BERT show a sizeable correlation with syntactic trees according to both RSA and RSAREGRESS.
When structure matching is strict (λ = 1), only trained BERT and Infersent capture syn-tactic information according to RSA; however, RSAREGRESS still shows moderate correlation for
BoW and the untrained versions of BERT and In-fersent. Thus RSAREGRESS is less sensitive to the
value ofλthan RSA since changing it from 12 to1
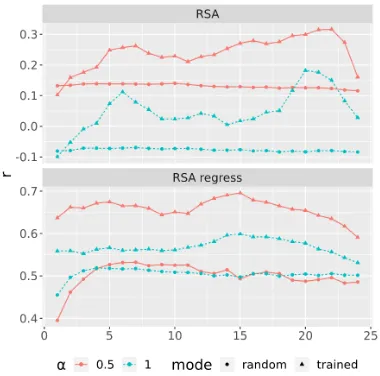
Figure 7: RSA and RSAREGRESSscores for embeddings
from all the layers of BERT vs Tree Kernel for two values ofλ. Both randomly initialized and trained ver-sions of BERT are shown. The embeddings are vectors at the first token (CLS) at each layer.
does not alter results in a qualitative sense. Figure 7 shows how RSA and RSAREGRESS
scores change when correlating Tree Kernel esti-mates with embeddings from different layers of BERT. For trained models, scores peak between layers 15–22 (depending on metric andλ) and de-cline thereafter, which indicates that the final lay-ers are increasingly dedicated to encoding aspects of sentences other than pure syntax.
6 Conclusion
We present two RSA-based methods for correlat-ing neural and syntactic representations of lan-guage, using tree kernels as a measure of sim-ilarity between syntactic trees. Our results on arithmetic expressions confirm that both versions of structured RSA capture correlations between different representation spaces, while providing complementary insights. We apply the same techniques to English sentence embeddings, and show where and to what extent each represen-tation encodes syntactic information. The pro-posed methods are general and applicable not just to constituency trees, but given a similarity met-ric, to any symbolic representation of linguis-tic structures including dependency trees or Ab-stract Meaning Representations. We plan to ex-plore these options in future work. A toolkit with the implementation of our methods is available at
[image:9.595.323.513.63.251.2]References
Yossi Adi, Einat Kermany, Yonatan Belinkov, Ofer Lavi, and Yoav Goldberg. 2017. Fine-grained anal-ysis of sentence embeddings using auxiliary predic-tion tasks. International Conference on Learning Representations (ICLR).
Afra Alishahi, Marie Barking, and Grzegorz Chrupała. 2017. Encoding of phonology in a recurrent neu-ral model of grounded speech. In Proceedings of the 21st Conference on Computational Natural Lan-guage Learning (CoNLL 2017), pages 368–378.
Sebastian Bach, Alexander Binder, Gr´egoire Mon-tavon, Frederick Klauschen, Klaus-Robert M¨uller, and Wojciech Samek. 2015. On pixel-wise explana-tions for non-linear classifier decisions by layer-wise relevance propagation. PloS one, 10(7):e0130140.
Yonatan Belinkov and James Glass. 2019. Analysis methods in neural language processing: A survey. Transactions of the Association for Computational Linguistics, 7:49–72.
Ann Bies, Justin Mott, Colin Warner, and Seth Kulick. 2012. English Web Treebank LDC2012T13. Web Download.
Piotr Bojanowski, Edouard Grave, Armand Joulin, and Tomas Mikolov. 2017. Enriching word vectors with subword information. Transactions of the Associa-tion for ComputaAssocia-tional Linguistics, 5:135–146.
Diane Bouchacourt and Marco Baroni. 2018. How agents see things: On visual representations in an emergent language game. In Proceedings of the 2018 Conference on Empirical Methods in Natu-ral Language Processing, pages 981–985, Brussels, Belgium. Association for Computational Linguis-tics.
Grzegorz Chrupała. 2019. Symbolic inductive bias for visually grounded learning of spoken language. In Proceedings of the 57th Annual Meeting of the As-sociation for Computational Linguistics (Volume 1: Long Papers).
Michael Collins and Nigel Duffy. 2002. Convolution kernels for natural language. InAdvances in neural information processing systems, pages 625–632.
Alexis Conneau, Douwe Kiela, Holger Schwenk, Lo¨ıc Barrault, and Antoine Bordes. 2017. Supervised learning of universal sentence representations from natural language inference data. InProceedings of the 2017 Conference on Empirical Methods in Nat-ural Language Processing, pages 670–680, Copen-hagen, Denmark. Association for Computational Linguistics.
Alexis Conneau, Germ´an Kruszewski, Guillaume Lample, Lo¨ıc Barrault, and Marco Baroni. 2018.
What you can cram into a single vector: Probing sentence embeddings for linguistic properties. In
Proceedings of the 56th Annual Meeting of the As-sociation for Computational Linguistics (Volume 1: Long Papers), pages 2126–2136. Association for Computational Linguistics.
Danilo Croce, Simone Filice, Giuseppe Castellucci, and Roberto Basili. 2017. Deep learning in seman-tic kernel spaces. InProceedings of the 55th Annual Meeting of the Association for Computational Lin-guistics (Volume 1: Long Papers), volume 1, pages 345–354.
Danilo Croce, Daniele Rossini, and Roberto Basili. 2018. Explaining non-linear classifier decisions within kernel-based deep architectures. In Proceed-ings of the 2018 EMNLP Workshop BlackboxNLP: Analyzing and Interpreting Neural Networks for NLP, pages 16–24. Association for Computational Linguistics.
Jacob Devlin, Ming-Wei Chang, Kenton Lee, and Kristina Toutanova. 2018. BERT: pre-training of deep bidirectional transformers for language under-standing.CoRR, abs/1810.04805.
Jeffrey L. Elman. 1990. Finding structure in time. Cognitive Science, 14(2):179–211.
Sepp Hochreiter and J¨urgen Schmidhuber. 1997. Long short-term memory. Neural computation, 9(8):1735–1780.
Dieuwke Hupkes, Sara Veldhoen, and Willem Zuidema. 2018. Visualisation and ‘diagnostic clas-sifiers’ reveal how recurrent and recursive neural networks process hierarchical structure. Journal of Artificial Intelligence Research, 61:907–926.
Yacine Jernite, Samuel R Bowman, and David Son-tag. 2017. Discourse-based objectives for fast un-supervised sentence representation learning. arXiv preprint arXiv:1705.00557.
Ryan Kiros, Yukun Zhu, Ruslan R Salakhutdinov, Richard Zemel, Raquel Urtasun, Antonio Torralba, and Sanja Fidler. 2015. Skip-thought vectors. In Advances in neural information processing systems, pages 3294–3302.
Nikolaus Kriegeskorte, Marieke Mur, and Peter A Ban-dettini. 2008. Representational similarity analysis-connecting the branches of systems neuroscience. Frontiers in systems neuroscience, 2:4.
Lajanugen Logeswaran and Honglak Lee. 2018. An efficient framework for learning sentence represen-tations. In International Conference on Learning Representations.
Allen Nie, Erin D Bennett, and Noah D Goodman. 2017. Dissent: Sentence representation learning from explicit discourse relations. arXiv preprint arXiv:1710.04334.
Denis Paperno. 2018. Limitations in learning an inter-preted language with recurrent models. In Proceed-ings of the 2018 EMNLP Workshop BlackboxNLP: Analyzing and Interpreting Neural Networks for NLP, pages 384–386. Association for Computa-tional Linguistics.
Matthew Peters, Mark Neumann, Mohit Iyyer, Matt Gardner, Christopher Clark, Kenton Lee, and Luke Zettlemoyer. 2018. Deep contextualized word repre-sentations. InProceedings of the 2018 Conference of the North American Chapter of the Association for Computational Linguistics: Human Language Technologies, Volume 1 (Long Papers), volume 1, pages 2227–2237.
Naomi Saphra and Adam Lopez. 2019. Understand-ing learnUnderstand-ing dynamics of language models with SVCCA. InProceedings of the 2019 Annual Con-ference of the North American Chapter of the As-sociation for Computational Linguistics (NAACL-HLT). Association for Computational Linguistics.
Luzi Sennhauser and Robert Berwick. 2018. Evalu-ating the ability of lstms to learn context-free gram-mars. InProceedings of the 2018 EMNLP Workshop BlackboxNLP: Analyzing and Interpreting Neural Networks for NLP, pages 115–124. Association for Computational Linguistics.
Natalia Silveira, Timothy Dozat, Marie-Catherine de Marneffe, Samuel Bowman, Miriam Connor, John Bauer, and Christopher D. Manning. 2014. A gold standard dependency corpus for English. In Proceedings of the Ninth International Conference on Language Resources and Evaluation (LREC-2014).
Natalia Skachkova, Thomas Trost, and Dietrich Klakow. 2018. Closing brackets with recurrent neu-ral networks. In Proceedings of the 2018 EMNLP Workshop BlackboxNLP: Analyzing and Interpret-ing Neural Networks for NLP, pages 232–239. As-sociation for Computational Linguistics.
Ian Tenney, Patrick Xia, Berlin Chen, Alex Wang, Adam Poliak, R Thomas McCoy, Najoung Kim, Benjamin Van Durme, Sam Bowman, Dipanjan Das, et al. 2019. What do you learn from context? prob-ing for sentence structure in contextualized word representations. InICLR 2019.
Lorraine Komisarjevsky Tyler, Teresa PL Cheung, Barry J Devereux, and Alex Clarke. 2013. Syntac-tic computations in the language network: charac-terizing dynamic network properties using represen-tational similarity analysis. Frontiers in psychology, 4:271.
Ashish Vaswani, Noam Shazeer, Niki Parmar, Jakob Uszkoreit, Llion Jones, Aidan N Gomez, Łukasz Kaiser, and Illia Polosukhin. 2017. Attention is all you need. InAdvances in Neural Information Pro-cessing Systems, pages 5998–6008.
Daniel LK Yamins and James J DiCarlo. 2016. Using goal-driven deep learning models to understand sen-sory cortex. Nature neuroscience, 19(3):356.


![Table 1: Grammar G(L) of a language L expressingaddition and subtraction modulo 10 in infix notation.The notation [·] stands for the semantic evaluation func-tion](https://thumb-us.123doks.com/thumbv2/123dok_us/176299.512885/5.595.309.528.65.232/grammar-language-expressingaddition-subtraction-notation-notation-semantic-evaluation.webp)