ISSN Online: 2164-3199 ISSN Print: 2164-3180
DOI: 10.4236/ojbd.2017.73009 Sep. 29, 2017 86 Open Journal of Blood Diseases
Using of Color Model and Contrast Variation in
Wavelet Ideology for Study
Megaloblastic
Anemia Cells
Vyacheslav V. Lyashenko
1*, Asaad MA. Babker
21Department of Informatics, Kharkiv National University of Radio Electronics, Kharkiv, Ukraine
2Medical Laboratories Science Department, College of Health Science, Gulf Medical University, Ajman, UAE
Abstract
Processing and analyzing of medical images is one of the priority research areas. At the same time, the processing of images of cells occupies a special place. This is due to the fact that such studies allow for a comprehensive di-agnosis of the state of human health, identify and prevent the development of diseases in the early stages. We investigate the effectiveness of using wavelet analysis in color models, taking into account the preliminary change in the contrast of the input image. We consider the HSV color model and the image contrast modification procedure, which is based on the histogram change in the specified range with gamma correction. As a criterion for choosing para-meters for changing the contrast of the image, we consider the entropy of the image. We also showed the advisability of using the value of the entropy index for the subsequent improvement of image analysis based on the wavelet ide-ology. We examined the general sequence of action for the analysis of image of megaloblastic anemia cells. This sequence is based on the choice of para-meters for changing the contrast of the image and application of wavelet ide-ology.
Keywords
Wavelet Analysis, Image, Contrast Enhancement, Medicine, Color Model,
Megaloblastic Anemia Cells
1. Introduction
The studying of cells (cell structure, cell functions and changes in the cell) is one of the directions in modern medicine. These studies allow:
How to cite this paper: Lyashenko, V.V. and Babker, A. MA. (2017) Using of Color Model and Contrast Variation in Wavelet Ideology for Study Megaloblastic Anemia Cells. Open Journal of Blood Diseases, 7, 86-102.
https://doi.org/10.4236/ojbd.2017.73009
Received: September 1, 2017 Accepted: September 26, 2017 Published: September 29, 2017
Copyright © 2017 by authors and Scientific Research Publishing Inc. This work is licensed under the Creative Commons Attribution International License (CC BY 4.0).
DOI: 10.4236/ojbd.2017.73009 87 Open Journal of Blood Diseases
- to do a comprehensive diagnosis of the state of human health; - identify the disease in its early stages;
- facilitate the provision of assistance in preventing the development of the disease.
Therefore, the analysis and study of cells occupies a special place in medical research.
We can explore different cells:
- blood cells—for the diagnosis of various diseases [1][2];
- cells of the gastrointestinal tract—for diagnosis and detection of tumors [3]; - mammary cells—for the diagnosis of breast cancer [4];
- cervical cells—for the diagnosis of concomitant diseases [5][6];
- and many other types of cells, which allows for more in-depth study of the human body, to study the dynamics of its operation, to diagnose possible diseases.
To study the cell using a microscope, for detailed study of cells, an image of cytological preparations is used. In this case, cytological drugs are the image of various human organs at the cell level. Consequently, the image of cytological preparations can be used to study the functional characteristics of the human body and diagnose possible diseases.
Images of cytological preparations are objects of the micro world. Images of cytological preparations are special images. Such images are characterized by a feature of visualization of objects of the micro world. Images of cytological preparations are created with the help of special methods of representing medi-cal preparations and tissue samples, blood smears. Therefore, the analysis of images of cytological preparations requires the use of various image processing methods in order to obtain information about the objects under study, processes, and phenomena.
At the same time, the complexity of processing images of cytological prepara-tions requires constant study of the methods for their analysis. An additional complication in the processing of images cytological preparations is the variabil-ity of the structure of the cell. Such variabilvariabil-ity can characterize different diag-noses. One of the examples of cell variability is the pathology of the shape and structure of red blood cells. The most complex form, from the point of view of recognition, is megaloblastic anemia cells [7]. Aspect of such processing is dis-cussed in this article.
2. Materials and Methods
2.1. Images of Cytological Preparations as an Object of Research
Currently, analysis of cell structures by means of imaging techniques is very common. Therefore, there are many studies where various image processing methods for analyzing cells.DOI: 10.4236/ojbd.2017.73009 88 Open Journal of Blood Diseases [10], examine the possibility of applying different methods of analyzing in the study images of cytological preparations. The following are considered as the main ones: preliminary processing, the purpose of which is to improve the qual-ity of perception and the subsequent processing of the original image; threshold segmentation, which allows isolating the cell nucleus.
M. Hrebień, P. Steć, T. Nieczkowski and A. Obuchowicz also focus on image pre-processing for image analysis of cytological preparations [11]. At the same time, emphasis is placed on the fact that such processing is important for any methods of image segmentation. For this, for example, images can be enhanced with histogram stretching and contrast-limited adaptive histogram equalization [12].
Thus, among methods of preliminary image processing of cytological prepa-rations, it is necessary to distinguish methods of contrast variation, which allow increasing the accuracy of the analysis [13] [14]. This cannot only locate the boundaries between objects and background with high accuracy, but also obtain a complete edge and eliminate noise [15].
At the same time, as noted E. Ensink, J. Sinha, A. Sinha, H. Tang, H. M. Cal-derone, G. Hostetter, J. Winter, D. Cherba, R. E. Brand, P. J. AllenL. F. Sempere and B. B. Haab, the selection of threshold for segmentation depends to a large extend on the baseline characteristics of the original images [16]. In this context, it should be borne in mind that images of cytological preparations may have a different intensity of staining of the clinical specimens studied. Therefore for the analysis of images of cytological preparations it is necessary to use a certain color model. Possible errors in segmentation of cells on cytology preparations images as a result of the arising differences in relative intensity of their staining, например, is studied by E. M. van Ingen, L. Leyte-Veldstra, I. Al, G. Wielenga and I. S. Ploem [17], R. Malviya, S. P. K. Karri, J. Chatterjee, M. Manjunatha and A. K. Ray [18], N. Dey, A. S. Ashour, A. S. Ashour and A. Singh [14].
Thus, the application of the procedure for changing the contrast of the image and the choice of the color model for image analysis of images cytological prep-arations must be combined. An important point is also the choice of a method for analyzing images of cytological preparations. Recently, among methods of analyzing medical images, wavelet ideology has wide application [19][20][21].
2.2. Wavelet Ideology as a Tool for Analysis
DOI: 10.4236/ojbd.2017.73009 89 Open Journal of Blood Diseases Ideology of wavelet analysis allows taking into consideration the particular characteristics of the images under study by decomposing source data in a plu-rality of approximate and detailed coefficients. For this purpose, we use the wavelet transform—this is an image decomposition by the system of wavelets where the wavelets are obtained by shifting and scaling a single function—parent wavelet [23]. This decomposition is done according to the rows and columns of the original image. We obtain the matrix of horizontal and vertical discontinui-ties of the original image. To do this, there’s the use of two continuous and integral along the whole axis functions [23][24]:
- wavelet-function φ
( )
t with zero integral value( )
t td 0φ
∞
−∞
=
∫
(1)determining the details of the signal and generating extended fractions; - scaling function φ
( )
t with a unit value of integral( )
t td 1φ
∞
−∞
=
∫
(2)determining a rough approximation of signal and generating approximation coefficients.
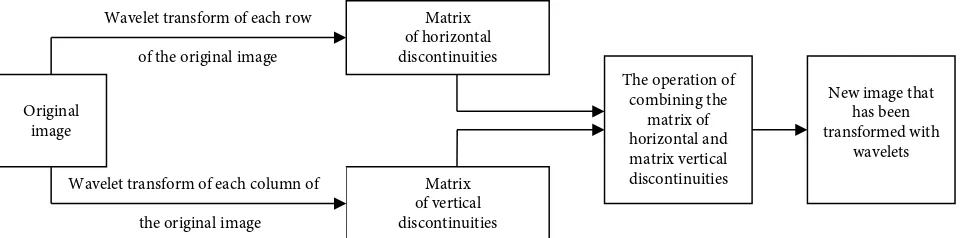
Then we combine the matrix of horizontal and matrix vertical discontinuities of the original image. So we get a new image that has been transformed with wavelets. The general scheme of the wavelet transformation is shown in Figure 1. For more details on the wavelet ideology for transforming images of cytologi-cal preparations, see [19][20][22].
To ensure the reliability of the detection of discontinuities, it is necessary to carry out the procedure of enhancing the contrast of the image. This is one of the conditions for improving the quality of image processing of cytological preparations [13][14].
2.3. Changing the Contrast as an Element of Improving Image
Analysis Quality
[image:4.595.61.541.583.702.2]Contrast is one of the characteristics of an image. Contrast value related to the
Figure 1. Sequence of application of the wavelet ideology to transform the original image.
Matrix of vertical discontinuities Wavelet transform of each row
of the original image
Wavelet transform of each column of
the original image Original
image
The operation of combining the
matrix of horizontal and matrix vertical discontinuities
New image that has been transformed with
wavelets Matrix
DOI: 10.4236/ojbd.2017.73009 90 Open Journal of Blood Diseases brightness of pixels that are the sources of information about the objects in the image. The balance of contrast affects the quality of perception and analysis of the image. Therefore, the contrast change procedure is designed to improve the initial image quality, improve the efficiency of the source image analysis. By in-creasing the contrast of the image (pixels-individual image points) highlights become lighter and dark image regions become darker. When reducing image contrast, on the contrary, there is an expansion of the average gray-level range. Dark pixels become lighter, and light pixels become darker and partially trans-form into the midtones. Changing the image contrast makes some details of the image clearer.
The following methods can be used to change the contrast of the image [14] [25]:
- histogram equalization of brightness values (luminance), - non-linear stretching of dynamic range of brightness values, - masks filtering,
- fuzzy masking,
- histogram change in the specified range with gamma correction.
We will use the method—histogram change in the specified range with gam-ma correction. This choice is justified:
- possibility of adjusting the level of contrast changes (based on the histogram change in the specified range),
- possibility of setting a linear or non-linear histogram change.
Conversion of the image contrast using the histogram change in the specified range with gamma correction is shown in Figure 2 [25], where γ—parameter
for gamma correction; gv gv1, 2—changing values of the input image histo-gram; gk gk1, 2—changing values of the output image histograms.
If γ is less than 1, the output image is brighter than the input image. If γ is
greater than 1, the output image is darker than the input image.
[image:5.595.141.538.572.707.2]We can also argue that the main task of changing the contrast for the applica-tion of wavelet analysis is to increase the values in discontinuity points. It is this fact that makes it possible to isolate the finer details in the image. Then we can say that the entropy value for the output image will be different from the entropy value for the input image.
Figure 2. Characteristics of transmission of image brightness levels for various gamma correction parameters.
gk
1
gk
2
output
input
gv1 gv2
gk
1
gk
2
output
input gk1
gk
2
output
input
γ<1 γ=1 γ>1
DOI: 10.4236/ojbd.2017.73009 91 Open Journal of Blood Diseases As a rule, the absolute value of the entropy will increase, since we increase the values in the discontinuity points. First of all, this increase relates to the se-quence of images for which we apply a contrasting procedure (the value of en-tropy will increase depending on the increase in contrast). This growth is not permanent. When we increase the contrast, we change the brightness values of the image pixels. At the same time, we can lose some brightness values of the image pixels. Some values of the brightness of the image pixels can be merged with other values of the brightness of the image pixels. Then the absolute value of entropy (for the new output image) will decrease. Therefore, we may lose some details of the original image. Thus, such a transition can be selected as the threshold to determine the value of gamma correction (γ).
The entropy of the image is calculated using the formula (taking into account the color channels of the image) [25]:
( )
1 log
N
i i
i
ENT p p
=
= −
∑
(3) where( )
pi —is the value of the histogram counts for the level i brightness forthe image that is being analyzed (i=1,N).
2.4. Color System HSV for Image Analysis
Color system HSV is one of the priority systems for processing medical images. This is confirmed by the existence of a number of articles [26] [27] [28] [29] [30]. At the same time the HSV color system is preferable in implementing the contrast change procedure. This is due to the fact that when working in the HSV system, the number of operations is reduced, for example, in comparison with the RGB color system. At the same time the HSV color system in comparison with the RGB color system, gives a better result when contrast changes [31].
Some studies also note that the RGB color system is the least preferred [26]. However, the RGB color system is the basis for conversion to other color sys-tems [25][32].
The image in RGB color system consists of three color channels—R (red), G (green) and B (blue) [25]. The image in HSV color system consists of three channels—H (hue), S (saturation), V (volume or brightness) [25]. System HSV is a non-linear transformation of the RGB system. The relationship between RGB and HSV is implemented as follows [32]:
0, if ,
60 , if , ,
60 360, if , ,
60 120, if ,
60 240, if ,
MAX MIN
G B MAX R G B
MAX MIN G B
H MAX R G B
MAX MIN
B R MAX G
MAX MIN
R G MAX B
MAX MIN = − × = ≥ − −
= × + = <
DOI: 10.4236/ojbd.2017.73009 92 Open Journal of Blood Diseases
0, if 0,
1 , if 0,
MAX
S MIN
MAX MAX
=
=
− >
(5)
V MAX= (6)
where
(
)
max , , ,
MAX = R G B (7)
(
)
min , , ,
MIN= R G B (8)
R, G, B—the corresponding channel values in the system RGB,
H, S, V—the corresponding channel values in the system HSV.
Then, to change the contrast, it is necessary to carry out the procedure for channel V in the model HSV.
2.5. Data for Analysis and the Main Objective of the Study
For the study, we look at various images (Figure 3). These images are analyzed in our other articles and give an opportunity to make a comparative analysis [13] [19] [20] [31]. All images are different from each other. All images are in the RGB color model. It can be seen from the histograms, which are shown in Fig-ure 4 (respectively, for each image in Figure 3).
In each image (Figure 3) one can see megaloblastic anemia cells—this is one of the varieties of pernicious anemia. A characteristic feature of megaloblastic anemia is the emergence of very large erythrocytes. We also see the complex structure of megaloblastic anemia cells.
[image:7.595.156.534.477.707.2]At the same time, megaloblastic anemia cells structure characterized by a large number of segments in the nucleus (hypersegmented neutrophil). In this normal
DOI: 10.4236/ojbd.2017.73009 93 Open Journal of Blood Diseases (a) (b)
[image:8.595.59.538.64.466.2]
(c) (d)
Figure 4. Image histograms for Figure 3.
neutrophils only contain three or four nuclear lobes (segments). Therefore it is important to know the internal structure of megaloblastic anemia cells. This can be done by highlighting all internal lines for megaloblastic anemia cells. We can do this with wavelet analysis. But this requires a procedure to change the con-trast of the input image. Concon-trast change procedure (see above—Changing the contrast as an element of improving image analysis quality) requires speci-fying gamma correction parameter (γ ).
Thus, the main task of the study is to justify the approach for obtaining the gamma correction parameter (γ ) in order to change the image contrast for ap-plying wavelet analysis to the original image.
3. Results and Discussion
differ-DOI: 10.4236/ojbd.2017.73009 94 Open Journal of Blood Diseases ent values of the gamma correction index (γ ). At the same time we are
produc-ing image contrast correction procedure in the HSV color model for Channel V. The general scheme of such a sequence of actions is shown in Figure 5.
In Figures 6-9 shows the changes in the entropy index (ENT) for different values of the gamma correction index (Figure 6 for Figure 3(a), Figure 7 for Figure 3(b), Figure 8 for Figure 3(c), Figure 9 for Figure 3(d)). To build such dependencies, we proceeded from the fact that:
- changing values of the input image histogram (gv gv1, 2)—corresponds to the real range of changes,
- changing values of the output image histograms (gk gk1, 2)—corresponds to the full range of possible brightness,
Figure 5. The procedure for calculating the entropy index.
Figure 6. Change in the value of the entropy index for the image in Figure 3(a).
Original image in the color model RGB
Image in the color model
H
S
V
Changing image contrast at a given value of the gamma
correction
γ
Calculation of the entropy index for an image in the HSV color model
Result: series of values of
the entropy index for different values
of the gamma correction indicator -0.11 -0.09 -0.07 -0.05 -0.03 -0.01 0.01
0 1 2 3 4 5 6
gamma correction index - X axis
cha nge e nt ropy i nde x 0 1 2 3 4 5 6 7 ent ropy i nde x
change entropy index entropy index
DOI: 10.4236/ojbd.2017.73009 95 Open Journal of Blood Diseases
Figure 7. Change in the value of the entropy index for the image in Figure 3(b).
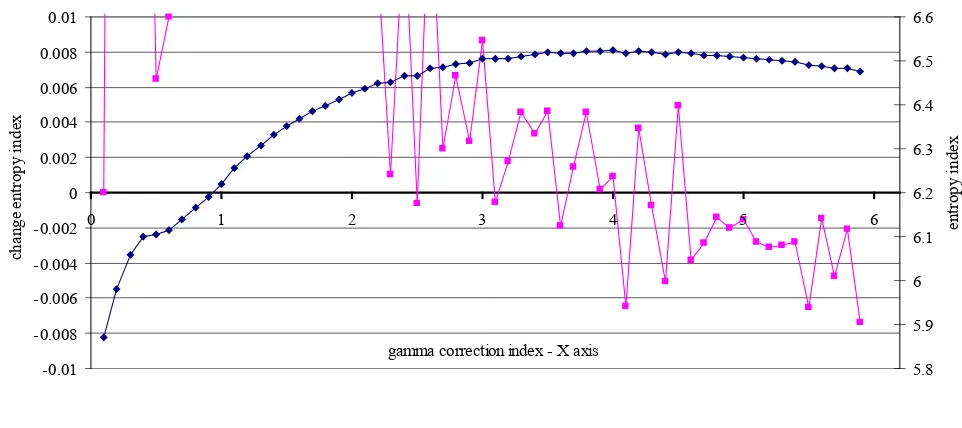
Figure 8. Change in the value of the entropy index for the image in Figure 3(c).
- the value of the gamma correction index varies from 0.1 to 5.8 in 0.1 incre-ments. This range allows you to evaluate the effect of gamma correction in the index value of entropy.
We see that the value of the entropy indicator (in the figures this is the line— entropy index) increases with increasing gamma correction (γ). But also we see (in the figures this is the line—change entropy index) that the value of the en-tropy index increases unevenly. Moreover, for individual values γ, the value of the entropy index decreases. Lines (change entropy index) in Figures 6-9 are shown in such a way as to see a decrease in the values of the entropy index (these values are less than 0).
-0.05 -0.04 -0.03 -0.02 -0.01 0 0.01
0 1 2 3 4 5 6
gamma correction index - X axis
cha nge e nt ropy i nde x 0 1 2 3 4 5 6 7 8 ent ropy i nde x
change entropy index entropy index
en tro py in de x ch an ge en tro py in de x -0.01 -0.008 -0.006 -0.004 -0.002 0 0.002 0.004 0.006 0.008 0.01
0 1 2 3 4 5 6
gamma correction index - X axis
cha nge e nt ropy i nde x 5.8 5.9 6 6.1 6.2 6.3 6.4 6.5 6.6 ent ropy i nde x
change entropy index entropy index
[image:10.595.57.538.310.524.2]DOI: 10.4236/ojbd.2017.73009 96 Open Journal of Blood Diseases
Figure 9. Change in the value of the entropy index for the image in Figure 3(d).
For the image in Figure 3(a), a decrease in the entropy index, for example, is typical for such values γ as 1.3; 1.7; 1.9 and so on (see Figure 6). For the image
in Figure 3(b), a decrease in the entropy index, for example, is typical for such values γ as 2; 3; 3.6 and so on (see Figure 7). For the image in Figure 3(c), a
decrease in the entropy index, for example, is typical for such values γ as 2.5; 3.1 and so on (see Figure 8). For the image in Figure 3(d), a decrease in the en-tropy index, for example, is typical for such values γ as 1.8; 2.3; 3.3 and so on (see Figure 9).
Thus, it is important for us to carry out wavelet analysis for such critical val-ues of gamma correction. Critical valval-ues of gamma correction are valval-ues γ that
precede a decrease in the value of the entropy index. In doing so, we will analyze the structure of megaloblastic anemia Cells, which was isolated using wavelet analysis. We will carry out this analysis in a comparative aspect for different values of the gamma correction index. To perform wavelet analysis, we use the wavelet db1. According to our research, db1 wavelet gives good results in image processing, which are made with a microscope [19][20]. In Figure 10 shows the results of applying wavelet analysis with different values of gamma correction in contrast variation for the image in Figure 3(a). In Figure 11 shows the results of applying wavelet analysis with different values of gamma correction in contrast variation for the image in Figure 3(b). In Figure 12 shows the results of apply-ing wavelet analysis with different values of gamma correction in contrast varia-tion for the image in Figure 3(c). Figure 13 shows the results of applying wave-let analysis with different values of gamma correction in contrast variation for the image in Figure 3(d) (*—critical values of gamma correction. These values correspond to the data shown in Figures 6-9. Figures 10-13 shows the result for these values.).
The analysis of Figures 10-13 shows that
-0.025 -0.02 -0.015 -0.01 -0.005 0 0.005 0.01
0 1 2 3 4 5 6
gamma correction index - X axis
cha
nge
e
nt
ropy i
nde
x
6.2 6.4 6.6 6.8 7 7.2 7.4 7.6
ent
ropy i
nde
x
change entropy index entropy index
en
tro
py
in
de
x
ch
an
ge
en
tro
py
in
de
DOI: 10.4236/ojbd.2017.73009 97 Open Journal of Blood Diseases (a) (b)
[image:12.595.150.541.60.358.2](c) (d)
Figure 10. Results of wavelet analysis for the image Figure 3(a). (a) γ = 0.6, ENT = 6.09; (b) γ = 1.2, ENT
= 6.42*; (c) γ = 2.4, ENT = 6.59*; (d) γ = 5.8, ENT = 6.35.
(a) (b)
(c) (d)
Figure 11. Results of wavelet analysis for the image Figure 3(b). (a) γ = 0.8, ENT = 6.30; (b) γ = 1.9, ENT
[image:12.595.150.541.402.687.2]DOI: 10.4236/ojbd.2017.73009 98 Open Journal of Blood Diseases (a) (b)
[image:13.595.101.541.59.345.2](c) (d)
Figure 12. Results of wavelet analysis for the image Figure 3(c). (a) γ = 0.9, ENT = 6.19; (b) γ = 2.4, ENT = 6.47*; (c)
γ = 3.5, ENT = 6.52*; (d) γ = 5.8, ENT = 6.48.
(a) (b)
(c) (d)
Figure 13. Results of wavelet analysis for the image Figure 3(d). (a) γ = 0.7, ENT = 7.07; (b) γ = 1.7, ENT = 7.31*; (c)
[image:13.595.113.541.379.694.2]DOI: 10.4236/ojbd.2017.73009 99 Open Journal of Blood Diseases
- the results of wavelet analysis are the best for critical values of gamma correc-tion, compared to other gamma correction values that were used to change the image contrast;
- wavelet analysis results are best for gamma correction values that have large entropy values.
At the same time it should be noted—the contrast change is an important procedure for image analysis. By changing the contrast, you can more precisely select objects in the image. But this is a very difficult task for medical imaging. This is due to the uneven distribution of color and brightness on medical images [14]. It is therefore important to choose the correct image contrast modification procedure.
Typically, to change the contrast of the image analyzes the histogram of local areas of an input image [33][34][35]. This gives a good result. Such an analysis is carried out for the gray-level images. Then the problem arises of choosing a color model for analyzing the image and converting the color image into a gray-level image.
We are considering a comprehensive approach for analyzing color im-ages—changing the image contrast, applying wavelet analysis. This approach pro-vides ease of implementation and quality results. Selecting the color system HSV (to change the contrast of the image) allows you to reduce computational costs.
4. Conclusions
Analyzing of medical images allows for more in-depth studies of the human body, to study the dynamics of its operation and to diagnose possible diseases in the early stages of their development. Therefore, the search for new methods of analysis of medical images is an important task.
We consider the image of megaloblastic anemia cells. For the analysis of the image, we use wavelet ideology. This ideology requires the use of image contrast modification procedure. We consider the HSV color model and the image con-trast modification procedure, which is based on the histogram change in the specified range with gamma correction.
As a threshold for selecting a gamma correction parameter for changing con-trast of the image, we use a value of an indicator of entropy. We showed the pos-sibility of using the value of the entropy index to select the threshold for chang-ing the contrast of the image. We showed the advisability of uschang-ing the value of the entropy index for the subsequent improvement of image analysis based on the wavelet ideology.
The general sequence of megaloblastic anemia cells image processing can be represented as follows:
- the input image is converted into the HSV format;
- channel V is selected; the contrast of the input image is changed for different values of gamma correction index;
DOI: 10.4236/ojbd.2017.73009 100 Open Journal of Blood Diseases
- the values of gamma correction index are selected for which the correspond-ing value of the image entropy index is the largest;
- wavelet analysis for the image with the selected value of the gamma correc-tion index and value of the entropy index is performed.
The proposed procedure provides ease of implementation and quality results.
References
[1] Da Costa, L., Suner, L., Galimand, J., et al. (2016) Diagnostic Tool for Red Blood Cell Membrane Disorders: Assessment of a New Generation Ektacytometer. Blood Cells, Molecules, and Diseases, 56, 9-22. https://doi.org/10.1016/j.bcmd.2015.09.001 [2] Koo, K.C., Lee, K.S., Choi, A.R., Rha, K.H., Hong, S.J. and Chung, B.H. (2016)
Di-agnostic Impact of Dysmorphic Red Blood Cells on Evaluating Microscopic Hema-turia: The Urologist’s Perspective. International Urology and Nephrology, 48, 1021-1027. https://doi.org/10.1007/s11255-016-1265-4
[3] Hoda, R.S., VandenBussche, C. and Hoda, S.A. (2017) Gastrointestinal Tract Cy-tology. In: Diagnostic Liquid-Based Cytology (pp. 75-90). Springer, Berlin, Heidel-berg. https://doi.org/10.1007/978-3-662-53905-7_4
[4] Acs, B., Szekely, N., Szasz, et al. (2016) Reliability of Immunocytochemistry and Fluorescence in Situ Hybridization on Fine-Needle Aspiration Cytology Samples of Breast Cancers: A Comparative Study. Diagnostic Cytopathology, 44, 466-471.
https://doi.org/10.1002/dc.23463
[5] Silver, M.I., Schiffman, M., Fetterman, et al. (2016) The Population Impact of Hu-man Papillomavirus/Cytology Cervical Cotesting at 3-Year Intervals: Reduced Cer-vical Cancer Risk and Decreased Yield of Precancer Per Screen. Cancer, 122, 3682-3686. https://doi.org/10.1002/cncr.30277
[6] Zambrano, H., Waggoner, J., León, K., et al. (2017) High Incidence of Zika Virus Infection Detected in Plasma and Cervical Cytology Specimens from Pregnant Women in Guayaquil, Ecuador. American Journal of Reproductive Immunology, 77, e12630. https://doi.org/10.1111/aji.12630
[7] Chen, H.M., Tsao, Y.T. and Tsai, S.C. (2016) Automatic Image Segmentation Scheme for Counting the Blood Cell Nuclei with Megaloblastic Anemia. Journal of Medical Imaging and Health Informatics, 6, 102-107.
https://doi.org/10.1166/jmihi.2016.1592
[8] Singh, S. and Gupta, R. (2012) Identification of Components of Fibroadenoma in Cytology Preparations Using Texture Analysis: A Morphometric Study. Cytopa-thology, 23, 187-191. https://doi.org/10.1111/j.1365-2303.2011.00854.x
[9] Mahendran, G., Babu, R. and Sivakumar, D. (2014) Automatic Segmentation and Classification of Pap Smear Cells. International Journal of Management, IT and En-gineering, 4, 100-108.
[10] Saha, M., Agarwal, S., Arun, I., Ahmed, R., Chatterjee, S., Mitra, P. and Chakrabor-ty, C. (2015) Histogram Based Thresholding for Automated Nucleus Segmentation Using Breast Imprint Cytology. In: Advancements of Medical Electronics, Springer, India, New Delhi, 49-57. https://doi.org/10.1007/978-81-322-2256-9_5
[11] Hrebień, M., Steć, P., Nieczkowski, T. and Obuchowicz, A. (2008) Segmentation of Breast Cancer Fine Needle Biopsy Cytological Images. International Journal of Ap-plied Mathematics and Computer Science, 18, 159-170.
https://doi.org/10.2478/v10006-008-0015-x
DOI: 10.4236/ojbd.2017.73009 101 Open Journal of Blood Diseases Cell Nuclei Segmentation for Breast Fine Needle Aspiration Cytology. Signal Processing, 93, 2804-2816.
[13] Lyashenko, V., Matarneh, R. and Kobylin, O. (2016) Contrast Modification as a Tool to Study the Structure of Blood Components. Journal of Environmental Science, Computer Science and Engineering & Technology, 5, 150-160.
[14] Dey, N., Ashour, A.S., Ashour, A.S. and Singh, A. (2015) Digital Analysis of Micro-scopic Images in Medicine. Journal of Advanced Microscopy Research, 10, 1-13.
https://doi.org/10.1166/jamr.2015.1229
[15] Zhou, S.B., Shen, A.Q. and Li, G.F. (2015) Concrete Image Segmentation Based on Multiscale Mathematic Morphology Operators and Otsu Method. Advances in Ma-terials Science and Engineering, 2015, 1-11. https://doi.org/10.1155/2015/208473
[16] Ensink, E., Sinha, J., Sinha, A., Tang, H., Calderone, H.M., Hostetter, G., Winter, J., Cherba, D., Brand, R.E., Allen, P.J., Sempere, L.F. and Haab B.B. (2015) Segment and Fit Thresholding: A New Method for Image Analysis Applied to Microarray and Immunofluorescence Data. Analytical Chemistry, 87, 9715-9721.
https://doi.org/10.1021/acs.analchem.5b03159
[17] Van Ingen, E.M., Leyte-Veldstra, L., Al, I., Wielenga, G. and Ploem, I.S. (1978) Au-tomated Cytology using a Quantitative Staining Method Combined with a TV-Based Image Analysis Computer. Cancer Control: Proceedings of the 12th In-ternational Cancer Congress, Buenos Aires, 201.
[18] Malviya, R., Karri, S.P.K., Chatterjee, J., Manjunatha, M. and Ray, A.K. (2012) Computer Assisted Cervical Cytological Nucleus Localization. TENCON 2012 IEEE Region 10 Conference, 1-5. https://doi.org/10.1109/TENCON.2012.6412344
[19] Lyashenko, V.V., Babker, A.M.A.A. and Kobylin, O.A. (2016) Using the Methodol-ogy of Wavelet Analysis for Processing Images of CytolMethodol-ogy Preparations. National Journal of Medical Research, 6, 98-102.
[20] Lyashenko, V.V., Babker, A.M.A.A.andKobylin, O.A. (2016) The Methodology of Wavelet Analysis as a Tool for Cytology Preparations Image Processing. Cukurova Medical Journal, 41, 453-463. https://doi.org/10.17826/cukmedj.237468
[21] Wang, P., Hu, X., Li, Y., Liu, Q. and Zhu, X. (2016) Automatic Cell Nuclei Segmen-tation and Classification of Breast Cancer Histopathology Images. Signal Processing, 122, 1-13.
[22] Kobylin, O. and Lyashenko, V. (2014) Comparison of Standard Image Edge Detec-tion Techniques and of Method Based on Wavelet Transform. International Journal of Advanced Research, 2, 572-580.
[23] Kingsbury, N. (1999) Image Processing with Complex Wavelets. Philosophical Transactions of the Royal Society of London A: Mathematical, Physical and Engi-neering Sciences,357, 2543-2560. https://doi.org/10.1098/rsta.1999.0447
[24] Heil, C.E. and Walnut, D.F. (1989) Continuous and Discrete Wavelet Transforms.
SIAM Review, 31, 628-666. https://doi.org/10.1137/1031129
[25] Semmlow, J.L. and Griffel, B. (2014) Biosignal and Medical Image Processing. CRC Press, New York, 630 p.
[26] Shaik, K.B., Ganesan, P., Kalist, V., Sathish, B.S. and Jenitha, J.M.M. (2015) Com-parative Study of Skin Color Detection and Segmentation in HSV and YCbCr Color Space. Procedia Computer Science, 57, 41-48.
[27] Mythili, C. and Kavitha, V. (2012) Color Image Segmentation using ERKFCM. In-ternational Journal of Computer Applications, 41, 21-28.
DOI: 10.4236/ojbd.2017.73009 102 Open Journal of Blood Diseases [28] Mohanty, A., Rajkumar, S., Mir, Z.M. and Bardhan, P. (2013) Analysis of Color
Images using Cluster Based Segmentation Techniques. International Journal of Computer Applications, 79, 42-47. https://doi.org/10.5120/13716-1487
[29] Bora, D.J., Gupta, A.K. and Khan, F.A. (2015) Comparing the Performance of LAB and HSV Color Spaces with Respect to Color Image Segmentation.
[30] Das, S., Garg, S. and Sahoo, G. (2012) Comparison of Content Based Image Retriev-al Systems using Wavelet and Curvelet Transform. The International Journal of Multimedia & Its Applications, 4, 137-154. https://doi.org/10.5121/ijma.2012.4412
[31] Lyashenko, V., Babker, A. and Lyubchenko, V. (2017) Wavelet Analysis of Cytolog-ical Preparations Image in Different Color Systems. Open Access Library Journal, 4, 1-9.
[32] Chen, W., Shi, Y.Q. and Xuan, G. (2007) Identifying Computer Graphics using HSV Color Model and Statistical Moments of Characteristic Functions. International Conference on Multimedia and Expo, 1123-1126.
https://doi.org/10.1109/ICME.2007.4284852
[33] Jafar, I. and Ying, H. (2007) A New Method for Image Contrast Enhancement Based on Automatic Specification of Local Histograms. International Journal of Computer Science and Network Security, 7, 1-10.
[34] Chen, S.D. and Ramli, A.R. (2003) Contrast Enhancement using Recursive Mean-Separate Histogram Equalization for Scalable Brightness Preservation. IEEE Transactions on Consumer Electronics, 49, 1301-1309.
https://doi.org/10.1109/TCE.2003.1261233
[35] Hashemi, S., Kiani, S., Noroozi, N. and Moghaddam, M.E. (2010) An Image Con-trast Enhancement Method Based on Genetic Algorithm. Pattern Recognition Let-ters, 31, 1816-1824.
Submit or recommend next manuscript to SCIRP and we will provide best service for you:
Accepting pre-submission inquiries through Email, Facebook, LinkedIn, Twitter, etc. A wide selection of journals (inclusive of 9 subjects, more than 200 journals)
Providing 24-hour high-quality service User-friendly online submission system Fair and swift peer-review system
Efficient typesetting and proofreading procedure
Display of the result of downloads and visits, as well as the number of cited articles Maximum dissemination of your research work
Submit your manuscript at: http://papersubmission.scirp.org/