J. Range
Manage.
57: 97 -105
January 2004
Revegetating weed - infested rangeland with niche -
differentiated desirable species
M.F. CARPINELLI, R.L. SHELEY, AND B.D. MAXWELL
Authors are former graduate Research Assistant and Associate Professor, Department of Land Resources and Environmental Sciences, Montana State University, Bozeman, Mont. 59717.
Abstract
The goal of this study was to determine the potential to revege-
tate weed
-
infested rangeland by maximizing niche occupation
and resource capture by desirable species. We hypothesized that
as desirable species richness increases, weed establishment and
growth decrease, provided that the desirable species differ in
niche. Three desirable species with differing spatial and temporal
growth patterns, [Agropyron cristatum (L.) Gaertn., var. Hycrest
(crested wheatgrass), Elytrigia intermedia (Host) Nevski, var.
Rush (intermediate wheatgrass), and Medicago sativa L., var.
Arrow (alfalfa)], and
1weed [Centaurea maculosa Lam. (spotted
knapweed)], were grown in a multiple replacement series. All
species were sown simultaneously in spring 1996, simulating
revegetation of a site containing spotted knapweed seeds in the
seed bank because of prior infestation. Desirable species richness varied among plots, while the total number of desirable seeds sown per plot was held constant. Although the desirable species
were shown to differ in niche, desirable species richness or mix-
ture did not affect soil water depletion or spotted knapweed recruitment in 1996 or 1997. These results suggest that revegeta- tion of weed
-infested rangeland must also include active control
of weeds emerging from the soil seed bank. Only then can other
strategies, such as maximizing niche occupation by desirable
species, be expected to provide long -term success.
Key Words: Diversity, species richness, niche occupation, inva-
sion, growth analysis, spotted knapweed, intermediate wheat
-grass, crested wheatgrass, alfalfa
Revegetation of weed
- infested rangeland has often failed
because of poor establishment of desirable species or because
weeds soon reinvade. Cost - effective, sustainable revegetation of
weed
- infested rangeland must address both successful establish-
ment of desirable species and their ability to resist reestablish-
ment of weed populations. Past revegetation of weed - dominated
rangeland that has focused on using broadleaf herbicides to estab-
lish grass monocultures has produced variable and unpredictable
results (Hubbard 1975, Berube and Myers 1982, Huston et al.
1984, Larson and McInnis 1989). The goal of establishing persis-
tent, biologically diverse plant communities has often been sacri-
ficed to accommodate the short -term goals of plant establishment
and soil stabilization (Call and Roundy 1991). Revegetation tech-
nology should address spatial and temporal diversity within the
community.
Correspondence should be sent to M.F. Carpinelli, michael.carpinelli@oregon- state.edu,
541 -573 -8911, FAX
541-573 -3042.
Manuscript acceptned 25 Sept. 02.
Resumen
El objetivo de esta investigación fue determinar el potencial de repoblar pradera infectada con maleza al maximizar la ocu- pación de nichos y la captación de recursos por especies
deseables. Nuestra hipótesis fue que mientras el número de las
especies deseables aumenta, el establecimiento y crecimiento de
especies no deseables disminuyen con tal de que las especies deseables ocupan diferentes nichos. Tres especies deseables con
diferentes patrones de crecimiento, tanto espacial como tempo- ral, [Agropyron cristatum (L.) Gaertn., var. Hycrest (crested
wheatgrass), Elytrigia intermedia (Host) Nevski, var. Rush (inter- mediate wheatgrass), y Medicago sativa L., Arrow (alfalfa)] y
1especie no deseable [Centaurea maculosa Lam. ( spotted knap-
weed)] fueron cultivados en una serie múltiple de reemplazo.
Todas las especies fueron sembradas simultáneamente en la pri- mavera de 1996, simulando la recuperación de vegetación de un
sitio el cual contenía semillas de spotted knapweed en el banco de
semillas causa de una invasión previa. La riqueza de la especie
deseable varió entre parcelas experimentales, mientras el número total de semillas deseables sembradas por parcela se
mantuvo constante. Aunque las especies deseables se manifes- taron en diferentes nichos, la riqueza o mezcla de especies
deseables no registró una reducción de agua del subsuelo ni
establecimiento de spotted knapweed durante 1996 o 1997. Estos
resultados sugieren que la recuperación de vegetación de pradera invadida por maleza también debe incluir un control activo de maleza saliendo del banco de semillas del subsuelo.
Solo entonces se puede esperar que otras estrategias, tales como
la ocupación de nichos por especies deseables, representen un éxito a largo plazo.
During the establishment phase of revegetation, the relative
timing of emergence and growth rates of species may be impor-
tant determinants of community dynamics (Ross and Harper
1972, Harper 1977, Radosevich and Holt 1984). Rehabilitation of
yellow starthistle (Centaurea solstitialis L.)- dominated rangeland
has been attempted by revegetating with desirable grasses. These
attempts typically fail because of resource preemption by annual
weeds which germinate sooner and have a higher initial growth
rate than the desirable grasses (Borman et al. 1991). In an experi-
ment by Harris (1967), the winter annual, cheatgrass (Bromus tectorum L.), preempted resources from fall -sown bluebunch
wheatgrass [Agropyron spicatum (Pursh) Scribn. & Smith]. Both
species germinated in the fall, but cheatgrass had faster winter
root growth than bluebunch wheatgrass, thus allowing it to gain
control of the site. Borman et al. (1991) found that established perennial grasses that initiate growth early and maintain some
JOURNAL OF RANGE MANAGEMENT 57(1) January 2004 97
growth through the winter can limit rein - vasion by weeds.
During the early stages of secondary succession (e.g., revegetation), availability of light, water, and nutrients may be par- ticularly high relative to the demand by a sparse community of establishing plants.
In this case, resource preemption may be more important than competition in deter- mining community dynamics (Goldberg 1990). Those plants with the highest growth rates have the highest likelihood of establishing to the exclusion of plants with slower growth rates (Harper 1977). Since establishment is the most critical phase of revegetation, knowledge of the initial growth rate of a species may be the best predictor of the short-term outcome of a revegetation effort (James 1992).
The goal of this study was to determine the potential to revegetate spotted knap- weed- infested rangeland by maximizing niche occupation by desirable species that establish well and persist. The overall objective was to determine the relationship among 3 desirable species and spotted knapweed during the first 2 years of estab- lishment. We hypothesized that as desir- able species richness increases, spotted knapweed establishment and growth decrease, provided the desirable species differ in niche. We believed that as desir- able species richness increased, niche occupation would increase, and resources would be increasingly preempted from spotted knapweed. Specific objectives were to: (1) quantify niche differentiation among 3 desirable species commonly used in revegetation, and (2) determine the rela- tionship between desirable species rich- ness and spotted knapweed establishment.
A supporting objective was to quantify the growth rate of spotted knapweed and 3 desirable species commonly used in reveg- etation of weed infested rangeland. This information was used to determine the potential of growth analysis to predict the outcome of the revegetation experiment.
Materials and Methods Study sites
This study was conducted at the Red Bluff Research Ranch and the Arthur Post Research Farm in southwest Montana.
Red Bluff Research Ranch (45° 34' N, 111° 40' W; herein referred to as Red Bluff) is located 40 km west of Bozeman, Mont. Elevation at Red Bluff is 1,505 m, and mean annual precipitation is 305 mm.
The Red Bluff soil is a Varney clay loam (fine - loamy, mixed, frigid Calcidic
Argiustoll). The Arthur H. Post Research Farm (45° 40' N, 111° 09' W; herein referred to as the Post Farm) is located 6 km west of Bozeman, Mont. Elevation at the Post Farm is 1,463 m, and mean annu- al precipitation is 457 mm. The Post Farm soil is an Amsterdam silty loam (fine- silty, mixed, frigid Typic Haplustoll).
Plant materials
The 3 desirable species used in this study were crested wheatgrass [Agropyron cristatum (L.) Gaertn., var. Hycrest], inter- mediate wheatgrass [Elytrigia intermedia (Host) Nevski, var. Rush], and alfalfa (Medicago sativa L., var. Arrow). Crested wheatgrass is an early emerging, cool -sea- son bunchgrass. Intermediate wheatgrass is a cool- season, sod - forming grass that matures later than crested wheatgrass (Asay and Jensen 1996). Alfalfa is a deeply taprooted forb with an extended growing period. These 3 introduced peren- nials are commonly used in revegetation in the West where the management goal is forage production. They were chosen because of their differing growth habits, potentially allowing them to collectively occupy multiple niches when used togeth- er in a revegetation seed mix (Holzworth and Lacey 1991). Seeds of these 3 desir- able species were obtained from the Bridger Plant Materials Bridger, Mont.
The weed species chosen for this experi- ment was spotted knapweed (Centaurea maculosa Lam.), a deeply taprooted Eurasian perennial forb. This species was chosen because of its ecological signifi- cance and wide distribution. Spotted knap- weed seeds were collected from Deer Lodge County, Mont., in August 1995.
Competition Experiment
Experimental design. Four background densities (blocks) of spotted knapweed (1,250, 2,500, 3,750, and 7,500 seeds m2) were used in a multiple replacement series (de Wit 1960). Each block contained seven, 4 -m2 plots: 3 plots with 1 desirable species per plot (4,500 seeds m-2), 3 plots with each combination of 2 desirable species (2,250 seeds m-2 per species), and 1 plot containing all 3 desirable species (1,500 seeds m2 per species). Nine plots with monocultures of the 3 desirable species at 1 of 3 densities (1,500, 2,250, and 4,500 seeds m -2) accompanied the multiple replacement series (Appendix A).
The 37 plots were arranged in a complete- ly randomized design.
All plots were tilled to a depth of 10 cm within 2 weeks prior to sowing to remove
existing vegetation and prepare the
seedbed. Sowing occurred on 24-25 Jun.
1996 at Red Bluff and on 28 -29 Jun. 1996 at the Post Farm. Seeds were hand sown to minimize aggregated distributions. Plots were then covered with nylon mesh backed straw -mulch (North American Green ®, Billings, Mont). To facilitate ger- mination and establishment, plots were watered daily from 29 Jun. to 29 Jul. 1996.
On 15 Jul. 1996, when plants averaged approximately 5 cm tall, the mulch was removed from all plots. Nonseeded
species were hand- weeded for the duration of the experiment.
1996 Sampling. Harvest at the Post Farm took place from 31 Oct. to 2 Nov.
1996. At the time of sampling, all plants were in the seedling stage (average height about 7 cm). A 510 -cm2 circular frame was placed in the center of a randomly selected quadrant in each plot. Density of each species was counted, and all above- ground biomass was clipped, separated by species, dried (168 hours, 60° C) and weighed. Although Red Bluff was fenced, aboveground biomass at Red Bluff was completely consumed by herbivores (grasshoppers, deer, antelope, rabbits) and was not sampled.
1997 Sampling. Both sites were sam- pled in 1997. At the time of sampling, average height of all species was about 1 m and 5 cm at the Post Farm and Red Bluff, respectively. At Red Bluff, a 510 - cm2 circular frame was placed in the cen- ter of a randomly selected quadrant in each plot. At the Post Farm, the frame was placed in center of a randomly selected, previously unsampled quadrat. Sampling
at both sites took place between 11 September and 22 September 1997.
Density (stems m-2) of each species was recorded, and all aboveground biomass was clipped, separated by species, dried (168 hours, 60° C) and weighed.
Soil water monitoring. Soil water con- tent was measured weekly during the 1996 growing season and biweekly during the 1997 growing season. A neutron probe was used to measure soil water content in the center of each plot from 10 to 150 cm below the soil surface in 20 -cm increments.
Data analysis
Niche differentiation. Niche differenti-
ation between desirable species was quan-
tified using their relative competitive coef-
ficients (Spitters 1983) derived from den-
sity and biomass data from the multiple
replacement series plots. For each combi-
nation of site and year, a model using 3
regressions was used: 1 for each desirable
species (response) being predicted by all 3 desirable species. The predictor variable was sown density or measured density, and the response variable was the average shoot weight per plant or its inverse (to linearize exponential growth). Within each model, the same predictor /response com- bination was used in each of the 3 regres- sions, and models of different predictor /response combinations were compared. Model preference was given to that which provided the highest cumula- tive R2 from its 3 individual regressions (Appendices B -D). The regressions were of the general form:
yi =130i + ßiiNi +... +ßijNj (1) where yi is the response (average weight of an individual or its inverse) of species i, Bpi is the y- intercept (interpreted as the weight of an isolated individual), ßiiNi is the product of the coefficient of intraspe- cific competition of species i (Bid and its density (Ni), and ßijNj is the product of the coefficient of interspecific competition of species j on species i (ßi1) and the density of species j (Ni). The relative competitive ability of each species is calculated as:
RCi = ßiilßij and RC/ = ßjjlßji (2)
where RCi is the relative competitive abil- ity of species i and j on species i. For example, RCi is 1/3 where 1 plant of species i and 3 plants of species j have equal influence on the average weight per plant of species i (Spitters 1983). Niche differentiation is calculated from the rela- tive competitive abilities of each species:
ND = (ßülß,il1') / (134/13H) = RCi RCj =
(ßiilßij) lßjjlßji) (3)
where ND = niche differentiation. Niche differentiation increases as ND departs from unity; that is, species i and j are decreasingly limited by the same resources (Spitters 1983).
The response variable and the sign (+ or -) of the coefficients are important in inter- preting niche differentiation ratios. Where the response is the inverse of the average weight per plant, a positive sign denotes negative interference (e.g., competition, amensalism), and a negative sign denotes positive interference (e.g., mutualism, commensalism). The opposite is true
where the response is average weight per plant.
An estimate of niche differentiation for each 2- species combination was made that accounted for the variability in the esti- mate of each predictor. For each predictor, a population of 1,000 coefficient values was created by randomly selecting from a normal distribution with mean and stan- dard error equal to that of its respective predictor. From these populations of coef- ficients, a population of 1,000 niche dif- ferentiation values was calculated for each 2- species combination. A 2- tailed t -test was performed to quantify the difference between each population of niche differen- tiation values and a population of 1,000 values of unity (no niche separation). The resultant P -value represents the degree of niche separation. For example, a small P- value indicates a small probability that the 2 species overlapped in niche, while a P- value of unity indicates complete niche overlap (no niche differentiation).
Spotted knapweed recruitment. The effects of desirable species richness on spotted knapweed recruitment [(spotted knapweed density /spotted knapweed sow- ing density) x 100 %] were compared using one - tailed t -tests (P < 0.05).
Analysis of variance was used to test the effect of desirable species mixture on spotted knapweed recruitment (PROC GLM, SAS Institute Inc. 1991). Means were compared (P < 0.05) using Fisher's protected LSD test (Peterson 1985).
Spotted knapweed biomass and densi- ty. Linear regression was used to quantify the relationship between desirable species richness and spotted knapweed biomass and density. An ANOVA was used to compare mean aboveground biomass of spotted knapweed to mean aboveground biomass of the desirable species.
Soil water. Soil water content (average content of all depths, averaged over the entire season) was used to predict spotted knapweed growth using linear regression.
Total aboveground biomass was used to predict season -long soil water depletion
([beginning soil water content] [ending
soil water content]). ANOVA was used to compare the effects of desirable species mixture and richness on soil water deple-
tion (average of all depths, averaged over the entire season).
Growth Analysis Experiment Isolated plants of spotted knapweed, crested wheatgrass, intermediate wheat - grass, and alfalfa were arranged in a ran- domized- complete -block design. Each of 4 blocks contained 20 plants (4 species x 5 harvest dates). Plants were grown in pots in an environmental chamber (12° C, 12- hour daylength, 500 µE In-2 sec' visible radiation measured at pot height). The pots (10 cm diameter x 1 m length polyvinyl chloride tubes) were split vertically and taped back together to facilitate post-har- vest root removal. The pots were filled with sterilized Farland silt loam (fine -silty,
mixed Typic Argiboroll; A horizon), water - saturated, and allowed to drain to pot capacity. Ten seeds of a given species were evenly spaced on the soil surface of each pot and covered lightly with soil (< 2 mm). The surface was lightly misted with water once daily and covered with clear plastic until emergence (7 days), after which no further watering occurred. Pots were thinned to a single individual per pot (10 days).
Seed weight of each species was deter- mined by taking the mean of 4 subsamples of 100 seeds. First plant harvest occurred 14 days after emergence (DAE). Harvests continued on 14 -day intervals until final harvest (70 DAE). Soil was manually rinsed from roots. Root systems were extracted from each pot, separated from shoots, and washed. All plant material (root and shoots) was dried (48 hours, 60°
C) and weighed.
A regression analysis was used to esti- mate the instantaneous relative growth rate (RGR) calculated over the 70 -day period (Hunt 1982). Slopes were compared using the extra sums of squares procedure (P <
0.05, Ratkowski 1983).
Results Competition Experiment
The desirable species were significantly niche differentiated from each other at the
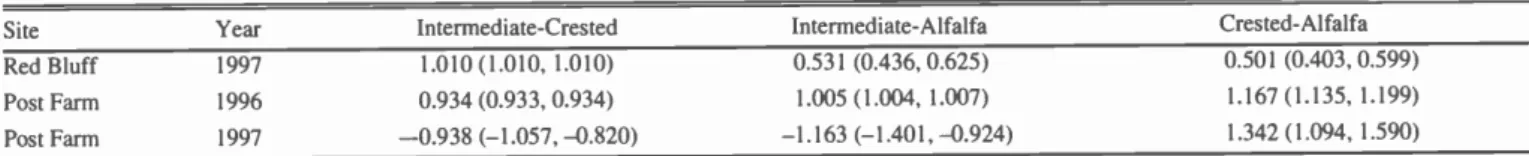
Table 1. Niche differentiation (ND) mean values for the desirable species pairs. An ND of unity represents complete niche overlap. P represents the probability that ND = 1. P for all means was less than 0.01. Numbers in parentheses = lower and upper limits of the 95% confidence interval.
Site Year Intermediate- Crested Intermediate- Alfalfa Crested - Alfalfa
Red Bluff 1997 1.010 (1.010, 1.010) 0.531 (0.436, 0.625) 0.501 (0.403, 0.599)
Post Farm 1996 0.934 (0.933, 0.934) 1.005 (1.004, 1.007) 1.167 (1.135, 1.199)
Post Farm 1997 0.938 (- 1.057, 0.820) 1.163 (-1.401, 0.924) 1.342 (1.094, 1.590)
120
é
= 80
4°
-
AGCR ELIN
Post Farm
MESA AGCR ELIN
1996
AGCR MESA
ELIN MESA
AGCR ELIN MESA
40
30'
20
á
10Post Farm
T
1996
O
1 2 3
Desirable species richness Desirable species mixture
ó80
60
L 40-
a g
20-
AGCR ELIN
Red
MESA
Bluff
1997AGCR ELIN
AGCR MESA
ELIN MESA
AGCR ELIN MESA
100
o
s0=
605
40á
b 20Red Bluff
1997O
1 2 3
Desirable species richness Desirable species mixture
40
30
4 6 20-
6
álo
AGCR ELIN
Post
I MESAI
Farm
1997AGCR ELIN
AGCR MESA
ELIN MESA
AGCR ELIN MESA
50-
40
é
C 30
s
Post Farm 1997
-¡
-
20
a
el 1°0
1 2 3
Desirable species richness Desirable species mixture
Fig. 1. Effect of desirable species mixture (error bars = 1 LSD) and desirable species richness (error bars = 1 SE) on spotted knapweed recruitment by site and year. Neither desirable species mixture nor desirable species richness significantly affected spotted knapweed recruitment.
ELIN = intermediate wheatgrass; AGCR = crested wheatgrass; MESA = alfalfa.
Post Farm in 1996 and at both sites in 1997 (Table 1). However, spotted knap- weed recruitment was not affected by desirable species mixture or richness at the Post Farm in 1996 or at either site in
1997 (P < 0.05, Fig. 1).
Total desirable plant sowing density was the same in all plots containing spotted knapweed. Because spotted knapweed sowing density varied among plots, rela tionships among desirable species richness and spotted knapweed may have been influenced by spotted knapweed sowing
Table 2. Linear regression of spotted knapweed measured density on its sowing density.
Year Site P Model R2 Model
1996 Post Farm < 0.01 0.45
1997 Red Bluff < 0.01 0.44
1997 Post Farm 0.63 0.01
density. Regressions of spotted knapweed measured density on its sowing density were highly significant (P < 0.001) for the Post Farm in 1996 and Red Bluff in 1997;
Table 3. Linear regression of spotted knapweed for the Post Farm in 1997.
however, this relationship was not signifi- cant for the Post Farm in 1997 (Table 2).
Therefore, the relationships between desir- able species richness and spotted knap- weed biomass and density were not con- founded by spotted knapweed sowing den- sity at the Post Farm in 1997, and these relationships were quantified. Neither rela- tionship was significant (Table 3). At the Post Farm in 1997, mean biomass of spot- ted knapweed was at least 5 times greater than the mean biomass of each of the desirable species, which were similar (Fig.
2). Biomass of desirable species monocul- tures grown in the absence of spotted knapweed was similar to spotted knap- weed biomass and total biomass (all species) of mixtures at the Post Farm in 1997 (Fig. 3). There was no significant relationship between spotted knapweed biomass and desirable species biomass in plots where spotted knapweed was sown (Fig. 4).
For reasons stated above, relationships between spotted knapweed biomass and total plot biomass were not confounded by spotted knapweed sowing density at the Post Farm in 1997. This allowed for the quantification of the following 2 relation- ships for the Post Farm in 1997: (1) between spotted knapweed biomass pro- duction and soil water content, and (2) between total biomass production by all species and soil water depletion. Neither relationship was significant (Table 4).
Neither desirable species mixture nor rich- ness affected season -long soil water deple- tion at the Post Farm in 1997 (Fig. 5).
Season -long soil water depletion by depth increment showed no consistent trends or differences by species mixture at either site or in either year (data not shown). Soil water depletion by sampling date and
species mixture showed no consistent trends or differences for any depth incre-
ment at either site or in either year (data not shown).
biomass and density on desirable species richness
Independent variable Dependent variable P Model R2 Model
Desirable species richness
Spotted knapweed biomass
Spotted knapweed density
0.76 0.004
0.31 0.04
Table 4. Linear regressions of spotted knapweed biomass production on season - average soil water content and season -long soil water depletion on total biomass production by all species for the Post Farm in 1997.
Independent variable Dependent variable P Model R2 Model
Soil water content Spotted knapweed biomass Total biomass production Soil water depletion
0.36 0.03
0.51 0.01
2.5
2.0
1.5
l.0
r
l
Post Farm 1996
Red Bluff 1997 Post Farm 1997
Fig. 2. Mean shoot biomass per species by site and year. For each desir- able species, data represent its mean biomass per plot in the multiple replacement series plots where it was sown (mean sowing density per desirable species = 2625 seeds I11-2; total desirable species sowing densi- ty = 4500 seeds m "2; mean spotted knapweed sowing density = 3750 seeds m "2). Data for spotted knapweed represent all 28 multiple replacement series plots. At the Post Farm in 1997, biomass of spotted knapweed was greater than each of the desirable species, which were similar. Error bars = 1 SE. ELIN = intermediate wheatgrass; AGCR
= crested wheatgrass; MESA = alfalfa; CEMA = spotted knapweed.
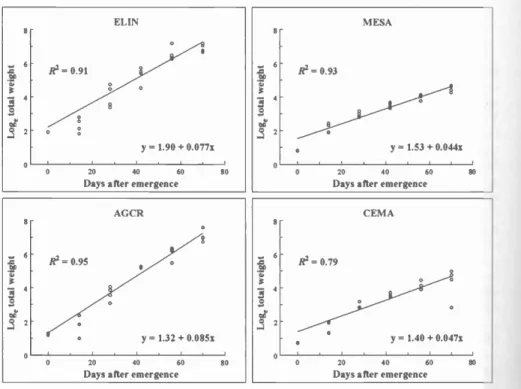
Growth Analysis
Relative growth rates of intermediate and crested wheatgrasses were similar to each other, and approximately twice that of alfalfa and spotted knapweed, which were similar to each other (Fig. 6).
Discussion and Conclusions Increasing species richness with species that are niche differentiated would be expected to increase resource use because niche occupation increases. Hooper and Vitousek (1998) found that increasing functional group diversity increased resource use, and Tilman et al. (1997) and Brown (1998) found increasing functional group diversity increased aboveground biomass. Carpinelli (2000) has shown that in well established communities, increas- ing species richness with niche- differenti- ated species increased overall biomass production and reduced spotted knapweed invasion, suggesting resources were pre- empted from establishing spotted knap- weed. In this study, however, where all species established simultaneously, increasing desirable species richness had no effect on spotted knapweed even though the desirable species were niche differentiated. This may be because this
,
2.5
2.0
E
1.5
V. 1.0
0.5
0.0
ELIN AGCR MESA CEMA TOTAL
Fig. 3. Mean shoot biomass of monocultures of intermediate wheatgrass (ELIN), crested wheatgrass (AGCR), and alfalfa (MESA) in plots where spotted knapweed was not sown; mean biomass of spotted knapweed (CEMA) in mixtures; and mean total biomass of all species in mixtures (TOTAL) for the Post Farm in 1997. Mean sowing density of desirable species monocultures was 2750 seeds m-2. Mean sowing density of spotted knapweed in mixtures was 3750 seeds m "2. Total sowing density of desirable species in mixtures was 4500 seeds m "2.
There were no significant differences among biomass means. The dif- ference between CEMA and TOTAL represents desirable species bio- mass in plots where spotted knapweed was sown. Error bars = 1 SE.
study was limited to the first 2 years of establishment, when occupation of `bio- logical space' may be more important than competition for resources (Harper 1977).
However, the fact that biomass of desir- able species monocultures was similar to total biomass of mixtures containing spot- ted knapweed (Fig. 3) indicates that spot-
ted knapweed was able to preempt
resources from desirable species in the second growing season, or that spotted knapweed was able to outcompete the desirable species regardless of the degree of niche occupation by desirable species.
Spotted knapweed germination is posi-
tively related to light (Nolan and
Upadhyaya 1988, Lindquist et al. 1991), and spotted knapweed germination and
2
o
o D
D
D
Do
o 0 o
o$
D o
D
Desirable species richness
0 1 0 2 3
D
o D
o
D
D
0.0 0.2 0.4 0.6
Desirable species biomass (kg m -2)
Fig. 4. Regression of spotted knapweed biomass on total desirable species shoot biomass for the
Post Farm in 1997. The regression model was not significant.
0.12
S o.io
c 0.08 0 â 0.06
4)
0.04
0.02
0.00
AGCRl
ELIN
AGCR AGCR AGCR ELIN ELIN MESA ELIN MESA MESA MESA
Desirable species mixture
0.10
0.08
Ç 0.06
â
a,. 0.04
a)., 0.02
C/)
0 0.00
I
I
l
1 2
Desirable species richness
3
Fig. 5. Effects of desirable species mixture and desirable species richness on season -long soil water depletion (10 to 150 cm soil depth average) for the Post Farm in 1997. Neither effect was signifi- cant. ELIN = intermediate wheatgrass; AGCR = crested wheatgrass; MESA = alfalfa.
growth is positively related to soil water content (Eddleman and Romo 1988, Jacobs and Sheley 1997, Carpinelli 2000).
In this study, the lack of effect of mean soil water content on spotted knapweed growth, and the lack of effect of spotted knapweed growth on soil water depletion, indicate water was neither limiting to, nor influenced by, spotted knapweed, at least for the depth increments monitored in this study. In addition, the lack of effect of desirable species richness on soil water depletion indicates that the desirable species were not limited by soil water.
This suggests niche differentiation among desirable species may have resulted from competition for a resource other than
Fig. 6. Relative growth rates of isolated individ- uals of intermediate wheatgrass (ELIN), crested wheatgrass (AGCR), alfalfa (MESA),
and spotted knapweed (CEMA). Plant weight at 0 days after emergence = seed weight.
water, and that same resource may not
have been limiting to spotted knapweed.
Brown (1998) found that plants grown in containers in low- density monocultures showed similar morphology to plants of those same species when grown in high density monocultures under field condi- tions. The growth analysis results in this study led us to expect intermediate wheat- grass and crested wheatgrass may be capa- ble of preempting resources from spotted knapweed in the competition experiment (Fig. 6). However, the reduction in desir- able species biomass from monocultures to mixtures containing spotted knapweed (Fig. 3) suggests: (1) competition by spot-
ted knapweed appears to have been responsible for its dominance over the desirable species, and (2) growth charac- teristics of a plant grown in isolation may not be reflective of that species' growth characteristics grown in populations or communities. This is supported by the work of Huber Sannwald et al. (1996), who found that Pseudoroegneria spicata differed morphologically when grown in monoculture vs. grown in mixtures with Agropyron desertorum.
In this study, the ability of spotted knap- weed to dominate the desirable species, regardless of species richness, demon- strates the necessity to consider site histo- ry in revegetation. If revegetation of weed infested rangeland is to be successful, it must address potential weed reestablish- ment from seeds or other propagules in the soil. For broadleaf weeds, this may be
8-
r
on 63 Ó 4
á
eñ2ELIN
° ®
R2=0.91 °
° °
°
° S
y = 1.90 + 0.077x
1
8-
6
r,
on3 Ó
á 2-
toMESA
RZ=0.93
, y= 1.53 + 0.044x
o 1
0 20 40 60 80
Days after emergence
o
0 20 40 60 80
Days after emergence
8
6
7,3 4 O 00a
á z
AGCR
°
a°
R2 = 0.95 °
°
°
y = 1.32 + 0.085x
8
6 T)
3 4-
3 00u°a 2
CEMA
RZ = 0.79
° °
°
o
' y = 1.40 + 0.047x
i i
0 20 40 60 80
Days after emergence
o
0 20 40 60 80
Days after emergence
accomplished by using a persistent
broadleaf herbicide to provide a weed -free window of establishment for desirable grass species, followed by a delayed seed- ing of desirable broadleaf species. For either grass or broadleaf weeds, it may be possible to deplete the soil seed bank prior to revegetation by allowing weed seeds to germinate, removing the emerging weeds by tilling or applying a non - specific, non
persistent herbicide such as glyphosate, and then seeding with a diverse mix of desirable species. The desirable species may dominate the site by preempting resources from weeds that may later emerge. Only after controlling weeds emerging from the soil seed bank, may long -term revegetation success be
achieved by maximizing niche occupation by desirable species.
Literature Cited
Asay, K.H. and K.B. Jensen. 1996.
Wheatgrasses. In: L.E. Moser, D.R. Buxton, and M.D. Casier (eds.) Cool- season forage grasses. Amer. Soc. of Agron. Inc., Crop Sci.
Soc. of Amer. Inc., Soil Sci. Soc. Amer. Inc.
Madison, Wis. pp. 691 -724.
Berube, D.E. and J.H. Myers. 1982.
Suppression of knapweed invasion by crested wheatgrass in the dry interior of British Columbia. J. Range Manage. 35:459 -461.
Borman, M.M., W.C. Krueger, and D.E.
Johnson. 1991. Effects of established peren- nial grasses on yields of associated annual weeds. J. Range Manage. 44:318 -326.
Brown, C.S. 1998. Restoration of California Central Valley grasslands: applied and theo- retical approaches to understanding interac- tions among prairie species. Ph.D. Thesis.
Univ. California. Davis, Calif.
Call, C.A. and B.A. Roundy. 1991.
Perspectives and processes in revegetation of
arid and semiarid rangelands. J. Range
Manage. 44:543 -549.
Carpinelli, M.F. 2000. Designing weed- resis- tant plant communities by maximizing niche occupation and resource capture. Ph.D.
Thesis. Montana State Univ. Bozeman, Mont.
de Wit, C.T. 1960. On competition. Versl.
Landbouwk. Onderz. 66:1 -82.
Eddleman, L.E. and J.T. Romo. 1988.
Spotted knapweed germination response to stratification, temperature, and water stress.
Can. J. Bot. 66:653 -657.
Goldberg, D.E. 1990. Components of resource competition in plant communities. In: J.B.
Grace and D. Tilman (eds.) Perspectives on plant competition. Academic Press. San Diego, Calif. pp. 27 -49.
Harper, J.L. 1977. The population biology of plants. Academic Press, London.
Harris, G.A. 1967. Some competitive relation- ships between Agropyron spicatum and Bromus tectorum. Ecol. Monogr. 37:89 -111.
Holzworth, L. and J. Lacey. 1991. Species selection criteria for seeding dryland pastures in Montana. Mont. State Univ. Ext. Bull. 19.
Bozeman, Mont.
Hooper, D.U. and P.M. Vitousek. 1998.
Effects of plant composition and diversity on nutrient cycling in serpentine grassland.
Ecol. Monogr. 68:121 -149.
Hubbard, W. A. 1975. Increased range forage production by reseeding and the chemical control of knapweed. J. Range Manage.
28:406-407.
Huber - Sannwald, E., D.A. Pyke, and M.M.
Caldwell. 1996. Morphological plasticity following species- specific recognition and competition in two perennial grasses. Amer.
J. Bot. 83:919 -931.
Hunt, R. 1982. Plant growth curves: The func- tional approach to plant growth analysis.
University Park Press. Baltimore, Md. 555 p
Huston, C.H., R.H. Callihan, and R.L.
Sheley. 1984. Reseeding intermediate wheat grass in yellow starthistle- infested rangeland.
In: Proc. Knapweed Symp., Montana State Univ. Coop. Ext. Bull. 1315. Bozeman, Mont. pp. 42-44.
Jacobs, J.S. and R.L. Sheley. 1997.
Relationships among Idaho fescue defolia- tion, soil water, and spotted knapweed emer-
gence and growth. J. Range Manage.
50:258 -262.
James, D. 1992. Some principles and practices of desert revegetation seeding. Arid Lands Newsletter 32:22 -27.
Larson, L.L. and M.L. McInnis. 1989. Impact of grass seedings on establishment and densi- ty of diffuse knapweed and yellow starthistle.
Northwest Sci. 63:162 -166.
Lindquist, J.L., P.K. Fay, and E.S.
Davis.1991. The light requirement of dor- mant spotted knapweed seeds in soil. Proc.
West. Soc. Weed Sci. 44:48 -49.
Nolan, D.G. and M.K. Upadhyaya. 1988.
Primary seed dormancy in diffuse and spot- ted knapweed. Can. J. Plant Sci. 68:775 -783.
Peterson, R.G. 1985. Design and analysis of experiments. Marcel Dekker, Inc. New York, N.Y.
Radosevich, S.R. and J.S. Holt. 1984. Weed ecology. John Wiley & Sons, Inc. New York, N.Y. 265 p.
Ratkowski, D.A. 1983. Nonlinear regression modeling: a unified practical approach.
Marcel Dekker, Inc., New York, N.Y. 276 p.
Ross, M.A. and J.L. Harper. 1972.
Occupation of biological space during
seedling establishment. J. Ecol. 60:77 -88.
SAS Institute Inc. 1991. SAS /STAT Userís Guide, Release 6.03 edition. SAS Institute Inc., Cary, N.C. 1028 p.
Spitters, C.J.T. 1983. An alternative approach to the analysis of mixed cropping experi- ments. I. Estimation of competition effects.
Netherlands. J. Agr. Sci. 31:1 -11.
Tilman, D., J. Knops, D. Wedin, P. Reich, M.
Ritchie and E. Siemann. 1997. The influ- ence of functional diversity and composition
on ecosystem processes. Sci.
277:1300 -1302.
Appendix A. Plot plan for multiple replacement series (upper) and monocultures (lower). Each cell represents 1 mixture; field location of all plots was complete randomized. AGCR = crested wheatgrass; ELIN = intermediate wheatgrass; CEMA = spotted knapweed; MESA = alfalfa. CEMAQ,
CEMAZ, CEMA2, CEMA3 and CEMA4, represent background spotted knapweed sowing densities of 0, 1,250, 2,500, 3,750 and 7,500 seeds m, respectively. Subscripted proportions of 0, 1/3, 1/2, and 1 represent sowing densities of desirable species: 0, 1,500, 2,250, and 4,500 seeds m-2, respec- tively.
AGCR1/3 EL1N1r3
MESA1r3 CEMA,
AGCR, ELIN() MESA() CEMA,
AGCRo ELIN, MESA° CEMA,
AGCRo ELINo MESA, CEMA,
AGCR1r2 ELIN2 MESAo CEMA,
AGCR1r2 ELIN°
MESA12 CEMA,
AGCRo ELIN,a MESA2 CEMA,
AGCR,,, ELIN1/3 MESA1/3 CEMA2
AGCR, ELIN0 MESA° CEMA2
AGCRo ELIN, MESA° CEMA2
AGCR° ELIN0 MESA, CEMA2
AGCRz ELINu2 MESAO CEMA2
,
AGCR 2 ELIN0 MESA,r2 CEMA2
AGCRo ELIN,/2 MESA 1/2 CEMA2
AGCR,r3 ELINtr3 MESA,r3 CEMA3
AGCR, ELIN0 MESA° CEMA3
AGCRo ELIN, MESA° CEMA3
AGCR() ELIN0 MESA, CEMA3
AGCR1r2 ELIN12 MESAO CEMA3
AGCR,i2 ELIN°
MESA I/2 CEMA3
AGCRo ELIN2 MESA in CEMA3
AGCR 3 ELIN1/3 MESA1r3 CEMA.
1
AGCRI ELIN0 MESA° CEMA.
AGCRo ELIN, MESA° CEMA,
AGCRo ELIN() MESA, CEMA.
AGCR,r2 ELIN,n MESA° CEMA.
AGCR2 ELINo MESA1/2 CEMA.
AGCRo ELIN1i2 MESA1r2 CEMA.
AGCR,r3 ELIN0 MESA() CEMA()
AGCRo ELIN,r3 MESA° CEMAo
AGCRo ELINo MESA1i3 CEMAo
i
AGCR1r2 ELIN0 MESAo CEMA°
AGCRo ELIN 2 MESA() CEMAo
AGCRo ELINo MESA I/2 CEMAo
1
AGCR, ELIN0 MESA() CEMAo
AGCRo ELIN, MESA° CEMAo
AGCRo ELINo MESA, CEMAo
Appendix B. Regressions used in calculating niche differentation for the Post Farm in 1996. The y- intercept (ymax) is interpreted as the weight of an isolated individual. Numbers in parentheses = 1 SE.
Response:
average shoot weight per plant (mg)
Predictor:
sown density (seeds m-2)
Coefficient response predictor
Intermediate wheatgrass (I) R2 =0.83
y = 407 (39.1)
Intermediate wheatgrass ßp = -0.077 (0.010)
Crested wheatgrass (3,c = -0.070 (0.010)
Alfalfa ß,A _ -0.078 (0.010)
Crested wheatgrass (C) Intermediate wheatgrass 3c _ -0.069 (0.014)
R2 = 0.68 Crested wheatgrass 13cc = -0.065 (0.013)
ymax = 342 (51.9)
Alfalfa ßcß _ -0.069 (0.014)
Alfalfa (A) R2 =0.50 ya = 280 (55.0)
Intermediate wheatgrass ß,u = -0.051 (0.015)
Crested wheatgrass PAC = -0.015 (0.015)
Alfalfa f3AA = -0.051 (0.014)
Appendix C. Regressions used in calculating niche differentiation for the Post Farm in 1997. The y- intercept (ymax) is interpreted as the inverse of the weight of an isolated individual. Numbers in parentheses = 1 SE.
Response:
inverse of the average shoot weight per plant (mg')
Intermediate wheatgrass (I) R2=0.58 yo = 12.6 (2.97)
Crested wheatgrass (C)
R2
= 0.53
y=32.6 (35.1)
Alfalfa (A) R2 =0.36 y.= 18.6 (9.47)
Predictor: Coefficient
measured density ßresponse predictor
(plants m2)
Intermediate wheatgrass ßiß = -0.005 (0.003)
Crested wheatgrass Pic = -0.006 (0.008)
Alfalfa PIA = 0.033 (0.011)
Intermediate wheatgrass ßci = -0.137 (0.227)
Crested wheatgrass ßcc = -0.009 (0.017)
Alfalfa ßCA = 0.616 (0.215)
Intermediate wheatgrass ß = 0.0347 (0.057)
Crested wheatgrass PAC = 0.130 (0.090)
Alfalfa I3AA _ -0.022 (0.016)
Appendix D. Regressions used in calculating niche differentiation for Red Bluff in 1997. The y- intercept (ymax) is interpreted as the weight of an isolat- ed individual. Numbers in parentheses = 1 SE.
Response:
average shoot weight per plant (mg)
Intermediate wheatgrass (I) R2 =0.74 ymu = 1729 (254)
Crested wheatgrass (C) R2 =0.98 y.= 1417 (52.4)
Alfalfa (A) R2 =0.22
ym.