ORIGINAL RESEARCH
Diffusion-Weighted Echo-Planar MR Imaging of
Primary Parotid Gland Tumors: Is a Prediction of
Different Histologic Subtypes Possible?
C.R. Habermann C. Arndt J. Graessner L. Diestel K.U. Petersen F. Reitmeier J.O. Ussmueller G. Adam M. Jaehne
BACKGROUND AND PURPOSE: Our aim was to determine the value of echo-planar diffusion-weighted MR imaging (epiDWI) in differentiating various types of primary parotid gland tumors.
MATERIALS AND METHODS:One hundred forty-nine consecutive patients with suspected tumors of the parotid gland were examined with an epiDWI sequence by using a 1.5T unit. Image analysis was performed by 2 radiologists independently, and the intraclass correlation coefficient was computed. Histologic diagnosis was obtained in every patient. For comparison of apparent diffusion coefficients (ADCs), a paired 2-tailed Studentttest with a Bonferroni correction was used.
RESULTS: In 136 patients, a primary parotid gland tumor was confirmed by histology. Among the observers, a high correlation was calculated (0.98). ADC values of pleomorphic adenomas were significantly higher than those of all other entities, except for myoepithelial adenomas (P⫽.054). ADC values of Warthin tumors were different from those of myoepithelial adenomas, lipomas, and salivary duct carcinomas (P⬍.001, 0.013, and .037, respectively). Mucoepidermoid carcinomas, acinic cell carcinomas, and basal cell adenocarcinomas were not differentiable from Warthin tumors (P⫽.094, .396, and .604, respectively).
CONCLUSION:epiDWI has the potential to differentiate pleomorphic adenoma and myoepithelial adenomas from all other examined entities. Due to an overlap not only within the group of benign and malignant lesions but also between groups, diagnoses should not be addressed on the basis of ADC values solely. Therefore, further studies combining DWI, morphologic criteria, and probably other MR imaging techniques seem warranted.
A
mong all human organs, salivary glands offer the largest variety of different histologic types and subtypes of pri-mary neoplasms, most of them arising in the parotid glands.1 Therefore, the management of tumors of the salivary glands requires a detailed understanding of the anatomy and patho-logic processes affecting these glands.2,3Most important for choosing the appropriate surgical approach regarding a pri-mary tumor of the salivary glands is not only the preoperative differentiation between a benign or malignant lesion but also the determination of the exact histologic subtype among be-nign or malignant lesions.2-5Whereas the risk for local recur-rence in Warthin tumors treated by enucleation is approxi-mately 2%, the risk for local recurrence in pleomorphic adenomas treated in the same manner is reported to be ap-proximately 85%.3,4,6-8This perception leads to different sur-gical approaches among not only benign but also malignant lesions.4,5,7Fine-needle aspiration cytology (FNAC) proved to be a useful and reliable tool in the preoperative diagnosis of salivary gland masses when performed by a radiologist or a clinician.1,9-13In contrast, Das et al14reported, in a study of 712 patients, a diagnostic accuracy reaching only from 80% to 91.1%. A risk of FNAC might be a possible spread of tumor cells,which can lead to a higher likelihood of local recurrence, es-pecially in pleomorphic adenomas and malignant lesions. Ad-ditionally, the differentiation of a few benign and malignant lesions might be not only difficult but also impossible.14,15For instance, pleomorphic adenomas of variable histologic pat-terns can be mistaken for several other types of tumors, such as mucoepidermoid carcinoma or adenoid cystic carcinoma.1 Furthermore, a differentiation between a basal cell adenoma and a basal cell adenocarcinoma based solely on a FNAC is usually not possible.14,16
Therefore, several MR imaging⫺based techniques have been evaluated for the diagnosis of benign and malignant sal-ivary gland tumors.17-31In contrast to FNAC, a noninvasive examination such as MR imaging might provide a diagnosis and also stage the disease. Among the evaluated image-based techniques, diffusion-weighted imaging (DWI) seems to have the highest potential to determine different histologic sub-types of salivary gland tumors noninvasively.18,19,31,32In uni-son, the mentioned authors referred to the high potential of DWI for differentiating benign and malignant lesions or, fur-thermore, determining different histologic subtypes within the 2 groups. The major drawback of the mentioned studies is the limited number of histologic subtypes of primary salivary gland tumors, which might lead to an overestimation of this technique.
The purpose of our prospective study was to investigate the potential of echo-planar DWI (epiDWI) in differentiating var-ious entities of parotid gland tumors.
Materials and Methods
Subjects
This prospective study was conducted in accordance with the recom-mendations of the local ethics committee that approved it. Written
Received August 8, 2008; accepted after revision October 17.
From the Department of Diagnostic and Interventional Radiology (C.R.H., C.A., L.D., G.A.), Diagnostic Center; Department of Psychiatry and Psychotherapy (K.U.P.), Center of Psycho-social Medicine; and Department of Oto-, Rhino-, Laryngology (F.R., M.J.), Center for Head Care and Dermatology, University Medical Center Hamburg-Eppendorf, Hamburg, Germany; Siemens Healthcare (J.G.), Hamburg, Germany; and Center of Oto-, Rhino-, Laryngology Regensburg (J.O.U.), Regensburg, Germany.
Please address correspondence to Christian R. Habermann, MD, University Medical Center, Diagnostic Center, Department of Diagnostic and Interventional Radiology, Martinistr. 52, 20246 Hamburg, Germany; e-mail: [email protected]
DOI 10.3174/ajnr.A1412
HEAD
&
NECK
ORIGINAL
informed consent for participation in this study was signed by all included patients.
Between February 2003 and January 2008, 149 consecutive pa-tients (67 females, 82 males; age range, 17–90 years; mean age, 57.2 years⫾12.6) with a clinically suspected primary tumor of the parotid gland were examined prospectively before surgery. Before MR imag-ing, all patients underwent sonography to confirm the suspected clin-ical diagnosis. As part of the study protocol, in none of the included patients was a fine-needle aspiration performed before MR imaging. All patients underwent surgery, and in all cases, histologic diagnosis was available. The maximal period between MR imaging and surgery was 15 days (range, 1–15 days; mean, 5.7⫾2.3 days).
MR Imaging Protocol
All examinations were performed on a 1.5T superconducting MR imaging system with a 30 mT/m maximum gradient capability and a maximum slew rate of 125 mT/m/ms (Magnetom Symphony; Sie-mens Medical Solutions, Forchheim, Germany). The lower part of the circularly polarized (CP) head coil and a standard 2-element CP neck array coil were used. The flexibility of the neck array coil allowed positioning of the N1 element (the upper part of the coil) right next to the parotid glands. Initially, for anatomic localization of the parotid gland, an axial T1-weighted spin-echo sequence (TR, 500 ms/TE, 14 ms) was performed by using a matrix of 192⫻512, an FOV of 210⫻280 mm (pixel size, 1.09⫻0.55 mm), a section thickness of 5 mm with an intersection gap of 1.25 mm, and 3 signals averaged. The acquisition time of this sequence was 1 minute 45 seconds.
As a T2-weighted sequence, 3D true fast imaging with steady-state precession (true FISP) (TR, 700 ms/TE, 2.29 ms) with spectral fat saturation was performed by using a matrix of 256⫻256, an FOV of 160⫻160 mm (pixel size 0.6⫻0.6 mm), a section thickness of 2.5 mm, and 3 signals averaged. The acquisition time of this sequence was 1 minute 44 seconds. Instead of a T2-weighted spin-echo sequence, this one was performed to combine the T2 image impression and improve the visualization of the excremental ducts. Hence, this quence was a compromise between a morphologic T2-weighted se-quence and the heavily T2-weighted sese-quence to get a T2-weighted image impression of the glands and to evaluate the excremental ducts for possible additional pathologies.
The resulting images were analyzed for morphologic alterations, such as metal artifacts from dental implants and localization of the tumor, to ensure proper coverage of the entire tumor, by the follow-ing epiDWI sequence in consensus by 2 radiologists (C.R.H. and T.R., with 12 and 2 years of experience in the field of radiology, respec-tively). Thereafter, an axial epiDWI sequence (TR, 1500 ms; TE, 77 ms) was performed with a matrix of 119⫻128, an FOV of 250⫻250 mm (pixel size, 2.10⫻1.95 mm), 6 excitations, and a section thick-ness of 5 mm with an intersection gap of 1 mm. A parallel imaging technique (modified sensitivity encoding) with an acceleration factor of 2 with 12 additional lines for self-calibrating was applied. A bandwidth of 1502 Hz/pixel was used, and 12 sections were acquired. The b factors used were 0 s/mm2, 500 s/mm2, and 1000 s/mm2. Fat suppression was achieved by placing the frequency-selective ra-dio-frequency pulse before the pulse sequence. The automatic 3D shim routine of the magnet used the section block as the shim volume, and shimming was performed directly before the sequence was started. The total acquisition time of this sequence was 1 minute 14 seconds.
Image Analysis
For each epiDWI sequence, a pixel-by-pixel apparent diffusion coef-ficient (ADC) map was automatically calculated, with the gray value of the pixel linearly corresponding to the ADC value expressed in square millimeters per second. The ADC values were calculated by using a least-square solution of the following system of equations: S(i)⫽SO⫻exp(⫺bi⫻ADC), where S(i) is the signal intensity mea-sured on the ithb factor and b
iis the corresponding b factor image. 33
SOis a variable estimating the exact signal intensity for a b factor of 0
s/mm2.34
Data were digitally transferred to the analyzing software MRIcro 1.4 (Chris Rorden, University of Nottingham, Great Britain; http:// www.sph.sc.edu/comd/rorden), which lists every pixel intensity of each ADC map in a single region-of-interest output file per patient. The delineation of tumors on ADC maps and subsequently the ADC computation were performed by 2 investigators (C.R.H. and L.D.), independently. An irregular region of interest was placed manually on ADC maps covering the entire tumor of every patient. This procedure was performed on all ADC maps where the tumor was visible, de-pending on the craniocaudal tumor extension. The localization of every single region of interest was confirmed by using the morpho-logic T1- and T2-weighted sequences. In a first step, the mean ADC value per region of interest and per patient was computed. The fol-lowing analyses were based on the mean of each patient’s mean values. Only entities with at leastⱖ2 examined patients were included in the further statistical evaluation, to ensure statistical accuracy. Subse-quently, each tumor size was measured in consensus by 2 radiologists (C.R.H. and L.D.) in every patient by using the software eFilm 2.1.2 (Merge Healthcare, Milwaukee, Wis) based on T2-weighted images.
Statistical Analysis
All statistical analyses were computed with the Statistical Package for the Social Sciences, Version 13.0.1 (SPSS, Chicago, Ill). ADC values for each histologic subtype were achieved by taking the mean of the separate mean values of each tumor per patient. For comparison of the different histologic types of parotid gland tumors, an unpaired 2-tailed Studentttest with a Bonferroni correction for multiple test-ing was used, and aP⬍.05 was considered to indicate statistical significance. Regarding the ADC determinations by the 2 radiologists, an intraclass correlation coefficient was computed to evaluate inter-observer variability and a correlation⬎0.8 was high.
Results
In 145 of 149 patients, a single 1-sided lesion was detected within the right (n⫽67) or left (n⫽78) parotid gland. In 4 patients, 2 lesions (right side,n⫽1; left side,n⫽3) were visible on MR images and confirmed by surgery and histologic work-up. In the 4 mentioned patients with 2 lesions within a parotid gland, pathology confirmed Warthin tumors. For fur-ther evaluation, only the larger lesion was included in the study.
epiDWI depicted the parotid glands of all patients, and in all patients, the delineation of the lesion was possible on ADC maps but additionally confirmed on the morphologic T1- and T2-weighted sequences. In 13 patients, the suspected lesions within the parotid gland proved to represent involvement from nonparotideal malignancies (n⫽9, lymphoma metasta-ses) or inflammatory pseudolesions (n⫽4) and, therefore, were excluded from further evaluation.
tumors within the remaining 136 patients (62 women, 74 men; age range, 33–90 years; mean age, 59.2⫾14.9 years) are given in Table 1. The mean tumor size was 2.1⫾0.6 cm (range, 0.4 –3.2 cm). The highest ADC value among all tumor entities was calculated for a solitary cystadenoma (2.29 ⫻ 10⫺3 mm2/s), which showed a higher ADC value than pleomorphic adenomas (2.09⫻10⫺3mm2/s⫾0.16⫻10⫺3mm2/s) (Table 2 and Fig 1). On the basis of the mean of the ADC values, pleomorphic adenomas were distinguishable from all other examined subtypes, except for myoepithelial adenomas (P⫽ .054, Fig 2). Mean ADC values from Warthin tumors (0.89⫻ 10⫺3mm2/s⫾0.16⫻10⫺3mm2/s), as the second most com-mon tumor of parotid glands, were statistically significantly different from those of myoepithelial adenomas, lipomas, and salivary duct carcinomas (P⬍.001, .013, and .037, respec-tively; Fig 3). In contrast, mucoepidermoid carcinomas, acinic cell carcinomas, and basal cell adenocarcinomas were not dif-ferentiable from Warthin tumors on the basis of ADC values solely (P⫽.094, .396, and .604, respectively). The detailed significance levels are given in Table 3.
For the ADC computation, a high correlation was calcu-lated between the 2 observers, with an intraclass correlation coefficient of 0.98 (P⬍.001).
Discussion
We investigated the potential of epiDWI in differentiating var-ious entities of parotid gland tumors. Our results demonstrate that there is not only an overlap within the group of benign and malignant primary tumors of the parotid gland but also an overlap between benign and malignant tumors.
These results are in slight contrast to other studies dealing with this specific topic.18,19,31,32In a recently published study by Eida et al,1831 consecutive patients with a single tumor in the parotid or submandibular gland were evaluated. The au-thors concluded that ADC may provide preoperative tissue characterization of salivary gland tumors by using different b factors (500 and 1000 s/mm2). In contrast to our study, the predictive ability of the MR imaging criteria based on the ADC levels was assessed by dividing the calculated values in 4 groups (extremely low, low, intermediate, or high). Additionally, ADC levels were calculated from different areas of each tumor. Regarding the areas with extremely high ADCs, the difference between benign and malignant lesions was statistically signif-icant. The authors did not provide absolute ADC values for different entities, even though, by using an alternative evalua-tion method, this study offers very promising results. The ma-jor difficulty of this study might be to implement the method of determining different tumor areas within a single tumor in a clinical routine setting. Parotid glands and, moreover, sub-mandibular glands are small organs; a virtual fragmentation of small lesions within a small organ might allow the application of this evaluation technique only in larger lesions.
A comparable evaluation method was performed by Mat-sushima et al21in 32 patients with salivary gland tumors (17 benign, 15 malignant). Considering different degrees of extra-cellular components, they made comparisons of mean ADC values between benign and malignant tumors and among tu-mors showing different degrees of extracellular components. In contrast to Eida et al,18no significant difference in mean ADC values was found between benign and malignant tumors, and the mean ADC values increased with the degree of extra-cellular components. On the basis of these results, Matsus-hima et al concluded that ADC values alone are not sufficient to differentiate benign from malignant salivary gland tumors. In a study provided by Yoshino et al31(b factors, 0 and 771 s/mm2), the provided ADC value for a pleomorphic adenoma (n⫽1) was 1.99⫻10⫺3mm2/s and for Warthin tumors (n⫽ 2) was 0.89⫻10⫺3mm2/s and thus similar to the values ob-served in our study. In contrast, the ADC value for an acinic cell carcinoma was much higher (1.38 –2.11⫻10⫺3mm2/s). This remarkable difference regarding ADC values of acinic cell carcinomas might be explained by the fact that in the single acinic cell carcinoma observed by Yoshino et al, a cystic com-ponent was observed, which might lead to a substantial in-crease of ADC. In our study, all acinic cell carcinomas (n⫽10) presented as solid tumors. However, this study was not fo-cused on tumors (n⫽5) and might be, therefore, categorized as preliminary, with regard to this special topic.31
[image:3.594.52.285.70.246.2]In another study, including 45 patients, the drawn conclu-sion was very promising (b factors, 0, 500, and 1000 s/mm2).19 Only an overlap within the malignant tumors was observed and additionally between myoepithelial adenomas (n ⫽ 3) and salivary duct carcinomas (n⫽3). Pleomorphic adenomas were distinguishable from all 6 other examined entities solely Table 1: Histopathologic diagnoses of examined primary salivary
gland tumors
Diagnosis
No. of Lesions
(n⫽136)
Pleomorphic adenoma 43
Warthin tumor 32
Myoepithelial adenoma 6
Lipoma 3
Basal cell adenoma 1
Cystadenoma 1
Inverted ductal papilloma 1
Mucoepidermoid carcinoma 16
Salivary duct carcinoma 11
Acinic cell carcinoma 10
Basal cell adenocarcinoma 9
Adenoid cystic carcinoma 1
Epithelial-myoepithelial carcinoma 1
Carcinoma ex pleomorphic adenoma 1
Table 2: Mean ADC values of all histologically proved entities of parotid gland tumors (nⴝ136)*
Diagnosis
Mean ADC values⫾SD
(95% CI) (⫻10⫺3mm2/s)
Pleomorphic adenoma (n⫽43) 2.09⫾0.16 (2.03–2.14)
Warthin tumor (n⫽32) 0.89⫾0.16 (0.82–0.96)
Myoepithelial adenoma (n⫽6) 1.86⫾0.18 (1.83–1.91)
Lipoma (n⫽3) 0.62⫾0.21 (0.54–0.76)
Basal cell adenoma (n⫽1) 1.23
Cystadenoma (n⫽1) 2.29
Inverted ductal papilloma (n⫽1) 1.99
Mucoepidermoid carcinoma (n⫽16) 1.05⫾0.03 (0.97–1.14) Salivary duct carcinoma (n⫽11) 1.10⫾0.09 (0.89–1.31) Acinic cell carcinoma (n⫽10) 0.79⫾0.33 (0.68–0.88) Basal cell adenocarcinoma (n⫽9) 0.96⫾0.29 (0.71–1.12)
Adenoid cystic carcinoma (n⫽1) 0.87
Epithelial-myoepithelial carcinoma (n⫽1) 0.92 Carcinoma ex pleomorphic adenoma (n⫽1) 1.14
[image:3.594.54.285.272.435.2]on the basis of the calculated ADC values. In our study, pleo-morphic adenomas were also distinguishable from all other entities, except for myoepithelial adenomas. This drawback focused on pleomorphic adenoma could be considered insig-nificant because both lesions were benign. From the point of view of a head and neck surgeon, this disadvantage has a higher impact, caused by the fact that pleomorphic adenomas have a risk of malignant transformation (carcinoma ex pleo-morphic adenoma) and the surgical approach has to be much more aggressive due to the high risk of recurrence (eg, lateral or complete parotid resection) with a higher risk of facial nerve injury.35Otherwise, myoepithelial adenomas have an explic-itly lower risk of malignant transformation or recurrences and can, therefore, be resected more conservatively.36
Warthin tumors, as the second most common benign tu-mors of parotid glands, are treated much more conservatively than pleomorphic adenomas and, of course, all malignant le-sions.6,37A Warthin tumor treated by enucleation has an
ex-pected recurrence rate of only 2%.6Therefore, differentiation from malignant lesions would be very helpful with respect to the surgical approach. In our study, the ADC value for War-thin tumors was 0.89⫻10⫺3mm2/s⫾0.16 10⫺3mm2/s. This ADC value is very close to that in all other studies dealing with this topic, ranging from 0.72⫻10⫺3mm2/s to 0.96⫻10⫺3 mm2/s.19,31,38Focused on Warthin tumors, Ikeda et al38 cal-culated the average ADC value of Warthin tumors (0.96⫻ 10⫺3mm2/s;n⫽19) to be significantly lower than that in all included malignant lesions (1.19 ⫻10⫺3 mm2/s; n ⫽17). However, the ADC values for Warthin tumors ranged from 0.72⫻10⫺3mm2/s to 1.17⫻10⫺3mm2/s, showing an overlap with examined malignant lesions (0.79 ⫻ 10⫺3 mm2/s to 1.65⫻10⫺3mm2/s). These results strongly support our find-ings, proving a limited value of ADC-based tumor differenti-ation focused on Warthin tumors in an individual case.
To a certain extent, epiDWI seems to have the potential to differentiate primary parotid gland lesions. However, this di-Fig 1.The boxplots demonstrate the mean value, 95% confidence interval (CI), and minimum and maximum values for each tumor entity with a number of patients⬎1. The central line of each boxplot indicates the mean value, whereas the range of the box displays the 95% CI. The whiskers represent the minimal and maximal values (unit of the vertical axis:⫻10⫺3
mm2
/s).
Fig 2.A, Transverse T1-weighted spin-echo MR image (TR, 500 ms; TE, 14 ms) from a 69-year-old male patient with a histologically proved pleomorphic adenoma within the right parotid gland (arrow). The mass shows muscle-isointense signal intensity.B, The corresponding T2-weighted 3D true FISP (TR, 700 ms; TE, 2.29 ms) image has a bright lesion within the right parotid gland (arrow).C, The corresponding ADC map shows an easily detectable bright signal intensity of the lesion (mean ADC value: 2.14⫻10⫺3
mm2
[image:4.594.52.532.51.250.2] [image:4.594.54.535.295.473.2]agnostic approach has to be reviewed very carefully. A larger number of observed lesions will provide more different logic subtypes when dealing with organs offering a wide histo-logic variety of primary tumors. Most likely, this fact will lead to restrictions dealing with this technique. The presented study offers the largest number of primary parotid gland tu-mors and different histologic subtypes within the literature and, in contrast to most other studies, an overlap regarding the ADC values from Warthin tumors and 3 different malig-nant subtypes of parotid gland lesions. With regard to our results, the conclusions given in the literature should be rela-tivized. In a recent published study by Prades et al,26the of-fered results for determining whether a tumor is benign or malignant on the basis of the morphologic appearance are very promising and might be improved by combining mor-phologic features and DWIs in a diagnostic noninvasive ap-proach.39This is especially promising with regard to the dif-ferentiation of pleomorphic adenomas, which were diagnosed with an accuracy of 83%, and Warthin tumors, which were diagnosed with an accuracy of 85%, on the basis of the mor-phologic appearance.26
The main limitation of our study is that not every examined tumor subgroup was available in a satisfying number of pa-tients; therefore, the ADC values might vary after including more patients for every subgroup. Furthermore, the number of malignancies is still very limited (n⫽49). However, salivary gland tumors are rare, and to our knowledge, our study pro-vides the largest number of patients with parotid gland tumors examined with epiDWI within the literature.
Conclusions
epiDWI has the potential to differentiate pleomorphic ade-noma and myoepithelial adeade-nomas from all other examined entities. Due to an overlap not only within the group of benign and malignant lesions but also an overlap between these groups, diagnoses should not be addressed on the basis of ADC values solely. Therefore, further studies combining DWI, morphologic criteria, and probably other MR imaging techniques seem to be warranted.
References
1. Seifert G.Histoligical Typing of Salivary Gland Tumors.2nd ed Berlin, Germany: Springer-Verlag; 1991:24 –54
2. Scianna JM, Petruzzelli GJ.Contemporary management of tumors of the sali-vary glands.Curr Oncol Rep2007;9:134 –38
3. Swoboda H, Franz P.Salivary gland tumors: clinical aspects and therapy[in German].Radiologe1994;34:232–38
4. Donovan DT, Conley JJ.Capsular significance in parotid tumor surgery: real-ity and myths of lateral lobectomy.Laryngoscope1984;94:324 –29
5. Dykun RJ, Deitel M, Borowy ZJ, et al.Treatment of parotid neoplasms.Can J Surg1980;23:14 –19
6. Heller KS, Attie JN.Treatment of Warthin’s tumor by enucleation.Am J Surg
1988;156:294 –96
7. Patey DH.Current state of surgery of the salivary glands: a critical review[in Italian].Recenti Prog Med1969;46:578 –99
8. Witt RL.The significance of the margin in parotid surgery for pleomorphic adenoma.Laryngoscope2002;112:2141–54
9. Boccato P, Altavilla G, Blandamura S.Fine-needle aspiration biopsy of salivary gland lesions: a reappraisal of pitfalls and problems.Acta Cytol1998;42: 888 –98
10. Elagoz S, Gulluoglu M, Yilmazbayhan D, et al.The value of fine-needle aspira-tion cytology in salivary gland lesions, 1994 –2004.ORL J Otorhinolaryngol Relat Spec2007;69:51–56
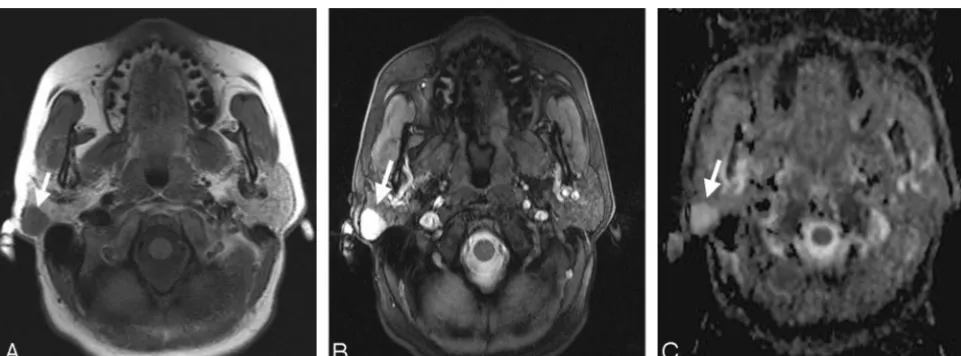
[image:5.594.56.535.42.194.2]11. Ivanova S, Slobodnikova J, Janska E, et al.Fine needle aspiration biopsy in a Fig 3.A, Transverse T1-weighted spin-echo MR image (TR, 500 ms; TE, 14 ms) from a 49-year-old female patient with a histologically proved Warthin tumor in the left parotid gland (arrow). B, The T2-weighted image (3D true FISP; TR, 700 ms; TE, 2.29 ms) also shows a bright signal intensity of the lesion (arrow) with a lesser extent but appearance similar to that of the pleomorphic adenoma in Fig 2B.C, On the basis of ADC maps, the difference between the pleomorphic adenoma in Fig 2Cand the Warthin tumor shown (arrow) becomes obvious (mean ADC value: 0.85⫻10⫺3mm2/s).
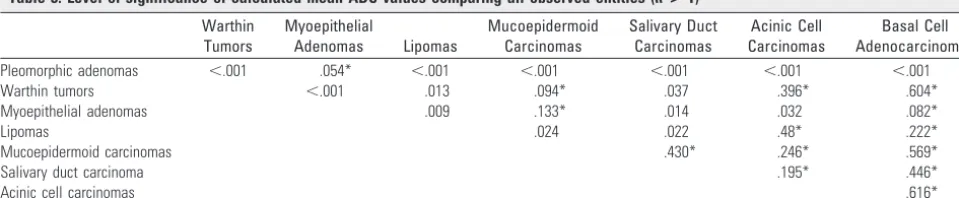
Table 3: Level of significance of calculated mean ADC values comparing all observed entities (n>1) Warthin
Tumors
Myoepithelial
Adenomas Lipomas
Mucoepidermoid Carcinomas
Salivary Duct Carcinomas
Acinic Cell Carcinomas
Basal Cell Adenocarcinomas
Pleomorphic adenomas ⬍.001 .054* ⬍.001 ⬍.001 ⬍.001 ⬍.001 ⬍.001
Warthin tumors ⬍.001 .013 .094* .037 .396* .604*
Myoepithelial adenomas .009 .133* .014 .032 .082*
Lipomas .024 .022 .48* .222*
Mucoepidermoid carcinomas .430* .246* .569*
Salivary duct carcinoma .195* .446*
Acinic cell carcinomas .616*
[image:5.594.54.534.261.360.2]diagnostic workup algorithm of salivary gland tumors.Neoplasma2003;50: 144 – 47
12. Mihashi H, Kawahara A, Kage M, et al.Comparison of preoperative fine-needle aspiration cytology diagnosis and histopathological diagnosis of salivary gland tumors.Kurume Med J2006;53:23–27
13. Wong DS, Li GK.The role of fine-needle aspiration cytology in the manage-ment of parotid tumors: a critical clinical appraisal.Head Neck2000;22: 469 –73
14. Das DK, Petkar MA, Al-Mane NM, et al.Role of fine needle aspiration cytology in the diagnosis of swellings in the salivary gland regions: a study of 712 cases.
Med Princ Pract2004;13:95–106
15. Behzatoglu K, Bahadir B, Kaplan HH, et al.Fine needle aspiration biopsy of the parotid gland: diagnostic problems and 2 uncommon cases.Acta Cytol
2004;48:149 –54
16. Donath K, Seifert G.Tumour-simulating squamous cell metaplasia (SCM) in necrotic areas of salivary gland tumours.Pathol Res Pract1997;193:689 –93 17. Eida S, Ohki M, Sumi M, et al.MR factor analysis: improved technology for the
assessment of 2D dynamic structures of benign and malignant salivary gland tumors.J Magn Reson Imaging2008;27:1256 – 62
18. Eida S, Sumi M, Sakihama N, et al.Apparent diffusion coefficient mapping of salivary gland tumors: prediction of the benignancy and malignancy.AJNR Am J Neuroradiol2007;28:116 –21
19. Habermann CR, Gossrau P, Graessner J, et al.Diffusion-weighted echo-planar MRI: a valuable tool for differentiating primary parotid gland tumors?Rofo
2005;177:940 – 45
20. Mascaro L, Ferrari C, Grazioli L, et al.T2 relaxation of the parotid gland of patients affected by pleomorphic adenoma.Magn Reson Imaging1999;17: 723–30
21. Matsushima N, Maeda M, Takamura M, et al.Apparent diffusion coefficients of benign and malignant salivary gland tumors: comparison to histopatho-logical findings.J Neuroradiol2007;34:183– 89
22. Minami M, Tanioka H, Oyama K, et al.Warthin tumor of the parotid gland: MR-pathologic correlation.AJNR Am J Neuroradiol1993;14:209 –14 23. Motoori K, Iida Y, Nagai Y, et al.MR imaging of salivary duct carcinoma.AJNR
Am J Neuroradiol2005;26:1201– 06
24. Motoori K, Ueda T, Uchida Y, et al.Identification of Warthin tumor: magnetic resonance imaging versus salivary scintigraphy with technetium-99m per-technetate.J Comput Assist Tomogr2005;29:506 –12
25. Okahara M, Kiyosue H, Hori Y, et al.Parotid tumors: MR imaging with patho-logical correlation.Eur Radiol2003;13(suppl 4):L25–33
26. Prades JM, Oletski A, Faye MB, et al.Parotid gland masses: diagnostic value of MR imaging with histopathologic correlations[in French]. Morphologie
2007;91:44 –51
27. Sakamoto M, Sasano T, Higano S, et al.Usefulness of heavily T(2) weighted magnetic resonance images for the differential diagnosis of parotid tumours.
Dentomaxillofac Radiol2003;32:295–99
28. Takashima S, Noguchi Y, Okumura T, et al.Dynamic MR imaging in the head and neck.Radiology1993;189:813–21
29. Takashima S, Wang J, Takayama F, et al.Parotid masses: prediction of malig-nancy using magnetization transfer and MR imaging findings.AJR Am J Roentgenol2001;176:1577– 84
30. Yabuuchi H, Fukuya T, Tajima T, et al.Salivary gland tumors: diagnostic value of gadolinium-enhanced dynamic MR imaging with histopathologic correla-tion.Radiology2003;226:345–54
31. Yoshino N, Yamada I, Ohbayashi N, et al.Salivary glands and lesions: evalua-tion of apparent diffusion coefficients with split-echo diffusion-weighted MR imaging—initial results.Radiology2001;221:837– 42
32. Motoori K, Yamamoto S, Ueda T, et al.Inter- and intratumoral variability in magnetic resonance imaging of pleomorphic adenoma: an attempt to inter-pret the variable magnetic resonance findings.J Comput Assist Tomogr
2004;28:233– 46
33. Thoeny HC, De Keyzer F, Claus FG, et al.Gustatory stimulation changes the apparent diffusion coefficient of salivary glands: initial experience.Radiology
2005;235:629 –34
34. Le Bihan D, Breton E, Lallemand D, et al.Separation of diffusion and perfusion in intravoxel incoherent motion MR imaging.Radiology1988;168:497–505 35. Matsuura H.Surgery for pleomorphic adenoma of the parotid gland evaluated
by long term follow-up[in Japanese].Nippon Geka Gakkai Zasshi1989;90: 1386 – 88
36. Sciubba JJ, Brannon RB.Myoepithelioma of salivary glands: report of 23 cases.
Cancer1982;49:562–72
37. Batori M, Mariotta G, Giovannone G, et al.Warthin’s tumor of parotid gland: treatment of a retroneural lesion by enucleation.Eur Rev Med Pharmacol Sci
2002;6:105–11
38. Ikeda M, Motoori K, Hanazawa T, et al.Warthin tumor of the parotid gland: diagnostic value of MR imaging with histopathologic correlation.AJNR Am J Neuroradiol2004;25:1256 – 62