ISSN Online: 2165-3860 ISSN Print: 2165-3852
DOI: 10.4236/ojfd.2017.74032 Nov. 24, 2017 475 Open Journal of Fluid Dynamics
Decisive Parameters for Backwater Effects
Caused by Floating Debris Jams
Arnd Hartlieb
Laboratory of Hydraulic and Water Resources Engineering, Technical University of Munich, Obernach, Germany
Abstract
The dimensional analysis of the backwater effect caused by debris jams results in the Froude number of the approach flow in the initial situation prior to de-bris jam formation and the dede-bris density as decisive parameters. For the more precise detection of the influence of both parameters the results of dif-ferent hydraulic model test series at the Laboratory of Hydraulic and Water Resources Engineering of the Technical University of Munich concerning de-bris jams at spillways as well as at racks for the retention of wooden dede-bris were uniformly evaluated. On the one hand a significant increase of the backwater effect with a rising Froude number of the approach flow could be shown. This is in good correlation to recent test results for debris jams at re-tention racks at the Laboratory of Hydraulics, Hydrology and Glaciology of the Swiss Federal Institute of Technology Zurich. On the other hand a signifi-cant increase of the backwater effect could also be shown for a rising debris density. However, the test results also show that significantly different back-water effects can occur in different test runs with identical test conditions. These differences are a result of the randomness of debris jam development, and therefore, a more exact quantification of the dependence of the backwater effect on the Froude number of the approach flow and on the debris density is not considered useful for the present results.
Keywords
Hydraulic Engineering, Natural Hazards, Floating Debris Jams, Large-Scale Hydraulic Model Tests
1. Introduction
The previous research in the area of floating debris jams focused on the follow-ing issues:
How to cite this paper: Hartlieb, A. (2017) Decisive Parameters for Backwater Effects Caused by Floating Debris Jams. Open Journal of Fluid Dynamics, 7, 475-484.
https://doi.org/10.4236/ojfd.2017.74032
Received: October 18, 2017 Accepted: November 21, 2017 Published: November 24, 2017 Copyright © 2017 by author and Scientific Research Publishing Inc. This work is licensed under the Creative Commons Attribution International License (CC BY 4.0).
http://creativecommons.org/licenses/by/4.0/
DOI: 10.4236/ojfd.2017.74032 476 Open Journal of Fluid Dynamics
- Floating debris jams at natural obstacles in rivers ([1][2][3]),
- The influence of different layouts of wooden debris retention racks on the resulting jams ([4][5][6][7]),
- The probability of debris jams at bridges ([8] [9]) and spillways ([10] [11] [12][13]).
Only little research exists in the area of the consequences of floating debris jams at spillways and wooden debris retention racks, in particular the resulting backwater effect, which is the focus of this paper.
The approach of this study envisaged a dimensional analysis of the backwater effect caused by floating debris jams. For the detected parameters, the Froude number of the approach flow and the debris density, the results of different hy-draulic model test series concerning debris jams at spillways as well as at racks for the retention of wooden debris were uniformly evaluated.
2. Dimensional Analysis
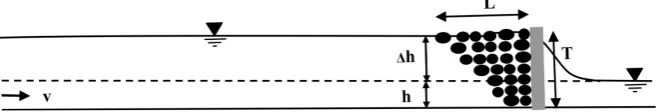
The backwater effect caused by floating debris jams directly depends on the de-velopment and shape of the jam. The dimensional analysis of the dede-velopment and shape of debris jams as well as the resulting backwater effect can be per-formed with only one characteristic parameter ([14] [15]). The characteristic parameter selected in this study is the so-called debris jam compactness. The debris jam compactness is the ratio of height T to length L of the debris jam; i.e. compactness is T/L. T and L are illustrated in the example of a debris jam at a spillway bay in Figure 1 and at a debris retention rack in Figure 2.
[image:2.595.231.517.449.604.2]A number of different variables likely have an influence on the debris jam
Figure 1. Longitudinal section in flow direction of a spillway bay with a de-bris jam.
[image:2.595.210.539.650.706.2]DOI: 10.4236/ojfd.2017.74032 477 Open Journal of Fluid Dynamics
compactness T/L. First, a higher approach flow velocity v in the initial situation prior to debris jam formation probably leads to a higher compactness. Different overflow heights or flow depths h should also affect compactness. Gravitational acceleration g together with the densities of the debris ρD and water ρW can cause
some logs to plunge below others floating on the water surface. The compactness
T/L of debris jams is thus regarded as a function of v, g, h, ρD and ρW.
Specifical-ly, it will be treated as a product of a proportionality constant CT/L and of v, g, h,
ρD and ρW with the different exponents a, b, c, d and e:
(
, , , ,)
a b c d eD W T L D W
T L= f v g h
ρ ρ
=C ⋅ ⋅v g ⋅ ⋅hρ ρ
⋅ (1)The dimensions matrix AT/L in the mass[m]-length[l]-time[t]-system takes the
following form:
0 0 0 1 1
1 1 1 3 3
1 2 0 0 0
D W
T L
v g h
m A l t ρ ρ = − − − − (2)
Because the compactness T/L is dimensionless, solving the dimensions equa-tions of the mass, the length and the time leads to the following:
[ ]
m : 0= + ⇒ = −d e e d (3)[ ]
l : 0= + + − ⋅ − ⋅ ⇒ = − − = −a b c 3 d 3 e c a b 0.5⋅a (4)[ ]
t : 0= − − ⋅ ⇒ = −a 2 b b 0.5⋅a (5)(
)
(
)
(
)
0.5 0.5
0.5
0
a b c d e a a a d d
T L D W T L D W
a
d a d
T L D W T L D W
T L C v g h C v g h
C v g h C F
ρ ρ ρ ρ
ρ ρ ρ ρ
− − −
⇒ = ⋅ ⋅ ⋅ ⋅ ⋅ = ⋅ ⋅ ⋅ ⋅ ⋅
= ⋅ ⋅ ⋅ = ⋅ ⋅ (6)
The compactness of the debris jam T/L is a product of the proportionality constant CT/L, the Froude number F0 of the approach flow prior to debris jam
formation with the unknown exponent a and of the density ratio of debris and water ρD/ρW (relative debris density) with the unknown exponent d. This same
fundamental dependence is found for the dimensionless parameter relative backwater effect Δh/h caused by a debris jam, however with different number values for CT/L, a and d.
3. Large-Scale Hydraulic Model Tests
It was the aim to detect the influence of the Froude number F0 and the relative
debris density ρD/ρW on the backwater effect Δh/h caused by debris jams at
DOI: 10.4236/ojfd.2017.74032 478 Open Journal of Fluid Dynamics
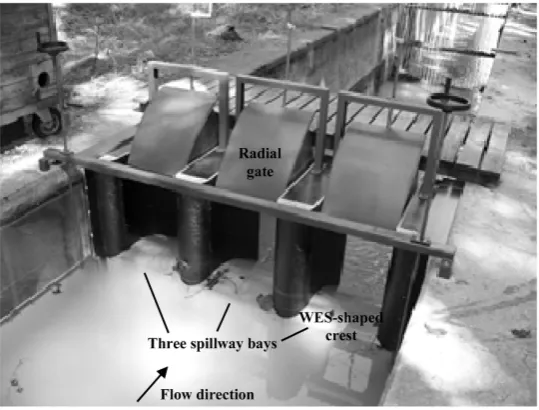
Figure 3. Model of the three-bay spillway intake structure in the rectan-gular canal.
with a width W = 50 cm, WES-shaped crests and radial gates. The gates were fully opened during the described tests and without any influence on the jam process. The standardised dimensions of the model intake structure were repre-sentative for many existing structures. With regard to the debris, 100-logs sets with the distribution of the log length lL shown in Table 1 and model log
diame-ters dL between 2 cm and 4 cm were used. The logs had no or only a few
branches. Describing the procedure of a single test an initial steady-state flow condition without a debris jam was established in the canal first. Then groups of five logs were added to the flow upstream of the spillway intake structure until all three bays were blocked and all remaining logs of the set were added to the flow. The geometric development of the debris jam finally consisting of the total log set was observed. After reaching a new steady-state flow condition, the up-stream water level was measured and the relative backwater effect Δh/h was de-rived as the main result.
4. Froude Number F
0of the Approach Flow
4.1. Debris Jams at Spillways
The test results were evaluated with the focus on the influence of the Froude number F0 of the approach flow prior to debris jam formation on the relative
backwater effect Δh/h. For this evaluation only the results of tests with natural debris and a mean relative debris density of ρD/ρW = 0.8 were used. For higher
Froude numbers F0 > 0.30, multi-layer debris bodies with high compactness T/L
(see Figure 4) and high relative backwater effects Δh/h > 12% (see Figure 5) were formed. For lower Froude numbers F0 < 0.15, loose single-layer floating
DOI: 10.4236/ojfd.2017.74032 479 Open Journal of Fluid Dynamics
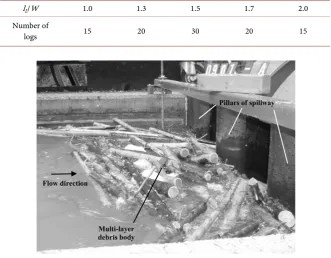
Table 1. Distribution of the log length lL in the 100-logs sets.
lL/W 1.0 1.3 1.5 1.7 2.0
Number of
[image:5.595.245.503.388.564.2]logs 15 20 30 20 15
Figure 4. Multi-layer debris body with high compactness for F0 = 0.35 and Δh/h = 15.2%.
Figure 5. Relative backwater effect Δh/h vs. Froude number F0 of the approach flow in a hydraulic model test series concerning debris jams at a spillway with identical debris mix (natural debris with
ρD/ρW = 0.8).
determined for the same 100-logs set of debris. From these results, it can be de-duced that the relative backwater effect Δh/h increases with rising Froude num-ber F0 of the approach flow. This means that the exponent a in (6) is positive.
There-DOI: 10.4236/ojfd.2017.74032 480 Open Journal of Fluid Dynamics
fore, a more exact quantification of the dependence of the backwater effect on the Froude number of the approach flow in the form of the exponent a in (6) is not considered useful for the present results. The randomness of the debris jam development might possibly be eliminated from the test results if the shapes of the debris jams are default in further test series.
4.2. Debris Jams at Retention Racks
Knauss has performed fundamental tests for debris jams at retention racks with different layouts of vertical pillars [4]. A new evaluation of his test results for a V-shaped rack shows a significant increase of the relative backwater effect Δh/h
with rising initial Froude number F0 of the approach flow (see Figure 6). For the
lowest tested Froude number F0 = 1.61 a relative backwater effect Δh/h = 220%
was determined. And the highest Froude number F0 = 2.45 caused a relative
backwater effect Δh/h = 430%. For comparison, the correlations derived from the test results of Weitbrecht and Schmocker [5] as well as of Schmocker and Hager [6] are included in Figure 6. These two studies tested retention racks with a layout of the pillars vertical to the flow direction (90˚) and lower Froude num-bers of the approach flow. As far as it is verifiable, comparable debris mixes were used in the three different test series.
Two value pairs for F0 and Δh/h can be adopted from Weitbrecht and
Schmocker [5]. Based on several test results from Schmocker and Hager [6], there is a linear correlation between the relative backwater effect and the Froude number of the approach flow for 0.5 < F0 < 1.5. Schmocker and Hager repeated
[image:6.595.229.515.481.681.2]each test with identical conditions twice and obtained clearly divergent backwa-ter effects due to the randomness of the debris jam development, too. By the calculation of the mean values of the backwater effect for each Froude number
DOI: 10.4236/ojfd.2017.74032 481 Open Journal of Fluid Dynamics
they derived the linear correlation. This could rather be seen critically, because the possible strong variation of the backwater effect for identical conditions is lost in the consideration. Using the parameters defined in this paper, the equa-tion of Schmocker and Hager [6] for the dependence of the relative backwater effect Δh/h on the Froude number F0 is:
(
∆ +h h h)
=1.4 1.9+ ⋅F0 or ∆h h=0.4 1.9+ ⋅F0(7)
The quantity of the increase of the relative backwater effect Δh/h with the ris-ing Froude number F0 lies in a comparable range in all test series. If the linear
correlation of Schmocker und Hager [6] is extrapolated on higher Froude num-bers, the relative backwater effect would be significantly larger than for the test series of Knauss [4]. However, this in fact corresponds with the fundamental finding of Knauss [4], debris jams at V-shaped racks cause smaller backwater ef-fects than at 90˚-racks.
5. Relative Debris Density
ρ
D/
ρ
WIn the hydraulic model tests concerning debris jams at spillways the relative de-bris density ρD/ρW was varied for a more precise detection of its influence on the
relative backwater effect Δh/h. To avoid density fluctuations which occur in natural wood due to shrinkage and expansion, artificial 100-logs sets with four different densities (ρD/ρW = 0.8; 0.9; 0.95 and 0.975) were used. Aside from these
density variations, the debris mixes were identical. The quantitative influence of the debris density on the development of the jam and on the backwater effect is comparable to the Froude number of the approach flow. With a rising relative debris density ρD/ρW the debris jams became more compact and the relative
backwater effect Δh/h increased. This means that the exponent d in (6) is posi-tive. Figure 7 shows a loose, single-layer floating carpet for ρD/ρW = 0.8 (left) and
a compact multi-layer debris body for ρD/ρW = 0.975 (right). In both cases the
Froude number was F0 = 0.08. The steel grid in front of the spillway visible in
Figure 7 was required to prevent some logs of the artificial mix from passing over the spillway.
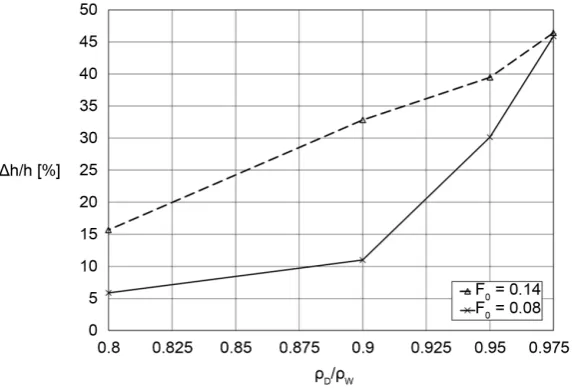
Figure 8 shows the measured value pairs of the relative debris density ρD/ρW
and the relative backwater effect Δh/h for two different Froude numbers of the approach flow. For F0 = 0.08, the relative backwater effect increases from Δh/h =
5.9% for the smallest relative debris density ρD/ρW = 0.8 up to Δh/h = 45.9% for
the largest relative debris density ρD/ρW = 0.975. For the higher Froude number
F0 = 0.14, the respective values of the relative backwater effect are larger, which
corresponds with the findings described in 4.1. In this test series, the relative backwater effect increases from Δh/h = 15.7% for ρD/ρW = 0.8 up to Δh/h =
46.4% for ρD/ρW = 0.975.
DOI: 10.4236/ojfd.2017.74032 482 Open Journal of Fluid Dynamics
Figure 7. Loose, single-layer floating carpet with low compactness for ρD/ρW = 0.8 and Δh/h = 5.9% (left) and multi-layer debris body with high compactness for ρD/ρW = 0.975 and Δh/h = 45.9% (right).
Figure 8. Relative backwater effect Δh/h vs. relative debris density ρD/ρW in systematic hydraulic model test series concerning debris jams at spillways.
for the present test results. The reason is the randomness of the debris jam de-velopment which might possibly be eliminated from the test results if the shapes of the debris jams are default in further test series.
6. Conclusion
[image:8.595.231.518.253.448.2]DOI: 10.4236/ojfd.2017.74032 483 Open Journal of Fluid Dynamics
Acknowledgements
The hydraulic model tests concerning debris jams at spillways performed in the course of this research were funded by the Swedish company ELFORSK AB. Many thanks for the support and cooperation.
References
[1] Bocchiola, D., Rulli, M.C. and Rosso, R. (2006) Transport of Large Woody Debris in the Presence of Obstacles. Geomorphology, 76, 166-178.
https://doi.org/10.1016/j.geomorph.2005.08.016
[2] Bocchiola, D., Rulli, M.C. and Rosso, R. (2008) A Flume Experiment on the Forma-tion of Wood Jams in Rivers. Water Resources Research, 44, W02408.
https://doi.org/10.1029/2006WR005846
[3] Haga, H., Kumagai, T., Otsuki, K. and Ogawa, S. (2002) Transport and Retention of Coarse Woody Debris in Mountain Streams: An In Situ Field Experiment of Log Transport and Field Survey of Coarse Woody Debris Distribution. Water Resources Research, 38, 1029-1044.https://doi.org/10.1029/2001WR001123
[4] Knauss, J. (1995) Treibholzfänge am Lainbach in Benediktbeuern und am Arzbach (ein neues Element im Wildbachausbau). [Retention Racks for Wooden Debris at two Torrents in the Bavarian Alps (a New Protection Measure for Torrent Con-trol).] Berichte des Lehrstuhls und der Versuchsanstalt für Wasserbau und Wasser-wirtschaft der Technischen Universität München, Nr. 76, 23-66.
[5] Weitbrecht, V. and Schmocker, L. (2012) Driftwood Retention in Large Rivers—A New Concept. Proceedings of River Flow 2012 CostaRica, San Jose, 9-12 Septem-ber, Taylor & Francis Group, London, 1073-1080.
[6] Schmocker, L. and Hager, W.H. (2013) Scale Modeling of Wooden Debris Accu-mulation at a Debris Rack. Journal of Hydraulic Engineering, 139, 827-836.
https://doi.org/10.1061/(ASCE)HY.1943-7900.0000714
[7] Simonett, S., Detert, M. and Weitbrecht, V. (2012) Drift Wood Retention to Mi-nimize Flood Risk for the City of Zurich—Physical Experiments. Proceedings of
12thcongressINTERPRAEVENT 2012, Grenoble, France,23-26 April, 803-810. [8] Diehl, T.H. (1997) Potential Drift Accumulation at Bridges, Report FHWA-
RD-97-028, U.S. Department of Transportation, Federal Highway Administration, Washington DC.
[9] Schmocker, L. and Hager, W.H. (2011) Probability of Drift Blockage at Bridge Decks. Journal of Hydraulic Engineering, 137, 470-479.
https://doi.org/10.1061/(ASCE)HY.1943-7900.0000319
[10] Godtland, K. and Tesaker, E. (1994) Clogging of Spillways by Trash. Proceedings of
18thICOLDCongress, Q.68-R.36, Durban, South Africa,7-11 November, 543-557. [11] Johansson, N. and Cederström, M. (1995) Floating Debris and Spillways. ,
Proceed-ings Published by ASCE (Reprinted fromWATERPOWER 95), 2106-2115, Pro-ceedings of the International Conference on Hydropower, San Francisco, USA, 25-28 July 1995.
[12] Lariviere, R., Leger, P., Tinawi, R. and Roussel, M. (1997) Safety of Gravity Dams and Spillways against Floods. Session 1: The Saguenay Floods, 1.1-1.14, Proceedings of the 9th Canadian Dam Safety Conference, 1.17-1.30, Montreal, Canada, 22-25 September.
DOI: 10.4236/ojfd.2017.74032 484 Open Journal of Fluid Dynamics
Debris for Safe Spillway Discharge of Extreme Floods—Laboratory Investigations.
Proceedings of 23rd ICOLD Congress, Q.91-R.4, Brasilia,Brazil, 25-29 May 2009. [14] Hartlieb, A. (2014) Maßgebende Parameter für den Aufstau durch
Schwemmholz-verklausungen, Internationales Symposium. [Decisive Parameters for Backwater Effects caused by Floating Debris Jams.] Wasser- und Flussbau im Alpenraum, 25.-27. Juni 2014, Zürich, Mitteilungen der Versuchsanstalt für Wasserbau, Hydro-logie und GlazioHydro-logie der ETH Zürich, Nr. 228, Band 2, 485-493.
[15] Hartlieb, A. (2015) Schwemmholz in Fließgewässern - Gefahren und Lösungsmöglichkeiten. [Wooden Debris in Rivers - Hazards and Solutions.] Be-richte des Lehrstuhls und der Versuchsanstalt für Wasserbau und Wasserwirtschaft der Technischen Universität München, Nr. 133.
[16] Hartlieb, A. (2012) Large Scale Hydraulic Model Tests for Floating Debris Jams at Spillways. Proceedings on USB-Stick, C18, Proceedings of the 2ndIAHR Europe Congress “Water Infinitely Deformable But Still Limited”, 27th-29th of June 2012, Munich.
Notation
The following symbols are used in this paper:
a = exponent
AT/L = dimensions matrix
b = exponent
c = exponent
CT/L = proportionality constant
d = exponent
dL = log diameter
e = exponent
F0 = Froude number of the approach flow prior to debris jam formation
g = gravitational acceleration
h = flow height or flow depth
l = length
lL = log length
L = length of the debris jam
m = mass
t = time
T = height of the debris jam
T/L = debris jam compactness
v = approach flow velocity prior to debris jam formation
W = width of spillway bay Δh/h= relative backwater effect
ρD = density of the debris
ρD/ρW= relative debris density