PHYSICS REVIEW
Diffusion Tensor MR Imaging and Fiber
Tractography: Theoretic Underpinnings
P. Mukherjee J.I. Berman S.W. Chung C.P. Hess R.G. Henry
SUMMARY:In this article, the underlying theory of clinical diffusion MR imaging, including diffusion tensor imaging (DTI) and fiber tractography, is reviewed. First, a brief explanation of the basic physics of diffusion-weighted imaging (DWI) and apparent diffusion coefficient (ADC) mapping is provided. This is followed by an overview of the additional information that can be derived from the diffusion tensor, including diffusion anisotropy, color-encoded fiber orientation maps, and 3D fiber tractography. This article provides the requisite background for the second article in this 2-part review to appear next month, which covers the major technical factors that affect image quality in diffusion MR imaging, including the acquisition sequence, magnet field strength, gradient amplitude and slew rate, and multichannel radio-frequency coils and parallel imaging. The emphasis is on optimizing these factors for state-of-the-art DWI and DTI based on the best available evidence in the literature.
D
iffusion MR imaging of the brain was first adopted for use in clinical neuroradiology during the early 1990s and was found to have immediate utility for the evaluation of sus-pected acute ischemic stroke. Since that time, enormous strides forward in the technology of diffusion imaging have greatly improved image quality and enabled many new clinical applications. These include the diagnosis of intracranial pyo-genic infections, masses, trauma, and vasopyo-genic-versus-cyto- vasogenic-versus-cyto-toxic edema. Furthermore, the advent of diffusion tensor im-aging (DTI) and fiber tractography has opened an entirely new noninvasive window on the white matter connectivity of the human brain. DTI and fiber tractography have already ad-vanced the scientific understanding of many neurologic and psychiatric disorders and have been applied clinically for the presurgical mapping of eloquent white matter tracts before intracranial mass resections.This 2-part review explores the current state of the art for the acquisition and analysis of clinical diffusion imaging, in-cluding DTI and fiber tractography. This first article begins with an explanation of the basic physics and underlying theory of diffusion-weighted imaging (DWI) and apparent diffusion coefficient (ADC) mapping. This is followed by an overview of the additional information that can be derived from the diffu-sion tensor, including diffudiffu-sion anisotropy, color-encoded fi-ber-orientation maps, and 3D fiber tractography. This article provides the necessary background for the second article, which focuses on the major technical factors that affect image quality in diffusion imaging, with an emphasis on optimizing these factors for state-of-the-art DWI and DTI based on the best available evidence in the literature.
Theoretic Underpinnings of Diffusion Imaging
Brownian Motion and Tissue Ultrastructure
Diffusion, also known as “Brownian motion,” refers to con-stant random microscopic molecular motion due to heat. At a fixed temperature, the rate of diffusion can be described by the
Einstein equation1:
1) ⬍r2⬎ ⫽6Dt,
where⬍r2⬎refers to the mean squared displacement of the
molecules, t is the diffusion time, and D is the diffusion con-stant, a constant of proportionality for the particular sub-stance being measured. In clinical diffusion imaging, the type of diffusion being investigated is water self-diffusion, meaning the thermal motion of water molecules in a medium that itself consists mostly of water.2-5The diffusion constant, typically
expressed in units of square millimeters per second, relates the average displacement of a molecule over an area to the obser-vation time, with higher values of this constant indicating more mobile water molecules. The ADC is the diffusion con-stant measured in the clinical setting, reflecting the limitation that in vivo diffusion cannot be separated from other sources of water mobility, such as active transport, flow along pressure gradients, and changes in membrane permeability.
Imaging molecular water diffusion confers the ability to probe the microstructural properties of biologic tissues. The typical diffusion times used for clinical DWI are 10 –50 ms, corresponding to average molecular displacements on the or-der of 10m. This microscopic spatial scale is in the same range as that of cellular dimensions. This sensitivity to cellular processes has been exploited clinically for improving the de-tection of acute cerebral ischemia,4,6-10distinguishing
vaso-genic from cytotoxic edema,11-16 identifying foci of axonal
shearing injury after acute head trauma,17-19characterizing
cellularity in brain tumors,20-27discriminating between me-tastases and gliomas22,27and between tumor recurrence and
postsurgical injury,28differentiating pyogenic abscesses from
tumors,29-31and for the noninvasive mapping of white matter
connectivity by using the diffusion tensor model,32-36among other applications.
Stejskal-Tanner Diffusion Encoding
A diffusion-weighted pulse sequence is constructed by the ad-dition of a pair of diffusion-sensitizing gradients, also known as motion-probing gradients, to a T2-weighted spin-echo se-quence. The diffusion gradients are applied along the same directional axis both before and after the 180° refocusing pulse (Fig 1). This is known as Stejskal-Tanner diffusion encoding.37
Molecular motion thus results in loss of signal intensity due to incomplete rephasing of water proton spins, which change
From the Department of Radiology, University of California, San Francisco, San Francisco, Calif.
Please address correspondence to Pratik Mukherjee, MD, PhD, Department of Radiology, Box 0628, University of California, San Francisco, 505 Parnassus Ave, L-358, San Francisco, CA 94143-0628; e-mail: pratik@radiology.ucsf.edu
position between and during the applications of the 2 diffu-sion-sensitizing gradients. This diffusion-weighted contrast can be fit to an exponential model:
2) Si⫽S0䡠e⫺b䡠ADCi.
In the above expression, Siis the diffusion-weighted signal intensity observed at a given voxel with the diffusion-sensitiz-ing gradients applied along directioni, S0is the signal intensity
at the same voxel measured without diffusion-sensitizing gra-dients, and ADCiis the ADC in theidirection. Within the exponential term, the b factor is a measure of diffusion-weighting that is a function of the strength, duration, and tem-poral spacing of the diffusion-sensitizing gradients, assuming rectangular gradient pulses:
3) b⫽␥2G2␦2(⌬ ⫺␦/3),
where ␥is a physical constant known as the gyromagnetic ratio, G is the amplitude of the diffusion gradient typically measured in milliteslas per meter,␦is the duration of each diffusion gradient in milliseconds, and⌬is the interval be-tween the onset of the diffusion gradient before the refocusing pulse and that after the refocusing pulse, measured in millisec-onds (Fig 1). The units of b are secmillisec-onds per square millimeter, reciprocal to the units of ADC. It can be seen from equation 2 that raising b increases the degree of diffusion-weighting (ie, the loss of signal intensity Sialong directioniproduced by application of the diffusion gradients). From equation 3, it is apparent that boosting the gradient amplitude G and the gra-dient duration␦are the most effective ways of increasing the diffusion-weighting, due to the quadratic dependence of b on these 2 parameters. Typical values of b used in clinical appli-cations range from 600 to 1500 seconds per square millimeter. The lowest values of b are used for imaging of fetuses in utero or premature neonates, due to the very high ADC values of these structurally immature brains.38,39The highest b factors have been advocated for hyperacute stroke imaging in adults at 1.5T, to maximize sensitivity to the often subtle reductions in ADC in this very early stage of cerebral ischemia,40,41
though a recent 3T study42found no benefit of b⫽1500 s/mm2DWI for stroke detection compared with the
tradi-tional adult b-value of 1000 s/mm2.
Diffusion-Weighted Image Contrast and ADC Calculation
In equation 2, ADCiis the ADC of water along the direction of the diffusion-sensitizing gradient. Higher ADC values, reflect-ing greater rates of water diffusion in the tissue under
investi-gation, result in lower signal intensity Si in the diffusion-weighted image (Fig 2). Conversely, reduced ADC values result in higher observed signal intensity on DWI. The direct calculation of ADC values has assumed considerable clinical importance because of the T2-weighting inherent in the long TE of a DWI pulse sequence:
4) Si⫽k䡠e⫺TE/T2䡠e⫺b䡠ADCi,
where k is a proportionality constant and T2 is the transverse relaxation time of the interrogated tissue. Hence, T2 prolon-gation within pathologic tissues may cause DWI signal hyper-intensity, even in the absence of reduced ADC values. This T2 shinethrough effect renders DWI hyperintensity less specific for clinical diagnosis than decreases of ADC that are con-firmed on an ADC map (Fig 3). Conversely, decreases in T2 may mask a true reduction in ADC values; this phenomenon has been referred to as “T2 blackout”.43T2 blackout may be at least in part responsible for the relatively low sensitivity of DWI signal intensity compared with ADC maps for the detec-tion of acute hypoxic-ischemic injury in neonatal white matter because such lesions typically reduce the very long T2 relax-ation times of white matter in neonates. However, T2 effects can also be beneficial: The “lightbulb” brightness of DWI sig-nal intensity in acute infarcts of the adult brain is caused by the multiplicative effect of T2 prolongation and reduced ADC (equation 4). Therefore, DWI has better sensitivity than ADC maps for small acute ischemic lesions in children beyond in-fancy and in adults.
ADC values may be calculated from DWI by solving for ADC in equation 2:
5) ADCi⫽⫺ln共Si/S0)/b,
where ln is the natural logarithm. The signal intensity S0in the
absence of a diffusion-sensitizing gradient can be derived from an image acquired atb⫽0 s/mm2. In general, ADC maps can
be derived from a set of diffusion-weighted images acquired at a high b factor and a second set of images acquired with a low b factor, which can be zero. This only applies in the range of b-values used clinically, because for b-b-values greatly exceeding 1000 s/mm2, DWI signal intensity S
ino longer conforms to the monoexponential relationship with b described in equation 2.44,45
Another popular way of examining diffusion images with-out the contaminating influence of T2 effects is with an atten-uation coefficient (AC) map, also known as the exponential diffusion-weighted image,46the exponential image, or the
at-tenuation factor map (Fig 2). The AC map can be computed by dividing the diffusion-weighted image Siby the T2-weighted
b⫽0 s/mm2image S0. This yields
6) SACi⫽Si/S0
⫽ e⫺b䡠ADCi.
Note from the last expression, compared with equation 4, that only the diffusion-related exponential term remains, eliminating the T2-weighting effects. Like DWIs, areas of re-duced diffusion appear bright on AC maps and areas of ele-vated diffusion appear dark. This is the opposite of the con-trast polarity of ADC images. However, like ADC maps, AC maps remain less sensitive than DWI signal hyperintensity for
Fig 1.Pulse sequence diagram for a weighted acquisition shows that 2
diffusion-sensitizing gradients (dark gray) are added to a spin-echo sequence, 1 before and 1 after the 180° refocusing pulse. The diffusion-weighting factor b depends on the amplitude of the diffusion gradient (G), the duration of each diffusion gradient (␦), and the interval between the onset of the diffusion gradient before the refocusing pulse and that following the refocusing pulse (⌬). RF indicates radiofrequency pulses; Gz, gradient pulses.
PHYSICS
[image:2.594.53.288.43.116.2]detecting small acute infarcts because they lack the multipli-cative effect of T2 prolongation combined with reduced diffu-sion that produces the “lightbulb” effect on DWI.
Isotropy, Anisotropy, and Rotational Invariance
In isotropic diffusion, molecular motion is equal in all direc-tions. Pure water at body temperature demonstrates isotropic diffusion, with an ADC of approximately 3.0⫻10⫺3mm2/s.
In the human brain, isotropic diffusion may be found in the CSF spaces, except in areas of bulk flow such as the jets ema-nating from the foramina of Monro or through the cerebral aqueduct. Due to its complex microarchitecture, the gray mat-ter of the cerebral cortex in adults is also thought to exhibit isotropic diffusion at the clinical range of b-values,33,47though
some studies differ.48When diffusion is isotropic, the choice
of direction for the diffusion-sensitizing gradient is not im-portant because ADCiis identical for all directionsi.
In anisotropic diffusion, molecular mobility is not equal for all directions. White matter tracts with tightly packed co-herently oriented fiber bundles hinder water displacement perpendicular to the direction of the fibers, resulting in larger
ADCivalues parallel to the tracts rather than orthogonal to them.49Hence, more
than 1 diffusion-encoding direction is re-quired to characterize regions of aniso-tropic diffusion. If only a single diffusion direction was probed, interpretation of the DWIs would be complicated by vari-able signal intensity in white matter tracts, depending on their orientation rel-ative to the direction of the diffusion gra-dient, which could also be affected by changes in the orientation of the patient’s head. Although this anisotropy can be ex-ploited in DTI, to be discussed in detail below, it is not desirable for routine clin-ical DWI. To avoid this problem, one can compute parameters with the property of rotational invariance from the original DWI data because these measures math-ematically eliminate any directional de-pendence that might confuse clinical interpretation.
Computation of commonly used rota-tionally invariant measures, such as the geometric mean DWI and the trace ADC, requires at least 4 separate image acquisi-tions: 1 without diffusion-sensitizing gradients (b⫽0 s/mm2),
labeled S0, and 3 probing motion along 3 mutually orthogonal
directions, labeled S1, S2, and S3, respectively. The DWIs
sub-mitted to the radiologist for interpretation are not typically the sets of unidirectional DWIs S1, S2, and S3but rather the
rota-tionally invariant geometric mean computed from these 3 im-age sets, also known as the “isotropic DWI” or the “combined DWI”:
7) SDWI⫽(S1䡠S2䡠S3)1/3
⫽S0䡠e⫺b䡠(ADC1⫹ADC2⫹ADC3)/3) ⫽S0䡠e⫺b䡠ADC,
where ADC1, ADC2, and ADC3are the ADCs along the
direc-tions of the 3 diffusion-sensitizing gradients and, in the final expression, ADC⫽(ADC1⫹ADC2 ⫹ADC3)/3. This last
variable, ADC, is the average of the ADCivalues along the 3 orthogonal directions and is also rotationally invariant. It is variously known as the mean diffusivity, the trace ADC, Dav,
or, simply, the ADC. Henceforth in this discussion, as is typical in the clinical setting when the acronym ADC is used, it will refer to this averaged value.
Fig 2.DWI enables more sensitive and specific diagnosis of
[image:3.594.53.373.42.463.2]Isotropic DWI and trace ADC maps can be constructed from more than 3 diffusion-encoding directions. However, it is preferable that the diffusion-encoding directions not be col-linear (ie, pointing in opposite directions along the same axis) and that they be as widely distributed in 3D space as possible. This latter condition is satisfied by mutual orthogonality in the case of 3 diffusion-encoding directions. Diffusion along 1 di-rection cannot be distinguished from diffusion in the polar opposite direction by Stejskal-Tanner diffusion encoding, a property known as “antipodal symmetry”. Therefore, 2 col-linear diffusion-sensitizing gradients do not contribute inde-pendent information; hence, collinearity should be avoided in DWI acquisitions.
ADC Mapping of Healthy Human Brain and of Cerebral Pathology
In the healthy adult brain at the clinical range of b-values (⬍1500 s/mm2), the ADC of gray and white matter is very
similar, such that DWI has little intrinsic gray-white matter contrast. Any gray-white contrast observed is primarily due to underlying differences in T2 (ie, the contrast of the b⫽0 s/mm2component of the image). Measured mean diffusivities
in adult brain in vivo are 0.67– 0.83⫻10⫺3mm2/s for gray
matter and 0.64 –0.71⫻10⫺3mm2/s for white matter.33This
differs from neonates and children, in whom ADC is initially very high at term gestational age, approximately 50% greater in rapidly developing gray matter structures such as thalamus
and basal ganglia, and more than twice as high in slowly maturing lobar white mat-ter regions.38,39 Normal ADC values
drop steeply during the first 2 years of postnatal life, during which time the ini-tially higher ADC in most white matter becomes more equal to that in gray mat-ter.50,51ADC values continue to decrease
more gradually throughout childhood, adolescence, and young adulthood, with variable rates of decline that reflect het-erogeneity in the speed of maturation in different parts of the brain.50-56
Con-versely, in the healthy aging brain, mild increases in average brain ADC values may be seen with advancing age beyond 40 years, especially in white matter.57-62
Most types of pathology in the human brain cause increases of ADC values. Causes of abnormally reduced ADC in the human brain are less numerous, of-ten allowing a more specific diagnosis. The most common ones are acute cerebral ischemia and other causes of cytotoxic edema, such as status epilepticus and hypoglycemia. The con-ventional explanation for reduced ADC in acute ischemia is that energetic failure leads to membrane permeability changes, resulting in cellular swelling and decreased volume and increased tortuosity of the extracellular space.63However,
this remains controversial because biophysical evidence has been presented that extracellular ADC and intracellular ADC are both reduced in acute cerebral ischemia, with the major contribution arising from the intracellular space.64
The viscosity of purulent material also reduces diffusion be-low that of the surrounding brain or CSF spaces. In vitro mea-surements of ADC values in pus indicate that viable cell attenua-tion is the most important determinant of hindered diffusion in pus.65Hence, infectious etiologies for intracranially reduced
dif-fusion include pyogenic abscess,29,30subdural or epidural
empy-ema,66and intraventricular empyema.67Similarly, low ADC val-ues due to hindered water motion also produce very bright signal intensity on DWI within extra-axial epidermoid masses68,69and
within acute clotted hematomas, except in T2 dark hematomas due to T2 blackout.43Highly cellular tumors, especially those
with high nuclear-to-cytoplasmic ratios, can show reduced diffu-sion. Examples include the entire class of “small round blue cell tumors” such as lymphoma,25neuroblastoma,70and primitive neuroectodermal tumors such as medulloblastoma.23,71There
have been case reports of brain metastases with restricted
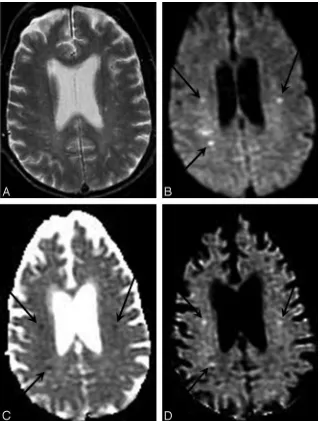
diffu-Fig 3.T2 shinethrough artifact in DWI. A, T2-weighted
[image:4.594.54.373.43.410.2]sion, even those without intralesional hemorrhage.72Reduced diffusion has been described in the acute phase of primary demy-elinating diseases,73,74metabolic disorders,74,75and toxic
expo-sures.76-78Rare causes of reduced ADC include Creutzfeldt-Jakob
disease.79-82
The Diffusion Tensor
As discussed previously, variations in diffusion-weighted sig-nal intensity due to the anisotropy of white matter tracts can be troublesome for the interpretation of clinical DWI, unless rotationally invariant geometric mean DWI and trace ADC maps are computed. However, the anisotropic diffusion of coherently oriented axonal fibers can also be exploited for quantitative characterization and anatomic mapping of white matter tracts. If at least 6 diffusion-encoded image sets are acquired along noncollinear directions, in addition to at least oneb⫽0 s/mm2(or low b) image set, the diffusion tensor can be calculated.32,83
The diffusion tensor, a 3⫻3 matrix of vectors, is a math-ematic model of the 3D pattern of diffusion anisotropy of white matter tracts. The tensor, D, can be related to the diffu-sion-weighted signal intensity, S, and theb⫽0 s/mm2signal
intensity, S0, as follows:
8) S
S0⫽
e⫺冉i⫽
冘
x,y,zj⫽冘
x,y,z bi,jDi,j冊
, where
bi,j ⫽ ␥2GiGj
冋
␦2冉
⌬⫺␦
3
冊册
.In this formalism, the diffusion-weighting factor, b, incor-porates the direction and magnitude of the applied diffusion gradient vector (Gx, Gy, Gz). Six or more measurements of S by using noncollinear diffusion gradients are necessary to es-timate D by using linear regression methods.32,83
The most intuitive way to conceptualize the information provided by the diffusion tensor is to view it geometrically (Fig 4). The tensor effectively fits the angular variation of the ADC
values to the shape of a 3D ellipsoid. The diffusion ellipsoid is a shape defined by 6 variables that describes the ADC of water molecules in each direction at a particular time. For isotropic diffusion, the diffusion ellipsoid is a sphere, because the ADC in every direction is equal. Anisotropic diffu-sion is modeled with an elongated ellipsoid, indicating a greater mean diffusion dis-tance along the longest axis of the ellipsoid. The elements of the tensor above the diag-onal are always equal to those below the diagonal (Fig 4, bottom row), a character-istic termed “conjugate symmetry”, which reflects the antipodal symmetry of Brown-ian motion. Thus, there are only 6 indepen-dent elements of the tensor, necessitating a minimum of 6 noncollinear diffusion-en-coding measurements to solve for the tensor elements. The diagonal terms of the tensor indicate the magnitude of diffu-sivity in each of 3 orthogonal directions. In the case of aniso-tropic diffusion, the off-diagonal terms of the diffusion tensor indicate the magnitude of diffusion along 1 direction arising from a concentration gradient in an orthogonal direction.
Diffusion Tensor Parameters
A number of diffusion tensor metrics are used to characterize the dimensions and shape of the diffusion ellipsoid associated with the microstructure of a particular voxel. The 3 principal axes of the diffusion tensor, termed the “eigenvectors,” can be calculated by diagonalizing the diffusion tensor:
9) ⌳ ⫽
冋
1 0 0
0 2 0
0 0 3
册
⫽R䡠D䡠RT.
The diffusion tensor is rotated by matrix R to produce the diagonal matrix,⌳. The columns of R are composed of the eigenvectors of the system, and RTis the matrix transpose of R.
The 3 eigenvectors and rotationally invariant eigenvalues1,
2,3describe the directions and lengths of the 3 diffusion ellipsoid axes, respectively, in descending order of magnitude (Fig 5, top row). The largest eigenvector, termed the “primary eigenvector,” and its associated eigenvalue1indicate, respec-tively, the direction and magnitude of greatest water diffusion. The primary eigenvector is important for fiber tractography algorithms because this vector indicates the orientation of ax-onal fiber bundles. Therefore,1is also termed “longitudinal diffusivity,” because it specifies the rate of diffusion along the orientation of the fibers. The second and third eigenvectors are orthogonal to the primary eigenvector, and their associated eigenvalues2and3give the magnitude of diffusion in the plane transverse to axonal bundles. Hence, the mean of2and
3is also known as “radial diffusivity”.
A number of additional rotationally invariant diffusion metrics, derived from the 3 eigenvalues, are commonly used to describe the microstructure in a particular voxel. The mean
Fig 4.The diffusion ellipsoids and tensors for isotropic
[image:5.594.54.367.43.286.2]diffusivity (Dav) is the mean of the 3 eigenvalues and describes
the directionally averaged diffusivity of water within a voxel:
10) Dav⫽
1⫹2⫹3
3 ⫽trace (D)/3.
The trace of D is the sum of the 3 eigenvalues and is another measure of orientationally averaged diffusion. The fractional anisotropy (FA) and relative anisotropy (RA) indices measure the degree of directionality of intravoxel diffusivity:
11) FA ⫽
冑
共1⫺2兲2⫹共2⫺3兲2⫹共3⫺1兲2
冑
2冑
12⫹22⫹3212) RA ⫽
冑
共1⫺2兲2⫹共2⫺3兲2⫹共3⫺1兲2
1⫹2⫹3 .
FA and RA can both also be defined by equivalent formulas where the numerators are expressed in terms of the difference of each eigenvalue from the mean diffusivity:
13)
FA ⫽
冑
32
冑
共1⫺Dav兲2⫹共2⫺Dav兲2⫹共3⫺Dav兲2冑
12⫹22⫹3214)
RA ⫽
冑
共1⫺Dav兲2⫹共2⫺D
av兲2⫹共3⫺Dav兲2
冑
3Dav.
When the primary eigenvalue is much larger than the sec-ond and third eigenvalues, anisotropy measures such as FA and RA will be high, indicating a preferred direction of sion. This corresponds to a prolate (cigar) shape of the
diffu-sion ellipsoid (Fig 4, right column), with the preferred direc-tion of diffusion indicated by the long axis of the ellipsoid or, equivalently, by the primary eigenvector of the tensor. In the brain, prolate diffusion within a voxel usually indicates a single coherently organized white matter fiber bundle, with the ax-onal orientation coincident with the primary eigenvector. FA has become by far the most widely used measure of anisotropy in the DTI literature, and its value varies from zero, in the case of isotropic diffusion, up to a maximum of 1, indicating per-fectly linear diffusion occurring only along the primary eigen-vector. The fiber orientation information inherent in the pri-mary eigenvector can be visualized on 2D images by assigning a color to each of 3 mutually orthogonal axes,84typically red to
left-right, green to anteroposterior, and blue to up-down (Fig 5, bottom right).
DTI Fiber Tracking: Methodology
The objective of DTI fiber tracking is to determine intervoxel connectivity on the basis of the anisotropic diffusion of wa-ter.34-36,85,86 The clinical and scientific utility of DTI fiber
tracking is found in both the localization and the quantitative assessment of specific neuronal pathways, as applied to basic neuroscience,87 cognitive neuroscience,88,89 and diagnostic
neuroradiology.90-92In each brain voxel, the dominant
direc-tion of axonal tracts can be assumed to be parallel to the pri-mary eigenvector of the diffusion tensor. Fiber tracking uses the diffusion tensor of each voxel to follow an axonal tract in 3D from voxel to voxel through the human brain. Because DTI provides only microstructural information at relatively low spatial resolution, DTI fiber tracking is often combined with functional and/or higher resolution anatomic information to delineate specific pathways.34,91,93In this way, 3D DTI
tractog-Fig 5.Top row: The first, second, and third eigenvalues are
[image:6.594.53.365.44.334.2]raphy has opened up a whole new dimension to the ability to depict human neuroanatomy noninvasively. This new ana-tomic connectivity information has been summarized in re-view articles,94,95as well as presented in a book-length DTI
atlas.96
DTI fiber tracking algorithms can be divided into deter-ministic and probabilistic methods. Fiber assignment by con-tinuous tracking (FACT) is a deterministic method, which ini-tiates fiber trajectories from user-defined voxels (Fig 6).35
Fiber trajectories, also known as “streamlines”, follow the pri-mary eigenvector from voxel to voxel in 3 dimensions. When the fiber trajectory reaches the edge of the voxel, the direction of the trajectory is changed to match the primary eigenvector of the next voxel. Constraints on the maximum turning angle of the streamline between voxels and on the minimum FA within a voxel for propagation of the streamline can be applied to contain the fiber tracks to regions of the brain where the diffusion tensor model realistically represents the white matter pathways. Figure 7 shows how user-defined regions of interest, based on prior anatomic knowledge, can be used to restrict fiber tracks to the corticospinal tract.34This multiple
region-of-interest technique for isolating anatomically specific fiber pathways by using DTI tractography has been called “virtual dissection”.97
Noise, patient movement, and distortion from imaging artifacts produce uncertainty in the orientation of the dif-fusion ellipsoid and are detrimental to deterministic streamline fiber tracking.98,99Probabilistic fiber tracking
methods incorporate the expected uncertainty into the tracking algorithm and can be used to produce a connec-tivity metric for each voxel. The probability density func-tion of the orientafunc-tion of a neuronal fiber can be estimated with an empiric function based on the FA,86 a Bayesian
model,100or bootstrap statistics.101Probabilistic DTI fiber tracking techniques tend to disperse trajectories more than deterministic methods and have the potential to delineate a greater portion of a white matter tract. However, the accu-racy of these probabilistic methods is still limited by the information contained in the diffusion tensor and the method of constructing the probability density function. Another fundamental limitation of diffusion tractography
is that it cannot distinguish antegrade from retrograde along a fiber pathway, due to the antipodal symmetry in-herent to the diffusion process.
DTI Fiber Tracking: Clinical Applications
The visualization of an entire white matter tract in 3D has clinical and scientific value for detecting gross changes to the anatomic course and the microstructural integrity of specific pathways. DTI has recently been used to identify and charac-terize novel defects in axonal growth and guidance in devel-opmental disorders, such as the absence of normally decussat-ing pontocerebellar fibers in horizontal gaze palsy with progressive scoliosis due to mutation of the ROBO3 gene102 and the ectopic location of pontocerebellar fibers in pontine tegmental cap dysplasia.103An aberrant fiber pathway known
as the “asymmetric sigmoid bundle” was first identified with DTI fiber tracking in individuals with dysgenesis of the corpus callosum.104,105Brain tumors and other intracranial mass
le-sions are capable of dramatically altering the position of the corticospinal tract; hence, knowledge of the location of this important tract within deep white matter is critical for resect-ing mass lesions without postoperative motor deficit (Fig 8).90-92,106DTI fiber tracks can be used in conjunction with
stereotactic navigation to identify a safety margin of approxi-mately 1 cm around the motor tract, which can be used for surgical planning.107,108
In addition to basic 3D visualization, many studies have used fiber tracking to delineate specific white matter tracts for quantitative analysis. Quantitative DTI tractography studies have examined the microstructure of white matter tracts in pediatric subjects,109-112in elderly subjects,113and in patients
with schizophrenia,114brain tumors,115Alzheimer disease,116
and many other disorders. DTI fiber tracking can objec-tively create 3D regions of interest specific to an entire white matter tract. However, most white matter tracts have heterogeneous structural characteristics, and fiber tracking can be used to segment a pathway into several regions for quantitative analysis. Figure 9 shows the optic radiations in a premature infant color-coded according to the underly-ing FA values in the voxels contained within the tracts. The anterior portion of the optic radiation adjacent to the thal-amus was observed to have significantly higher FA than the posterior portions of the tract.117The spatial and temporal
heterogeneity of DTI metrics has also been observed with fiber tracking of sensorimotor tracts in premature infants, indicating the maturation of the delineated tract and the emergence of other tracts crossing the sensorimotor path-way in the centrum semiovale.111
Conclusion
This review article has explored the theoretic background needed to understand clinical DWI and DTI, including fiber tractography, and their application to neuroradiology. These diffusion MR imaging techniques provide microstructural in-formation about biologic tissues that is not available from other imaging techniques. In the central nervous system, this has yielded important new tools for diagnosis in ischemia, infection, tumors, and demyelinating disease, among other pathologies, as well as for presurgical mapping of white matter pathways to avoid postoperative injury.
Fig 6.Schematic demonstrating the FACT algorithm. Arrows represent primary
[image:7.594.55.286.42.217.2]However, even as sophisticated a mathematic construct as the diffusion tensor is an oversimplification of the properties of water diffusion in the brain. The limitations of the diffusion tensor in areas of complex white matter architecture, where fiber tracts intersect, branch, or are otherwise partial volume averaged within a voxel, affect the ability of DTI fiber tractog-raphy to fully delineate an axonal pathway and may also lead to the generation of spurious tracks.95Measurements of
quan-titative DTI parameters such as FA are also difficult or impos-sible to interpret in regions of complex white matter. These problems have led to the introduction of more advanced methods such as high angular resolution diffusion imaging118-120
and diffusion spectrum imaging,121which promise to
over-come many of the inadequacies of the tensor model. These newer methods take better advantage of ongoing technical de-velopments, including the synergistic combination of ultra-high field diffusion122with highly accelerated parallel
imag-ing,123-125and lead to new scientific and clinical applications
such as probabilistic tractography126-128and whole-brain
con-nectivity networks.129 Hence, these newer techniques that
transcend the diffusion tensor are likely to be adopted in clin-ical neuroradiology during the years to come.
References
1. Einstein A.Investigations on the Theory of the Brownian Movement.New York: Dover; 1956
2. Le Bihan D, Breton E, Lallemand D, et al.MR imaging of intravoxel incoherent motions: application to diffusion and perfusion in neurologic disorders. Radiol-ogy1986;161:401– 07
3. Le Bihan D, Breton E, Lallemand D, et al.Separation of diffusion and perfusion in intravoxel incoherent motion MR imaging.Radiology1988;168:497–505 4. Thomsen C, Henriksen O, Ring P.In vivo measurement of water self diffusion in
the human brain by magnetic resonance imaging.Acta Radiol1987;28:353– 61 5. Turner R, Le Bihan D, Maier J, et al.Echo-planar imaging of intravoxel
incoher-ent motion.Radiology1990;177:407–14
6. Moseley ME, Cohen Y, Mintorovitch J, et al.Early detection of regional cerebral ischemia in cats: comparison of diffusion- and T2-weighted MRI and spectros-copy.Magn Reson Med1990;14:330 – 46
7. Chien D, Kwong KK, Gress DR, et al.MR diffusion imaging of cerebral infarction in humans.AJNR Am J Neuroradiol1992;13:1097–102, discussion 1103– 05 8. Warach S, Chien D, Li W, et al.Fast magnetic resonance diffusion-weighted
imaging of acute human stroke.Neurology1992;42:1717–23. Erratum in: Neurol-ogy1992;42:2192
9. Marks MP, De Crespigny A, Lentz D, et al.Acute and chronic stroke: navigated spin-echo diffusion-weighted MR imaging.Radiology1996;199:403– 08 10. Gonzalez RG, Schaefer PW, Buonanno FS, et al.Diffusion-weighted MR imaging:
diagnostic accuracy in patients imaged within 6 hours of stroke symptom onset.
Radiology1999;210:155– 62
11. Ebisu T, Naruse S, Horikawa Y, et al.Discrimination between different types of white matter edema with diffusion-weighted MR imaging.J Magn Reson Imaging
1993;3:863– 68
Fig 7.Multiple regions of interest are used with the FACT
algorithm to delineate the corticospinal tract. Left: Fiber tracks (red) are generated from a region drawn in the cerebral pedun-cle (yellow voxels). Middle: Streamlines also passing through a region drawn in the posterior limb of the internal capsule (green voxels) are retained. Right: The final set of streamlines most closely corresponding to the corticospinal tract passes through the centrum semiovale (blue) in addition to the internal capsule and cerebral peduncle regions.
Fig 8.DTI fiber tracks reveal the course of the corticospinal tract along the border of a brain
tumor (blue). Streamlines were launched from wrist (green) and shoulder (red) motor stimulation sites on the cortex. The wrist and shoulder motor streamlines twist about each other as they descend from the cortex through the internal capsule to the cerebral peduncle.
Fig 9.DTI fiber tracks of the optic radiation in a 35-week gestational age premature infant.
[image:8.594.67.427.38.458.2] [image:8.594.299.537.133.371.2]12. Schaefer PW, Buonanno FS, Gonzalez RG, et al.Diffusion-weighted imaging dis-criminates between cytotoxic and vasogenic edema in a patient with eclampsia.
Stroke1997;28:1082– 85
13. Schwartz R, Mulkern R, Gudbjartsson H, et al.Diffusion-weighted MR imaging in hypertensive encephalopathy: clues to pathogenesis.AJNR Am J Neuroradiol
1998;19:859 – 62
14. Ay H, Buonanno FS, Schaefer PW, et al.Posterior leukoencephalopathy without severe hypertension: utility of diffusion-weighted MRI. Neurology.
1998;51:1369 –76
15. Mukherjee P, McKinstry RC. Reversible posterior leukoencephalopathy syndrome: evaluation with diffusion-tensor MR imaging. Radiology
2001;219:756 – 65
16. Provenzale JM, Petrella JR, Cruz LCH Jr, et al.Quantitative assessment of diffu-sion abnormalities in posterior reversible encephalopathy syndrome.AJNR Am J Neuroradiol.2001;22:1455– 61
17. Arfanakis K, Haughton VM, Carew JD, et al.Diffusion tensor MR imaging in diffuse axonal injury.AJNR Am J Neuroradiol.2002;23:794 – 802
18. Hergan K, Schaefer PW, Sorensen AG, et al.Diffusion-weighted MRI in diffuse axonal injury of the brain.Eur Radiol2002;12:2536 – 41
19. Huisman TA, Sorensen AG, Hergan K, et al.Diffusion-weighted imaging for the evaluation of diffuse axonal injury in closed head injury.J Comput Assist Tomogr
2003;27:5–11
20. Tien R, Felseberg G, Friedman H, et al.MR imaging of high-grade cerebral gliomas: value of diffusion-weighted echoplanar pulse sequences.AJR Am J Roentgenol1994;162:671–77
21. Brunberg J, Chenevert T, McKeever P, et al.In vivo MR determination of water diffusion coefficients and diffusion anisotropy: correlation with structural alter-ation in gliomas of the cerebral hemispheres. AJNR Am J Neuroradiol.
1995;16:361–71
22. Krabbe K, Gideon P, Wagn P, et al.MR diffusion imaging of human intracranial tumours.Neuroradiology1997;39:483– 89
23. Gauvain KM, McKinstry RC, Mukherjee P, et al.Evaluating pediatric brain tumor cellularity with diffusion-tensor imaging.AJR Am J Roentgenol2001;177:449 –54 24. Kono K, Inoue Y, Nakayama K, et al.The role of diffusion-weighted imaging in
patients with brain tumors.AJNR Am J Neuroradiol2001;22:1081– 88 25. Guo AC, Cummings TJ, Dash RC, et al. Lymphomas and high-grade
astrocytomas: comparison of water diffusibility and histologic characteristics.
Radiology2002;224:177– 83
26. Chenevert TL, Sundgren PC, Ross BD.Diffusion imaging: insight to cell status and cytoarchitecture.Neuroimaging Clin N Am2006;16:619 –32
27. Lu S, Ahn D, Johnson G, et al.Peritumoral diffusion tensor imaging of high-grade gliomas and metastatic brain tumors. AJNR Am J Neuroradiol
2003;24:937– 41
28. Smith JS, Cha S, Mayo MC, et al.Serial diffusion-weighted magnetic resonance imaging in cases of glioma: distinguishing tumor recurrence from postresection injury.J Neurosurg2005;103:428 –38
29. Ebisu T, Tanaka C, Umeda M, et al.Discrimination of brain abscess from necrotic or cystic tumors by diffusion-weighted echo planar imaging.Magn Reson Imag-ing1996;14:1113–16
30. Kim Y, Chang K, Kim H, et al.Brain abscess and necrotic or cystic brain tumor: discrimination with signal intensity on diffusion-weighted MR imaging.AJR Am J Roentgenol1998;171:1487–90
31. Leuthardt EC, Wippold FJ 2nd, Oswood MC, et al.Diffusion-weighted MR imag-ing in the preoperative assessment of brain abscesses. Surg Neurol
2002;58:395– 402
32. Basser PJ, Mattiello J, Le Bihan D.Estimation of the effective self-diffusion-tensor from the NMR spin echo.J Magn Reson B1994;103:247–54
33. Pierpaoli C, Jezzard P, Basser PJ, et al.Diffusion tensor MR imaging of the human brain.Radiology1996;201:637– 48
34. Conturo TE, Lori NF, Cull TS, et al.Tracking neuronal fiber pathways in the living human brain.Proc Natl Acad Sci U S A1999;96:10422–27
35. Mori S, Kaufmann WE, Pearlson GD, et al.Three-dimensional tracking of axonal projections in the brain by magnetic resonance imaging. Ann Neurol
1999;45:265– 69
36. Basser PJ, Pajevic S, Pierpaoli C, et al.In vivo fiber tractography using DT-MRI data.Magn Reson Med2000;44:625–32
37. Stejskal EO, Tanner JE.Spin diffusion measurements: spin echoes in the presence of a time-dependent field gradient.J Chem Phys1965;42:288 –92
38. Huppi PS, Maier SE, Peled S, et al.Microstructural development of human new-born cerebral white matter assessed in vivo by diffusion tensor magnetic reso-nance imaging.Pediatr Res1998;44:584 –90
39. Neil JJ, Shiran SI, McKinstry RC, et al.Normal brain in human newborns: appar-ent diffusion coefficiappar-ent and diffusion anisotropy measured by using diffusion tensor MR imaging.Radiology1998;209:57– 66
40. DeLano MC, Cao Y.High b-value diffusion imaging.Neuroimaging Clin N Am
2002;12:21–34
41. Kim HJ, Choi CG, Lee DH, et al.High-b-value diffusion-weighted MR imaging of hyperacute ischemic stroke at 1.5T.AJNR Am J Neuroradiol2005;26:208 –15 42. Chen PE, Simon JE, Hill MD, et al.Acute ischemic stroke: accuracy of
diffusion-weighted MR imaging— effects of b value and cerebrospinal fluid suppression.
Radiology2006;238:232–39
43. Maldjian JA, Listerud J, Moonis G, et al.Computing diffusion rates in T2-dark hematomas and areas of low T2 signal.AJNR Am J Neuroradiol2001;22:112–18 44. Mulkern RV, Gudbjartsson H, Westin CF, et al.Multi-component apparent
dif-fusion coefficients in human brain.NMR Biomed1999;12:51– 62
45. Mulkern RV, Vajapeyam S, Robertson RL, et al.Biexponential apparent diffusion coefficient parameterization in adult vs newborn brain.Magn Reson Imaging
2001;19:659 – 68
46. Provenzale JM, Engelter ST, Petrella JR, et al.Use of MR exponential diffusion-weighted images to eradicate T2 “shine-through” effect.AJR Am J Roentgenol
1999;172:537–39
47. Shimony JS, McKinstry RC, Akbudak E, et al.Quantitative diffusion-tensor an-isotropy brain MR imaging: normative human data and anatomic analysis. Ra-diology1999;212:770 – 84
48. Sorensen AG, Wu O, Copen WA, et al.Human acute cerebral ischemia: detection of changes in water diffusion anisotropy by using MR imaging.Radiology
1999;212:785–92
49. Chenevert TL, Brunberg JA, Pipe JG.Anisotropic diffusion in human white matter: demonstration with MR techniques in vivo.Radiology1990;177:401– 05 50. Mukherjee P, Miller JH, Shimony JS, et al.Normal brain maturation during childhood: developmental trends characterized with diffusion-tensor MR imag-ing.Radiology2001;221:349 –58
51. Mukherjee P, McKinstry RC.Diffusion tensor imaging and tractography of hu-man brain development.Neuroimaging Clin N Am2006;16:19 – 43
52. Mukherjee P, Miller JH, Shimony JS, et al.Diffusion-tensor MR imaging of gray and white matter development during normal human brain maturation.AJNR Am J Neuroradiol2002;23:1445–56
53. McGraw P, Liang L, Provenzale JM.Evaluation of normal age-related changes in anisotropy during infancy and childhood as shown by diffusion tensor imaging.
AJR Am J Roentgenol2002;179:1515–22
54. Schneider JF, Il’yasov KA, Hennig J, et al.Fast quantitative diffusion-tensor im-aging of cerebral white matter from the neonatal period to adolescence. Neuro-radiology2004;46:258 – 66
55. Snook L, Paulson LA, Roy D, et al.Diffusion tensor imaging of neurodevelop-ment in children and young adults.Neuroimage2005;26:1164 –73
56. Hermoye L, Saint-Martin C, Cosnard G, et al.Pediatric diffusion tensor imaging: normal database and observation of the white matter maturation in early child-hood.Neuroimage2006;29:493–504
57. Gideon P, Thomsen C, Henriksen O.Increased self-diffusion of brain water in normal aging.J Magn Reson Imaging1994;4:185– 88
58. Chun T, Filippi CG, Zimmerman RD, et al.Diffusion changes in the aging human brain.AJNR Am J Neuroradiol2000;21:1078 – 83
59. Engelter ST, Provenzale JM, Petrella JR, et al.The effect of aging on the apparent diffusion coefficient of normal-appearing white matter.AJR Am J Roentgenol
2000;175:425–30
60. Chen ZG, Li TQ, Hindmarsh T.Diffusion tensor trace mapping in normal adult brain using single-shot EPI technique: a methodological study of the aging brain.Acta Radiol2001;42:447–558
61. Nusbaum AO, Tang CY, Buchsbaum MS, et al.Regional and global changes in cerebral diffusion with normal aging.AJNR Am J Neuroradiol2001;22:136 – 42 62. Moseley ME.Diffusion tensor imaging and aging: a review.NMR Biomed
2002;15:553– 60
63. Sotak CH.Nuclear magnetic resonance (NMR) measurement of the apparent diffusion coefficient (ADC) of tissue water and its relationship to cell volume changes in pathological states.Neurochem Int2004;45:569 – 82
64. Duong TQ, Ackerman JJ, Ying HS, et al.Evaluation of extra- and intracellular apparent diffusion in normal and globally ischemic rat brain via 19F NMR.
Magn Reson Med1998;40:1–13
65. Mishra AM, Gupta RK, Saksena S, et al.Biological correlates of diffusivity in brain abscess.Magn Reson Med2005;54:878 – 85
66. Tsuchiya K, Osawa A, Katase S, et al.Diffusion-weighted MRI of subdural and epidural empyemas.Neuroradiology2003;45:220 –23
67. Pezzullo JA, Tung GA, Mudigonda S, et al.Diffusion-weighted MR imaging of pyogenic ventriculitis.AJR Am J Roentgenol2003;180:71–75
68. Tsuruda JS, Chew WM, Moseley ME, et al.Diffusion-weighted MR imaging of the brain: value of differentiating between extraaxial cysts and epidermoid tumors.
AJNR Am J Neuroradiol1990;11:925–31, discussion 932–34
69. Tsuruda JS, Chew WM, Moseley ME, et al.Diffusion-weighted MR imaging of extraaxial tumors.Magn Reson Med1991;19:316 –20
70. Uhl M, Altehoefer C, Kontny U, et al.MRI-diffusion imaging of neuroblastomas: first results and correlation to histology.Eur Radiol2002;12:2335–38. Epub 2002 Mar 19
71. Erdem E, Zimmerman RA, Haselgrove JC, et al.Diffusion-weighted imaging and fluid attenuated inversion recovery imaging in the evaluation of primitive neu-roectodermal tumors.Neuroradiology2001;43:927–33
72. Hartmann M, Jansen O, Heiland S, et al.Restricted diffusion within ring en-hancement is not pathognomonic for brain abscess.AJNR Am J Neuroradiol
2001;22:1738 – 42
73. Mader I, Wolff M, Niemann G, et al.Acute haemorrhagic encephalomyelitis (AHEM): MRI findings.Neuropediatrics2004;35:143– 46
75. Sener RN.Diffusion magnetic resonance imaging patterns in metabolic and toxic brain disorders.Acta Radiol2004;45:561–70
76. Teksam M, Casey SO, Michel E, et al.Diffusion-weighted MR imaging findings in carbon monoxide poisoning.Neuroradiology2002;44:109 –13
77. Sandoval C, Kutscher M, Jayabose S, et al. Neurotoxicity of intrathecal methotrexate: MR imaging findings.AJNR Am J Neuroradiol2003;24:1887–90 78. McKinney AM, Filice RW, Teksam M, et al.Diffusion abnormalities of the globi
pallidi in manganese neurotoxicity.Neuroradiology2004;46:291–95
79. Bahn M, Kido D, Lin W, et al.Brain magnetic resonance diffusion abnormalities in Creutzfeldt-Jakob disease.Arch Neurol1997;54:1411–15
80. Demaerel P, Baert AL, Vanopdenbosch L, et al.Diffusion-weighted magnetic res-onance imaging in Creutzfeldt-Jakob disease.Lancet1997;349:847– 48 81. Bahn MM, Parchi P.Abnormal diffusion-weighted magnetic resonance images
in Creutzfeldt-Jakob disease.Arch Neurol1999;56:577– 83
82. Demaerel P, Heiner L, Robberecht W, et al.Diffusion-weighted MRI in sporadic Creutzfeldt-Jakob disease.Neurology1999;52:205– 08
83. Basser PJ, Mattiello J, LeBihan D.MR diffusion tensor spectroscopy and imaging.
Biophys J1994;66:259 – 67
84. Pajevic S, Pierpaoli C.Color schemes to represent the orientation of anisotropic tissues from diffusion tensor data: application to white matter fiber tract map-ping in the human brain.Magn Reson Med1999;42:526 – 40. Erratum in:Magn Reson Med2000;43:921
85. Gossl C, Fahrmeir L, Putz B, et al.Fiber tracking from DTI using linear state space models: detectability of the pyramidal tract.Neuroimage2002;16:378 – 88 86. Parker GJ, Haroon HA, Wheeler-Kingshott CA.A framework for a
streamline-based probabilistic index of connectivity (PICo) using a structural interpreta-tion of MRI diffusion measurements.J Magn Reson Imaging2003;18:242–54 87. Mori S, Zhang J.Principles of diffusion tensor imaging and its applications to
basic neuroscience research.Neuron2006;51:527–39
88. ffytche DH, Catani M.Beyond localization: from hodology to function.Philos Trans R Soc Lond B Biol Sci2005;360:767–79
89. Catani M.Diffusion tensor magnetic resonance imaging tractography in cogni-tive disorders.Curr Opin Neurol2006;19:599 – 606
90. Holodny AI, Schwartz TH, Ollenschleger M, et al.Tumor involvement of the corticospinal tract: diffusion magnetic resonance tractography with intraoper-ative correlation.J Neurosurg2001;95:1082
91. Berman JI, Berger MS, Mukherjee P, et al.Diffusion-tensor imaging-guided tracking of fibers of the pyramidal tract combined with intraoperative cortical stimulation mapping in patients with gliomas.J Neurosurg2004;101:66 –72 92. Nimsky C, Ganslandt O, Hastreiter P, et al.Preoperative and intraoperative
dif-fusion tensor imaging-based fiber tracking in glioma surgery.Neurosurgery
2005;56:130 –37
93. Guye M, Parker GJ, Symms M, et al.Combined functional MRI and tractography to demonstrate the connectivity of the human primary motor cortex in vivo.
Neuroimage2003;19:1349 – 60
94. Wakana S, Jiang H, Nagae-Poetscher LM, et al.Fiber tract-based atlas of human white matter.Radiology2004;230:77– 87
95. Hess CP, Mukherjee P.Visualizing white matter pathways in the living human brain: diffusion tensor imaging and beyond. Neuroimaging Clin N Am
2007;17:407–26
96. Mori S, Wakana S, Nagae-Poetscher LM, et al.MRI Atlas of Human White Matter.
Amsterdam: Elsevier; 2005
97. Catani M, Howard RJ, Pajevic S, et al.Virtual in vivo interactive dissection of white matter fasciculi in the human brain.Neuroimage2002;17:77–94 98. Anderson AW.Theoretical analysis of the effects of noise on diffusion tensor
imaging.Magn Reson Med2001;46:1174 – 88
99. Lazar M, Alexander AL.An error analysis of white matter tractography methods: synthetic diffusion tensor field simulations.Neuroimage2003;20:1140 –53 100. Behrens TE, Woolrich MW, Jenkinson M, et al.Characterization and
propaga-tion of uncertainty in diffusion-weighted MR imaging.Magn Reson Med
2003;50:1077– 88
101. Lazar M, Alexander AL.Bootstrap white matter tractography (BOOT-TRAC).
Neuroimage2005;24:524 –32. Epub 2004 Nov 24
102. Sicotte NL, Salamon G, Shattuck DW, et al.Diffusion tensor MRI shows abnor-mal brainstem crossing fibers associated with ROBO3 mutations.Neurology
2006;67:519 –21
103. Barth PG, Majoie CB, Caan MW, et al.Pontine tegmental cap dysplasia: a novel brain malformation with a defect in axonal guidance.Brain2007;130 (Pt 9): 2258 – 66. Epub 2007 Aug 9
104. Tovar-Moll F, Moll J, de Oliveira-Souza R, et al.Neuroplasticity in human callosal dysgenesis: a diffusion tensor imaging study.Cereb Cortex2007;17:531– 41 105. Paul LK, Brown WS, Adolphs R, et al.Agenesis of the corpus callosum: genetic,
developmental and functional aspects of connectivity. Nat Rev Neurosci
2007;8:287–99
106. Hendler T, Pianka P, Sigal M, et al.Delineating gray and white matter involve-ment in brain lesions: three-dimensional aligninvolve-ment of functional magnetic res-onance and diffusion-tensor imaging.J Neurosurg2003;99:1018 –27
107. Bello L, Gambini A, Castellano A, et al.Motor and language DTI fiber tracking combined with intraoperative subcortical mapping for surgical removal of glio-mas.Neuroimage2008;39:369 – 82. Epub 2007 Aug 29
108. Berman JI, Berger MS, Chung SW, et al.Accuracy of diffusion tensor magnetic resonance imaging tractography assessed using intraoperative subcortical stim-ulation mapping and magnetic source imaging.J Neurosurg2007;107:488 –94 109. Glenn OA, Henry RG, Berman JI, et al.DTI-based three-dimensional
tractogra-phy detects differences in the pyramidal tracts of infants and children with con-genital hemiparesis.J Magn Reson Imaging2003;18:641– 48
110. Partridge SC, Mukherjee P, Berman JI, et al.Tractography-based quantitation of diffusion tensor imaging parameters in white matter tracts of preterm new-borns.J Magn Reson Imaging2005;22:467–74
111. Berman JI, Mukherjee P, Partridge SC, et al.Quantitative diffusion tensor MRI fiber tractography of sensorimotor white matter development in premature in-fants.Neuroimage2005;27:862–71
112. Dubois J, Hertz-Pannier L, Dehaene-Lambertz G, et al.Assessment of the early organization and maturation of infants’ cerebral white matter fiber bundles: a feasibility study using quantitative diffusion tensor imaging and tractography.
Neuroimage2006;30:1121–32
113. Sullivan EV, Adalsteinsson E, Pfefferbaum A.Selective age-related degradation of anterior callosal fiber bundles quantified in vivo with fiber tracking.Cereb Cortex
2006;16:1030 –39
114. Jones DK, Catani M, Pierpaoli C, et al.Age effects on diffusion tensor magnetic resonance imaging tractography measures of frontal cortex connections in schizophrenia.Hum Brain Mapp2006;27:230 –38
115. Roberts TP, Liu F, Kassner A, et al.Fiber density index correlates with reduced fractional anisotropy in white matter of patients with glioblastoma.AJNR Am J Neuroradiol2005;26:2183– 86
116. Taoka T, Iwasaki S, Sakamoto M, et al.Diffusion anisotropy and diffusivity of white matter tracts within the temporal stem in Alzheimer disease: evaluation of the “tract of interest” by diffusion tensor tractography.AJNR Am J Neuroradiol
2006;27:1040 – 45
117. Berman JI, Glass HC, Miller SP, et al.Quantitative Fiber Tracking Analysis of the Optic Radiations in Premature Newborns.Proceedings of the Fifteenth Annual Meeting of the International Society of Magnetic Resonance in Medicine,Berlin, Ger-many, May 19-25, 2007
118. Tuch DS, Reese TG, Wiegell MR, et al.Diffusion MRI of complex neural archi-tecture.Neuron2003;40:885–95
119. Tournier JD, Calamante F, Gadian DG, et al.Direct estimation of the fiber orien-tation density function from diffusion-weighted MRI data using spherical de-convolution.Neuroimage2004;23:1176 – 85
120. Hess CP, Mukherjee P, Han ET, et al.Q-ball reconstruction of multimodal fiber orientations using the spherical harmonic basis. Magn Reson Med
2006;56:104 –17
121. Wedeen VJ, Hagmann P, Tseng WY, et al.Mapping complex tissue architecture with diffusion spectrum magnetic resonance imaging. Magn Reson Med
2005;54:1377– 86
122. Mukherjee P, Hess CP, Xu D, et al.Development and initial evaluation of 7-T q-ball imaging of the human brain.Magn Reson Imaging2008; 26:171-80. Epub 2007 Aug 9
123. Ohliger MA, Grant AK, Sodickson DK.Ultimate intrinsic signal-to-noise ratio for parallel MRI: electromagnetic field considerations. Magn Reson Med
2003;50:1018 –30
124. Wiesinger F, Van de Moortele PF, Adriany G, et al.Parallel imaging performance as a function of field strength: an experimental investigation using electrody-namic scaling.Magn Reson Med2004;52:953– 64
125. Wiesinger F, Van de Moortele PF, Adriany G, et al.Potential and feasibility of parallel MRI at high field.NMR Biomed2006;19:368 –78
126. Behrens TE, Berg HJ, Jbabdi S, et al.Probabilistic diffusion tractography with multiple fibre orientations: what can we gain?Neuroimage2007;34:144 –55. Epub 2006 Oct 27
127. Dyrby TB, Søgaard LV, Parker GJ, et al.Validation of in vitro probabilistic trac-tography.Neuroimage2007;37:1267–77
128. Berman JI, Chung S, Mukherjee P, et al.Probabilistic streamline q-ball tractog-raphy using the residual bootstrap.Neuroimage2008;39:215–22