Master Thesis
Combining Process Mining and Queueing Theory
for ICT Ticket Resolution Process at LUMC
Ay¸se Aslan
Supervised by
Prof. Dr. Richard Boucherie Dr. Maartje van de Vrugt
August 2017
Preface
This thesis is the product of the final project which is a substantial part of the master program in applied mathematics in University of Twente, in Netherlands. I conducted this project at the ICT department in Leiden University Medical Center (LUMC), in Netherlands. In this project, I investigated the ticket resolution process of the ICT department. Academically, this project is supervised by Dr. Maartje van de Vrugt and Prof. Dr. Richard Boucherie.
My journey of research is started when we formulated the research questions together with my supervisor Willem van Duyvenvoorde at the ICT department in LUMC and academic supervisors at University of Twente to conduct a project which both answers the needs of the ICT department and constitutes a firm and sound work of applied mathematics.
I started the project in February 2017 and ended in August 2017. During that time, my supervisor Willem van Duyvenvoorde was always pleased to answer my queries to understand the ticket resolution process of the ICT department. Firstly, I would like to thank Willem van Duyvenvoorde for his time and support.
I would like to thank my supervisors Dr. Maartje van de Vrugt and Prof. Dr. Richard Boucherie for their valuable comments, guidance and support throughout the project.
Finally, I would like to thank my family and friends for being helpful and supportive.
Ay¸se Aslan
Summary
The research in this thesis analyzes and supports the ticket resolution process of ICT department in LUMC. The research aims to investigate the performance of the ticket resolution process and provide predictions for the resolution times of the tickets to sup-port the ticket resolution process. The main purpose of the research is combining process mining and queueing theory techniques for the ticket resolution process. The purpose of utilizing process mining is to gain insights of the ticket resolution process from the his-torical data. This research aims to accomplish the mission of combining process mining and queueing theory by making use of the process insights that process mining provides to build a queueing network model of the ticket resolution process. This research aims to take a queueing theory perspective in providing resolution time predictions for tick-ets. This research proposes a stochastic Petri net approach which incorporates mean queueing performances of the queueing network model of the ticket resolution process to provide queueing theory perspective predictions.
Thesis is composed of 9 chapters each of them dealing with different aspects of the research. Chapter 1 is introductory. Chapter 1 is subdivided into 5 sections. Section 1.1 describes the management process of incidents that are reported as tickets at the ICT department. Section 1.2 describes the research subject of ticket resolution process at the ICT department. Section 1.3 explains the research motivations. Section 1.4 describes the research objectives and questions. Section 1.5 describes the outline of the thesis.
Chapter 2 gives a brief literature review on the topics that relate to the research ques-tions of the thesis. Chapter 2 is subdivided into 4 secques-tions. Section 2.1 gives a literature review on process mining which explores the extent of the insights about processes that can be discovered with process mining. Section 2.2 gives a literature review on ticket resolution. Section 2.3 gives a review of literature which utilizes both process mining and queueing theory techniques. Section 2.4 presents a review of literature on the techniques of predicting time in processes.
Chapter 3 introduces process mining to the readers. Chapter 3 is subdivided into 5 sections. Section 3.1 briefly describes process mining. Section 3.2 states the questions that process mining can answer about processes. Section 3.3 describes the tools to perform process mining. Section 3.4 gives an illustration of performing process mining to a sample event log and discovering information. Section 3.5 describes quality criteria to assess the quality of discovered process models.
Chapter 4 outlines the research approach. Chapter 4 is subdivided into 3 sections. Section 4.1 states the goals of the research approach. Section 4.2 illustrates the overview of the research methodology. Section 4.3 explains how process mining and queueing theory are combined in the research.
the ICT department in LUMC and reports the analyses conducted with several process mining tools on the process. Chapter 5 is subdivided into 4 sections. Section 5.1 expli-cates the event log preparation for the ticket resolution process. Section 5.2 concentrates on the efficiency analysis of the ticket resolution process with process mining tools. Sec-tion 5.3 describes the process discovery with Inductive Visual Miner process mining tool for the ticket resolution process. Section 5.4 presents a process mining tool to discover social relations among the operators of the ticket resolution process.
Chapter 6 contains the queueing network model of the ticket resolution process. Chap-ter 6 is subdivided into 5 sections. Section 6.1 explains the gained insights by process mining on the ticket resolution process that shape the queueing network model. Sec-tion 6.2 presents the queueing network model of the ticket resoluSec-tion process. SecSec-tion 6.3 explains the server structure of delay. Section 6.4 explains the server structure of operators. Section 6.5 describes the derivation of the model input parameters.
Chapter 7 provides the analysis of the model. Chapter 7 is subdivided into 4 sections. Section 7.1 provides the analysis of operators. Section 7.2 provides the analysis of delay. Section 7.3 provides the analysis of the network. Section 7.4 provides the obtained results from the implementation of the analyses.
Chapter 8 proposes the stochastic Petri net methodology to produce resolution time predictions and provides the results of implementing resolution time predictions. Chap-ter 8 is subdivided into 5 sections. Section 8.1 explains the resolution time prediction approach of the research. Section 8.2 describes how to represent the ticket resolution process with stochastic Petri nets. Section 8.3 presents the resolution time prediction method. Section 8.4 provides the results of implementing the resolution time predic-tion method. Secpredic-tion 8.5 gives the results of numerical experiments of investigating the performance improvements of the ticket resolution process.
Contents
Preface iii
Summary v
List of Figures xi
List of Tables xiii
1 Introduction 1
1.1 Incident Management Process . . . 1
1.1.1 Key Performance Indicators . . . 1
1.1.2 Overall Process Flow . . . 2
1.2 ICT Ticket Resolution Process . . . 4
1.3 Motivation . . . 6
1.4 Objective . . . 7
1.5 Thesis Outline . . . 7
2 Literature Review 9 2.1 Process Mining . . . 9
2.2 Ticket Resolution . . . 11
2.3 Queueing Theory and Process Mining . . . 12
2.4 Predicting Time . . . 13
2.4.1 A Similar Process: Customer Contact Centers . . . 13
2.4.2 Recent History Predictions . . . 14
2.4.3 Process Mining Based Predictions . . . 14
2.4.4 A Stochastic Petri Net Prediction . . . 15
3 Process Mining 17 3.1 What Is Process Mining? . . . 17
3.2 What Can Process Mining Discover? . . . 18
3.3 Tools . . . 19
3.4 From Event Logs to Process Discovery . . . 19
3.5 Quality in Process Model Discovery . . . 23
4 Research Approach 27 4.1 Research Goals . . . 27
4.3 How Are Process Mining and Queueing Theory Combined? . . . 29
5 Process Mining Ticket Resolution Process 31 5.1 Event Log Preparation . . . 31
5.2 Analyzing Efficiency with Process Mining . . . 34
5.2.1 Basic Statistics . . . 34
5.2.2 How Many Operators Are Involved? . . . 34
5.2.3 Who Closes a Category with Log Summary Tool . . . 35
5.2.4 How Long Do Tickets Stay Open? . . . 36
5.2.5 Are the Targets Met? . . . 37
5.2.6 Arrival Patterns with Dotted Chart Tool . . . 38
5.3 Process Model Discovery with Inductive Visual Miner Tool . . . 38
5.4 Discovering Social Relations Between Operators with Causal Activity Ma-trix Tool . . . 45
6 Modelling Ticket Resolution Process 47 6.1 Process Insights . . . 47
6.2 Queueing Network Model . . . 48
6.3 Delay Server . . . 49
6.4 Operators as Servers . . . 50
6.5 Model Parameters . . . 51
6.5.1 Arrival Rates . . . 52
6.5.2 Resolution Probabilities . . . 53
6.5.3 Routing Probabilities Between Operators . . . 54
6.5.4 Delay Service Times . . . 54
6.5.5 Resolution Service Times . . . 55
7 Model Analysis 57 7.1 Analysis of Operators . . . 57
7.2 Analysis of Delay . . . 61
7.3 Mean Network Performance . . . 63
7.4 Queueing Analysis Implementation . . . 63
7.4.1 Queue Input Parameters . . . 64
7.4.2 Queue Analysis of Operators, Delay and Network . . . 64
8 Resolution Time Prediction 67 8.1 Prediction Approach . . . 67
8.2 SPN Representation . . . 67
8.3 Prediction Algorithm . . . 69
8.4 Prediction Implementation . . . 69
8.5 Numerical Experiments . . . 73
8.5.1 Slightly Serving Faster . . . 74
8.5.2 Slightly Responding Faster . . . 74
Ayse Aslan Combining Process Mining and Queueing Theory
8.5.4 With A More Efficient Routing . . . 76
9 Conclusions and Recommendations 79 9.1 Conclusions . . . 79
9.1.1 Conclusions From Current Efficiency Analysis by Process Mining . 79 9.1.2 Conclusions From Queueing Analysis . . . 80
9.1.3 Conclusions From Resolution Time Prediction . . . 80
9.2 Recommendations . . . 81
9.3 Further Research . . . 82
Bibliography 83 Appendices 87 1 Keywords and Abbreviations . . . 87
2 Queue Input Parameters and Queue Performance Analyses . . . 87
2.1 Queue Input Parameters and Mean Performance Measures of Delay 87 2.2 Queue Input Parameters and Mean Performance Measures of Op-erators . . . 87
List of Figures
1.1 Process Map of Incident Management . . . 3
1.2 Line 1 and Line 2 . . . 4
3.1 The Petri Net Obtained by Alpha Algorithm . . . 20
3.2 Subcontracting Work Network and Handover of Work Network . . . 23
3.3 Activity Frequencies with Inductive Visual Miner . . . 23
3.4 Flower Model of the Sample Log . . . 24
4.1 Overview of Research Approach . . . 28
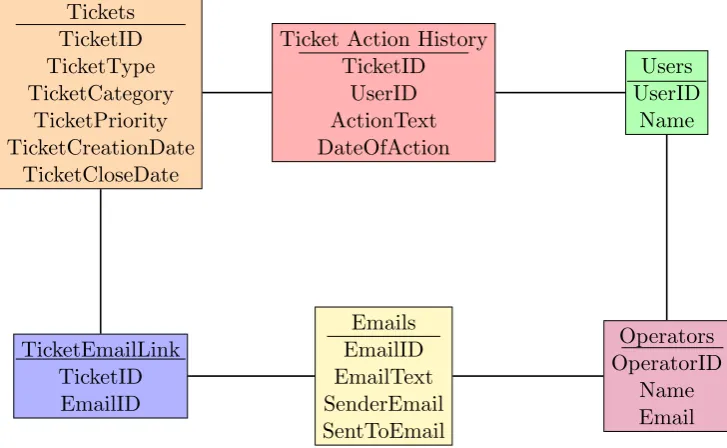
5.1 Database Diagram of Topdesk Tables . . . 32
5.2 Resolution and Assignment Emails on a Ticket . . . 33
5.3 Service Times of Tickets . . . 33
5.4 Number of Operators Involved In Resolution . . . 35
5.5 Resolution Percentages by Operators of ‘Laptop’ Tickets . . . 36
5.6 Dotted Chart of Tickets Over Time . . . 39
5.7 Dotted Chart of Priorities Over Time . . . 40
5.8 Dotted Chart of Laptop Category Tickets Over time . . . 40
5.9 Process Model with Inductive Visual Miner . . . 42
5.10 Process Model of Laptop Tickets . . . 43
5.11 Causal Activity Matrix: Operators as Activities . . . 46
6.1 Life-Cycle of a Ticket . . . 47
6.2 Queueing Network Model . . . 48
6.3 Dotted Chart of Activities by Operator A . . . 51
6.4 External Arrivals at Operators . . . 52
6.5 Arrivals at Operators . . . 53
7.1 Markov Chain of Operators . . . 58
7.2 Markov Chain of Delay . . . 61
List of Tables
1.1 Urgency Level Measurement . . . 5
1.2 Impact Level Measurement . . . 5
1.3 The Priority Table . . . 5
1.4 Target Resolution Times at Line 1 and Line 2 . . . 6
3.1 Plug-Ins in ProM . . . 19
3.2 A Sample Event Log . . . 20
3.3 Footprint of the Sample Log . . . 21
5.1 Basic Statistical Information of the Log . . . 34
5.2 Percentages of Tickets Meeting Targets . . . 37
5.3 Performance Measures of Laptop Tickets . . . 44
7.1 Basic Statistics of Queue Lengths of Ci0 Category Tickets . . . 65
7.2 Basic Statistics of Queue Lengths of Ci+ Category Tickets . . . 65
7.3 Basic Statistics of Mean Sojourn Times of Ci+ Category Tickets . . . 65
7.4 Mean Performance Analysis of Network . . . 66
8.1 SPN Predictions for ‘EZIS’ Category . . . 70
8.2 Percentages of ‘EZIS’ Tickets Meeting Upper Targets . . . 70
8.3 Minimum Resolution Times (hours) That Tickets of ‘EZIS’ Category Are Resolved Within . . . 71
8.4 Prediction Errors for ‘EZIS’ Tickets . . . 72
8.5 SPN Predictions for ‘Radiologie (CS)’ Category . . . 72
8.6 Prediction Errors for ‘Radiologie (CS)’ Tickets . . . 73
8.7 Percentages of ‘Radiologie (CS)’ Tickets Meeting Upper Targets . . . 73
8.8 Mean Number of Operators Involved in ‘EZIS’ and ‘Radiologie (CS)’ . . 73
8.9 Resolution Performance of ‘EZIS’ with Reduced Sojourn Times at Operators 74 8.10 Resolution Performance of ‘Radiologie (CS)’ with Reduced Sojourn Times at Operators . . . 74
8.11 Resolution Performance of ‘EZIS’ with Reduced Sojourn Times at Delay . 75 8.12 Resolution Performance of ‘Radiologie (CS)’ with Reduced Sojourn Times at Delay . . . 75
8.13 Resolution Performance of ‘EZIS’ with a New Good Operator . . . 76
8.16 Resolution Performance of ‘Radiologie (CS)’ with Only Operators Who
Have Positive Resolution Probabilities . . . 77
8.17 Average Number of Operators Involved in Resolution with Only Operators Who Have Positive Resolution Probabilities . . . 77
8.18 Operators ‘EZIS’ Category . . . 78
8.19 Operators ‘Radiologie (CS)’ Category . . . 78
A.2 Type 1 Operators . . . 88
A.3 Type 2 Operators . . . 90
1 Introduction
In this chapter, we introduce the subject of our research and state our motivations, objectives and research questions.
1.1 Incident Management Process
We describe the process of incident management at ICT department in LUMC. Incidents are the unplanned interruptions or reductions in the service quality of the ICT services. The process of incident management manages the life-cycle of all incidents.
With the ultimate aim of minimizing the negative effects to LUMC, fixing the disrup-tions as soon as possible constitutes the main goal of the incident management. There are several underlying goals of the incident management. In order to shorten the dis-ruptions solving the incidents during the first contact with the service desk constitutes the first underlying goal. The second underlying goal is making use of the knowledge items in the knowledge system in the solution of common questions and service disrup-tions. The last underlying goal is making use of the standard solutions in the solution of common questions and service disruptions.
There are several variants of incident management process. The incidents that have great impact and/or urgency are major incidents and for them the variant of major incident process applies. For the incidents that involve security issues, the variant of security incident process applies.
1.1.1 Key Performance Indicators
Several key performance indicators (KPIs) are set by ICT department to determine if the goals of the incident management are met. In defining the KPIs, the following values are utilized.
• Number of incidents that are resolved in the first line
• Number of incidents that are resolved within the target resolution times • Number of incidents that stay open longer than one month
• Number of major incidents vs. number of incidents
• Number of incidents which the knowledge system offers a solution
• KPI 1: Percentages of the incidents that are resolved in the first line
Gives insight into what extent the hospital employees are helped directly and gives insights into what extent service desk employees are skilled.
• KPI 2: Percentages of the incidents that are resolved within the target resolution times
Gives insight into the efficiency of the incident management process.
• KPI 3: Percentages of the incidents that have stayed open for longer than one month
Identifies the possible bottlenecks in the resolution of the incidents.
• KPI 4: Percentages of the major incidents
Gives insight into the extent to which the management is done in a good way.
• KPI 5: Percentages of the incidents that are resolved using the knowledge system Gives insights into the quality of the knowledge system.
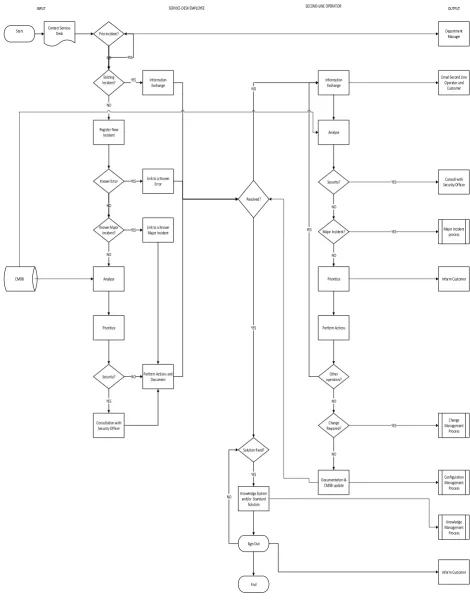
1.1.2 Overall Process Flow
The overall process map of the incident management is given in figure 1.1. This diagram presents the handling of the incidents through the service desk employees at line 1 and the operators at line 2. Other than the service desk employees and the operators at line 2, the security officer is involved in the handling of the incidents that involve security issues.
The service desk employees try to relate incidents to the known incidents, make use of the knowledge system and the standard solutions in resolving the incidents. If a resolution is found at first line for an incident, the incident is not forwarded to the second line operators. The operators at second line can forward an incident to the other operators if necessary.
Ayse Aslan Combining Process Mining and Queueing Theory
Start Contact Service-Desk Prio Incident?
NO Existing
Incident? YES Information Exchange NO Register New Incident Known Error NO Analyze Prioritize Security? YES Consultation with Security Officer
NO Perform Actions and Document YES Link to a Known Error
Known Major Incident?
NO
YES Link to a Known Major Incident
CMDB Resolved? Information Exchange YES Solution fixed? YES Knowledge System
and/or Standard Solution Sign Out End NO YES NO Analyze Security? NO Major Incident? NO Prioritize Perform Actions Other operators? NO Change Required? YES NO Documentation & CMDB update Department Manager
Email Second Line Operator and
Customer
Consult with Security Officer YES
YES Major Incident process
[image:17.595.89.560.103.718.2]Inform Customer YES Change Management Process Configuration Management Process Knowledge Management Process Inform Customer INPUT SERVICE-DESK EMPLOYEE SECOND-LINE OPERATOR OUTPUT
Figure 1.1: Process Map of Incident Management
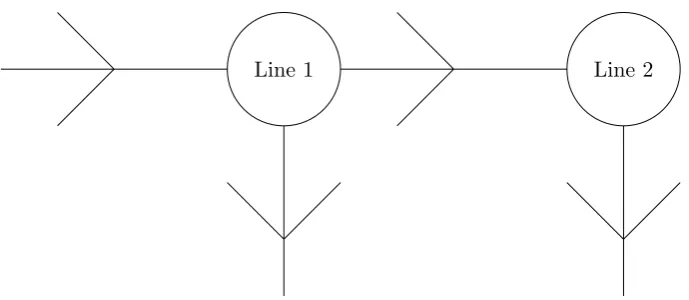
Line 1 Line 2
Figure 1.2: Line 1 and Line 2
1.2 ICT Ticket Resolution Process
In this section, we describe the process that we model and analyze in our research. This process is the ICT ticket resolution process which serves the ICT requests of the hospital employees at LUMC. The tickets report incidents and tickets are resolved by managing the incidents they relate by the ICT department. In our research, we refer incidents as tickets and refer incident handling/resolution as ticket handling/resolution.
Hospital employees at LUMC create tickets via an email, a call or a visit to the service desk. ICT serves the tickets of the hospital employees at two lines: first line and second line. First line is the first place that all tickets are registered and handled by the service desk employees, while the second line is the place where specialist operators and operator groups work. The tickets are escalated from first line to operator groups/operators at second line if the tickets could not be resolved in first line.
ICT operators can have roles as a first line operator or/and as a second line operator depending on their specializations. For instance, a service desk employee who has both line 1 and line 2 operator role, serves the tickets at first line as a first line operator, and at the same time serves the tickets at second line which belongs to a category that he/she is specialized in as a second line operator. ICT operators may not belong to any operator groups and may belong to more than one operator groups.
The escalation of a ticket from first line to second line can be directly to an operator or can be to an operator group at second line. If a ticket is directly escalated to an operator at second line, the resolution service of the ticket begins immediately, where in the case that the ticket is escalated to an operator group at second line, the resolution service of the ticket does not start immediately and the ticket waits to be assigned to an operator in the operator group. Each operator group at second line exercises different policies to assign the tickets to the operators within the group. Some of the operator groups let their operators choose the tickets that they would like to handle, while some of the operator groups directly assigns the tickets to the operators inside the group.
infor-Ayse Aslan Combining Process Mining and Queueing Theory
Urgency Description
High One can not continue working
Middle One can continue to work but there is a serious disruption of the normal process Normal One can continue to work with some disruption of the normal process
Table 1.1: Urgency Level Measurement
Impact Description
High The incident affects all LUMC
Middle The incident affects one or more departments Normal The incident affects one or more persons
Table 1.2: Impact Level Measurement
mation is taken for the purposes of classifying and determining the priority levels of the tickets. The information about the object (software, hardware, machine, account, etc.) relating to the tickets is used to classify the category and subcategory of the tickets, whereas the information of urgency and impact level of the tickets are used to deter-mine the priority levels of the tickets. Urgency is measured by the level of disruption in the work process, whereas impact is measured by the extent of the disruption. For instance, a ticket relating to security issues carries high urgency as it is vital to resolve the ticket immediately and a ticket which relates to a malfunction of a MR machine has a high impact level as this type of malfunction affects patients, doctors, nurses, etc. at the same time. Both the category information and the priority information plays an important role in the flow of the tickets. The category information plays an important role as if a ticket is escalated to second line, the ticket is transferred to an operator or operator group who is specialized in the category of the ticket. The priority information is important as the tickets carrying high priorities are prioritized by the operators. The priority levels of the tickets affect the resolution times of the tickets as ICT has target resolution times for the tickets by priority levels.
The tickets that are escalated to second line are routed between operators/operator groups until they are resolved. If an operator who deals with a ticket decides that he/she can not resolve the ticket or there is a permission, authority or knowledge required from other operators/ operator groups for the resolution of the ticket, the operator can transfer the ticket to other operators/operator groups. When a ticket is transferred from
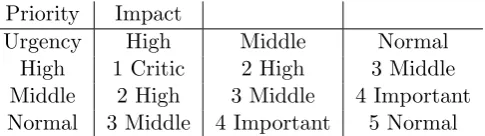
Priority Impact
[image:19.595.161.404.598.666.2]Urgency High Middle Normal High 1 Critic 2 High 3 Middle Middle 2 High 3 Middle 4 Important Normal 3 Middle 4 Important 5 Normal
Table 1.3: The Priority Table
Priority First Line Resolution Time Second Line Resolution Time
Critic 15 mins 2 hours
High 30 mins 1 day
Middle 1 hour 3 days
Important 1 day 1 week
Normal 1 week 1 week
Table 1.4: Target Resolution Times at Line 1 and Line 2
an operator/operator group to another operator/operator group, the ticket is not served until the operator/operator group who the ticket is transferred to responses, thus the ticket’s resolution is delayed.
In our research, we consider KPI 2 as a measurement to assess the performance of the ticket resolution process and therefore we focus on the resolution times of the tickets. The resolution time of a ticket consists of the resolution service times at the operators who the ticket visits along its path to resolution and the delay times when the ticket is transferred from an operator group/operator to another operator group/operator.
1.3 Motivation
• Motivation of the ICT Department in LUMC
The topdesk system, the platform where the tickets are registered and resolved by the operators, that serves the employees of LUMC has been keeping the recordings of the activities on the tickets since 2005. ICT department has the motivation to mine the data of historical activities on the tickets to investigate the ticket handling process and reach results that will improve their process so that they better serve the tickets of hospital employees.
• Applying Process Mining to a Different Process Inside a Hospital Process mining as a data science tool which bridges data mining and business pro-cess intelligence makes it possible to discover propro-cesses and extract knowledge from event logs. As it is already successfully in action in gaining insights about health-care processes from relevant patient data and hospital records, carrying process mining to an other process in a hospital, to a service process in an ICT depart-ment inside a Hospital, constituted a motivation for us. Our motivation is to make use of process mining to understand what is actually happening in the ICT ticket resolution process in LUMC. Process mining outputs a process model that is extracted from the data, organizational relations between resources and mean performance measures by taking an event log as input. We aim to benefit from every aspect that process mining provides to better understand a process.
Ayse Aslan Combining Process Mining and Queueing Theory
The tickets are prioritized before handling, and each priority level has a target resolution time at line 1 and line 2 that is set by ICT. The department reports that in many cases these targets aren’t met. Therefore, our main motivation of this research is to make resolution time predictions for the tickets to support the ticket handling process by providing the ticket makers accurate resolution time predictions that will lead to customer satisfaction and prevent disappointment that occurs when targets are not met.
1.4 Objective
The main objective of this research is to produce resolution time predictions for the tick-ets by taking a queueing theory perspective on the process of ticket resolution of ICT department in LUMC. Our aim is to present a methodology which incorporates pro-cess mining and queueing theory techniques to provide support for the ticket resolution process. In our research, we reveal answers for the following research questions.
Main Research Question: How long will an arriving ticket given its category and priority stay open?
Research Sub-Questions: There are several sub-questions to be tackled in order to make resolution time predictions for tickets.
• How is the flow of the tickets among operators/operator groups? • What are the routing probabilities between operators/operator groups? • What is the probability that an operator can resolve a ticket?
• How long does an operator serve a ticket? • How long does a ticket is delayed?
• How can the category and the priority of a ticket affect the above questions? • On average how long does a ticket stay in the system?
• Can the ICT department resolve the tickets within targets?
• How to improve the performance of the ticket resolution process in terms of meeting targets?
1.5 Thesis Outline
The incident management process which handles the incidents that arrive at ICT de-partment as tickets, the ticket resolution process which is the subject of our research, research questions, objectives and motivations are described in chapter 1. A literature review on the topics of process mining, ticket resolution, queueing theory with process mining and predicting times in processes is given in chapter 2. A brief introduction on
2 Literature Review
In this chapter, we present the reviewed literature that we consider relevant to our research. In our research, we aim to analyze a ticket resolution process in an ICT department and provide resolution time predictors to support the process. Our main objective of this research is to incorporate queueing theory and process mining to analyze and support the ticket resolution process. Therefore, we reviewed the literature on process mining, ticket resolution, queueing perspective process mining and techniques to predict time in processes.
2.1 Process Mining
Process mining can be applied to a variety of processes in healthcare, business, industry, etc. when an event log which contains the recordings of process instances is available. Here we present the literature on the applicability of process mining in discovering information from event logs about processes.
The work by Aalst et al. [30] demonstrates an application of process mining to a real-life process in one of the provincial offices of the Dutch Public Works Department. With taking control-flow, organizational and case perspectives, the processing of invoices sent to an office is analyzed. To mine for a process perspective, authors use a heuristic approach to deal with the noise and incompleteness of the log.
Process mining is a high-potential tool for gaining insights of healthcare processes which are mostly too complex to comprehend due to their dynamic, multi-disciplinary and ad-hoc nature. However, due to complexities of healthcare processes, it is difficult to obtain good process models with process mining for healthcare processes. A pro-cess mining methodology which uses sequential clustering to pre-propro-cess event logs is developed in [19] to identify regular and exceptional medical cases of clinical work-flow. Process mining is applied to a Dutch Hospital in [15] in ProM framework to gain knowledge about the care-flow of gynecological oncology patients. Related event logs are extracted from the hospital’s information system and used to perform process mining with control-flow, organizational and performance perspective. For control-flow perspec-tive mining, authors use Heuristic Miner to tackle the noisy data and to focus on main flow. Trace Clustering plug-in is applied to the log to split the data into several clusters. Social Network Miner is used to analyze relations between originators using handover of work metric. Dotted Chart and Basic Performance Analysis plug-ins are employed for performance perspective.
clinical reality that is seen in the event log and the clinical guidelines. The medical guidelines, de jure model, are repaired based on reality to obtain a de facto model with a methodology based on cross validation.
An another application of process mining is done in [23] for the test process of wafer scanners in ASML with ProM framework. Log inspection, filtering and process discovery are performed to analyze and suggest improvements for the test process.
Process mining is applied to provide on-line decision support in [18] for the running cases of a process by forecasting the future events. An event log which contains completed instances is used as a training set to learn a predictive clustering tree (PCT) off-line and the learned PCT-based process model is used to forecast the next events for running cases with an on-line manner.
In a study by Krinkin et al. [9] to predict traffic overload when a network topology changes in wireless mesh networks and to recommend redistributions, process mining is applied to extract information about the network topology.
In a study [14], the availability of medical data due to use of ICT tools in hospitals and the necessity of making use of this data to increase the efficiency of the healthcare processes are pointed out. Process mining is applied on two data sets, clinical data set and pre-hospital behavior data set, for stroke patients to gain meaningful insights about the processes. Process models of the treatment processes of two hospitals which show if the clinical guidelines are followed and where the process deviates from the clinical guidelines are extracted with process mining from the clinical data sets. Performance analysis plug-in in ProM is used to identify the bottlenecks in the pre-hospital behavior process. They conclude that process mining can provide interesting results regarding the processes within hospitals.
A study by Aalst et al. [34] demonstrates an application of process mining to detect security violations by analyzing audit trails. Alpha algorithm is used to mine a work flow (WF)-net from audit trails and ‘token’ game is played on the net for some cases to detect anomalies in the handling of the process. Conformance checking is done by comparing the fragments of the process with the extracted WF-net of the process. Authors conclude that process mining techniques such asα algorithm can be applied to check security.
In [24] it has been showed that process mining can be applied to obtain software pro-cess models from the Software Configuration Management Systems (SCM) which store information of the software processes. Software processes of a real project, ArgoUML, are mined with process mining techniques in ProM and some properties of the software processes are analyzed and verified.
Process mining is used in mining staff assignment rules in [13]. Decision tree learn-ing method is used to learn staff assignment rules by uslearn-ing organizational model and historical data as input.
Ayse Aslan Combining Process Mining and Queueing Theory
the processes. The one of the most meaningful insights about the processes is to find out if they comply with the reality. The process models that are mined with process discovery techniques are utilized to discover deviations from the pre-described processes and pre-defined guidelines.
In the literature, we find that ProM framework is the most common software for performing process mining. Apart from the process discovery and compliance checking plug-ins, performance plug-ins are commonly used in the literature to identify bottle-necks of the processes. In our research, we also use the process mining tools in ProM to perform process mining.
Process mining is applied in several healthcare processes inside hospitals to discover how the processes are actually executed, to learn where the processes deviate from clinical guidelines and to identify the bottlenecks of the healthcare processes. In our research, we aim to use process mining to gain insights of an ICT service process inside a hospital, the ticket resolution process at the ICT department in LUMC, from the historical data.
2.2 Ticket Resolution
Here we present the literature review on ticket resolution. We find that there are rare studies which analyze the ticket resolution processes of IT services and this literature mostly focuses on efficient routing of the tickets among groups. In this literature, Markov Models and Generative Models are used to model the routing of the tickets.
In a study [16], the problem of bouncing tickets among multiple expert groups is pointed out. A methodology to reduce bouncing of the tickets and thus improving the resolution time is presented. Using the content and the routing sequence of tickets, generative models that characterize the life-cycle of tickets are developed. From the content of the problems of the tickets that group solved previously for each expert group a resolution profile is built with Resolution Model. The transfer model that is presented in this work on the other hand considers ticket routing sequences to build the profiles of transfer of tickets between every two expert groups. Lastly, an optimized network model which uses both content and routing sequence of tickets is presented and a numerical approach is taken to get an approximate solution, the next expert group to route the ticket, for this model.
A hybrid methodology which uses both text content and routing sequence to make routing recommendations for new tickets based on the information gained in historical ticket data is developed in [29]. Here, improving the efficiency of ticket routing is mea-sured in terms of mean number of steps until the resolution. Their methodology, first identifies the content of a new ticket and finds a set of existing tickets which are similar in content, and then a weighted Markov model is created from the routing sequence of the tickets in this set.
Another study on efficient ticket routing by Shao et al. [28] provides a Markov Model that captures the ticket routing decisions by mining the ticket resolution steps without using the content data of the ticket. A search algorithm is given to make recommenda-tions based on the Markov Model.
Process mining is adapted to produce predictions for the performances of the ticket resolution instances in [6]. In this study, instead of relying on the typical activity labels of a ticket resolution process such as open/close a ticket, forward a ticket, or send a message, etc., or the individual workers involved in the resolution of the tickets, or the pre-defined groups of workers, authors discover data-driven groups which are the abstractions of the sequence of workers involved in the tickets from the log data. Their approach employs both resolution steps and context data of the tickets. The context data of the tickets are used to cluster cases. With clustered data-driven worker groups and clustered ticket cases, performance predictions are given for different scenarios of the ticket resolution process.
In our research, we do not consider the ticket content data, the description of the problem in the ticket and also the content of the activities that are performed by op-erators. We only make use of the resolution sequences, operators that a ticket visits on its path from start to resolution similarly to [28]. In all of the literature that we reviewed on ticket resolution, recommendations that aim efficient routing of the tickets are generated. However, making recommendations for ticket routing is out of the scope of our research, we only model the routing behavior and predict the resolution times of the tickets.
2.3 Queueing Theory and Process Mining
In our research, we aim to combine queueing theory and process mining. Here we review the literature which incorporates queueing theory and process mining to learn about the methods and approaches to incorporate these two concepts.
In a study [25] which presents methods for checking conformance and improving per-formance of scheduled multi-stage service processes, process mining is applied to discover a Fork/Join queueing network of the scheduled processes from the real data. Process mining techniques are incorporated in identifying the network structure, in estimating the routing mechanism, and in characterizing the server structures.
Process mining and queueing theory together are applied in [38] for a healthcare process. A method which uses process mining to discover a process model and queueing theory to analyze queue measurements such as queue length and waiting time per activity is described in this study. The process model is obtained by the Inductive Visual Miner tool in ProM. The methodology described in this study to extract waiting time for activities requires an event log with both start and end time of activities to obtain average service times from the process model. The average service time and the number of patients from the process model are used to obtain predictions for arrival rate, queue length and waiting time for each activity.
Ayse Aslan Combining Process Mining and Queueing Theory
the system load, number of customers in the queue, is included as context information. Queue length predictor and queue length Markovian predictor, queueing model predic-tors, are based on the G/M/n and G/M/n+M model, respectively. Two heavy traffic predictors are presented: last customer to enter service and head of line.
The study in [26] presents methodologies to extract queue lengths from an event log per activity when the event log misses timestamps such as enqueueing timestamps and/or service start timestamps of activities. They first partition the log based on duration of the activity with clustering, then loads are used to fit a phase type distribution to sojourn times by using Bayesian inference.
In studies [38], [27] and [26], process mining and queueing theory are integrated with an approach which uses process mining to discover a process model from an event log and regards each activity in the discovered process model as a queue. Mean queueing performance measures of the activity queues are used in [38] and [27] to provide pre-dictions for the queue lengths, waiting time, etc, of the activities. We find out that incorporation of process mining and queueing theory in [25] is not as direct as in studies [38], [27] and [26]. In [25], process mining is used to shape and compose a queueing model of the subject process.
2.4 Predicting Time
Here we present the literature on predicting time in processes. In the literature we reviewed on prediction models for processes, we find methods which are based on transi-tion systems, queueing theory, Markov models and regression analyses. Process mining is found to be a widely-used technique to obtain a process model of a process from the event log of executed instances. In some cases, machine learning techniques such as de-cision trees and support vector machines are incorporated to learn from process models to obtain likelihood measurements of executing a future activity. It has been observed that most of the studies concentrates on making predictions for running cases, not for arriving cases.
2.4.1 A Similar Process: Customer Contact Centers
The case process of our research is an ICT ticket resolution process. In this process, the service of an operator for a ticket consists of several text replies and this service is not continuous as a call. The processing of tickets by operators is close to the processing of emails by agents at customer contact centers in which customer contact is made via e-mails rather than calls. An arrived customer request via an e-mail to a customer contact center is handled among the agents at the contact center and the e-mail follows a path among the agents until an agent resolves the e-mail.
The processing of the incoming e-mails by the customers to a customer contact center is analyzed in [3] with a queueing network of agents who process the e-mails. With two-moment queueing approximations the network is analyzed and performance measures such as average number of e-mails in the system and average resolution time are obtained.
This study models the process as a queueing network of agents and gives the mean sojourn time in the system which can be regarded as a prediction for the stay of the arriving emails in the process. In our research, we can model the ticket resolution process as a queueing network of operators and obtain mean sojourn time of the system which we can provide as prediction for the resolution times of arriving tickets. The weakness of this prediction is that it does not consider the workload of the system.
2.4.2 Recent History Predictions
Recent delay history is used in [7] to make delay predictions for an arriving customer. The used estimators are: the delay of the last customer to enter service, the delay experienced by the customer at the head of the line, and the delay experienced by the customer to have arrived most recently among those who have already completed service are compared with the queue length estimator of delay.
The approach of using the recent history can be applied in producing predictions for the resolution time of the tickets by presenting the resolution time of the most recently resolved ticket as the prediction for the resolution time of an arriving ticket in an on-line manner. This approach considers the system workload by taking the recent history into account.
2.4.3 Process Mining Based Predictions
Process mining techniques are used in [31], [10] and [17] to produce prediction models that are trained with the historical data of the executed process instances. In these studies, remaining times of the running cases in the processes are predicted. In predicting the time perspective of the cases in processes, issues of predicting the future activities and predicting the activity durations are resolved with process mining and machine learning techniques.
When timestamp information exists in the event log, it is possible to take a time perspective in process mining. One of the first studies which focuses on time perspective is the study by Aalst et al. [31] which presents a transition system based methodology to predict remaining processing time for running cases. The transition system is generated from historical data of executed instances using event abstraction. A completion time prediction for a running case is made based on the average time to completion for the cases which are in the state which corresponds to the current state of the case.
Ayse Aslan Combining Process Mining and Queueing Theory
Several approaches which rely on process mining and machine learning are developed in [17] to predict the remaining processing time for running cases. The prediction methods are developed with simple regression, regression with contextual information and data-aware transition systems approaches. Event logs of past executed process instances are used for training, and prediction models are implemented in ProM framework as a plug-in.
2.4.4 A Stochastic Petri Net Prediction
An approach which relies on stochastic Petri nets and considers the passed time since the last event is presented in [20] to predict the remaining execution time. By replaying event logs on the Petri net, statistical information on the activity durations is collected to be able to fit statistic parametric and non-parametric distributions for the activity durations. This study presents a remaining time prediction for running cases for a given time based on past executed activities on the cases. The prediction algorithm starts with replaying a given running case on the Petri net to obtain the initial marking. For a pre-defined number of iterations, the algorithm gathers the remaining time simulation results and calculates the mean of all.
3 Process Mining
In this chapter, we introduce process mining to the readers. In the first sections, we introduce the types of process mining, the things that can be discovered by it and the tools to do it. An illustration of discovering information by process mining and quality criteria for the discovered process models are given at the last sections of the chapter.
3.1 What Is Process Mining?
Process mining as a new discipline is positioned between data mining and process mod-eling. The main aim of process mining is to extract information from event logs for discovery, monitoring and improving purposes for a real process [4]. Process mining shows what is actually happening in a process based on recorded instances of the pro-cess itself. The nepro-cessary ingredient for propro-cess mining is an event log which consists of cases, process instances, and events that are performed on cases. With the existence of event logs of a process, four types of process mining can be conducted: discovery, conformance, enhancement and operational support.
Discovery Process mining can be used to discover a process model only from the observed behavior in the event log. A process model describes the steps that are taken in the process. A common algorithm for discovery is the alpha-algorithm which produces a Petri net, a common process modeling language that allows to model concurrency, of the process from an event log. This algorithm is able to produce a Petri net without using any a-priori knowledge. In case the event log contains information about the resources who perform activities, social-networks which reflect how people work together can be found as well [4].
ConformanceProcess mining is also used for checking if the existing process model conforms with the event log of the process. Conformance checking can be used to detect, locate and explain deviations from the guidelines and rules that are described in the existing process model [4].
Enhancement Here process mining is used to improve the process model by pro-jecting the information extracted from the log into the process model. The model is enhanced by making it closer to the reality [21].
Operational SupportDifferently from other 3 types of process mining, operational support is not done offline. Here, operational support can be given to running cases in an online setting through detecting deviations and generating alerts, predicting future and informing, and recommending activities or resources [33].
• Control-Flow PerspectiveThis perspective aims to produce a Petri net or some other notation that describes the control-flow of activities based on the flow of cases in a log. Focus is on the ordering of activities and the dependencies between activities [4].
• Organizational PerspectiveThis perspective focuses on the resource, the per-son/department who executes the activity. When an event log contains resource information of the events, role of resources and relations between resources can be extracted with organizational perspective [4].
• Case Perspective Case perspective focuses on the case properties. A case can be characterized by its activity path or by the resources performing activities [4]. • Time PerspectiveWhen an event log includes information about the timestamp of events, with the time perspective one can discover bottlenecks of the process, analyze service times of activities and predict the remaining time for running cases [4].
3.2 What Can Process Mining Discover?
There are several questions about the processes that process mining can answer from event logs which possess at least a case identifier, an activity name, a timestamp, and a resource who performs the activity for each event. The listed questions in [36] are grouped by perspective as the following.
• Control-Flow Perspective
– How are the cases actually being executed? – Which activities precede which other activities? – Are there concurrent activities?
– Are there loops?
• Organizational perspective
– How many people are involved in a specific case? – Who subcontracts work to whom?
– Who work on the same activity?
– How many transfers happen from one role to another role? – What is the communication structure among people? • Case perspective
– What are the most frequent paths?
Ayse Aslan Combining Process Mining and Queueing Theory
Plug-in Name Function
Alpha Miner Discovers a Petri net from an event log by using theα- algorithm Heuristic Miner Discovers a C-net
Fuzzy Miner Discovers a fuzzy miner
Transition System Miner Discovers a transition system from a given event log with chosen trace abstraction Transition System Analyzer Makes a prediction for the remaining time based on transition system
Log Filter Filters the log based on a criterion Dotted Chart Analysis Represents all events in a dotted chart Social Network Miner Discovers social network between resources
Table 3.1: Plug-Ins in ProM
• Time perspective
– What is the average, minimum, maximum throughput of cases? – What is the average service duration for an activity?
– How much time is spent between two activities?
3.3 Tools
The ProM framework which is developed by Eindhoven University of Technology is an open-source standard process mining platform which includes all types of mining techniques. Due to its high functionality, ProM is an expert tool for process mining, however there exist other commercial process mining tools like Disco such that non-experts can perform mining too. ProM is a plug-able environment which uses MXML and XES as input format for event logs. It is also possible load csv files as there is a conversion tool which converts csv files to XES. The most widely used mining techniques which are plugged in ProM are: alpha-algorithm, heuristic miner, fuzzy miner, genetic miner, social-network miner, etc. Apart from mining plug-ins, there are other plug-in tools in ProM for loading, converting, filtering and splitting logs and also for visualizing logs [4]. Some of the present mining plug-ins in ProM 6 which are mentioned in [4] are given in table 3.1.
3.4 From Event Logs to Process Discovery
Event logs can be considered as the starting point of process mining. Basically, an event log is defined as the multi set of traces while the activities that are executed on a case define the trace of the case. Apart from the activities and the related case, often event logs contain information regarding the resources, persons who perform the activities, and the timestamp of the events, preferably the start and end time of the activities [33]. A sample event log is created to illustrate the application of process mining with ProM on extracting information from an event log. First thing we do is to apply alpha algorithm, one of the most common process model discovery algorithms, to obtain a Petri net of the process from the recorded process instances in the log.
case id activity timestamp resource 1 A 2017-03-17 08:00:12 R.1 2 A 2017-03-17 10:20:13 R.2 1 B 2017-03-17 16:50:10 R.3 3 A 2017-03-17 12:12:23 R.1 2 C 2017-03-17 13:45:56 R.4 3 B 2017-03-17 14:16:78 R.3 1 D 2017-03-17 18:00:23 R.1 2 D 2017-03-17 18:05:31 R.1 3 D 2017-03-17 18:10:13 R.1
Table 3.2: A Sample Event Log
Figure 3.1: The Petri Net Obtained by Alpha Algorithm
Definition 3.4.1. A Petri net is a tripleN=(P,T,F) where
• P is the finite set of places, • T is the finite set of transitions,
• F ⊆(P×T)∪(T ×P) is the set of directed edges describing the flow relations. The Petri net in figure 3.1 summarizes the behavior of the process that is observed in the log. In this process, all cases start with activityA, and then either activityB or activityC follows. Lastly, activityD is executed before the case closes.
The α algorithm, one of the first process discovery algorithms that is proposed by Aalst et al. [32] discovers a process model of a given log by discovering the ordering relations between the activities that are performed in the process. We describe how this algorithm discovers the Petri net in figure 3.1 from the sample event log in table 3.2.
α algorithm discovers relations between activities from the traces in a log by defining the following ordering relations between activities [4].
Ayse Aslan Combining Process Mining and Queueing Theory
• Direct Succession: a >Lb if and only if there is a trace in whichais followed by
b.
• Causality: a→Lbif and only ifa >Lband notb >La, in some casesais followed
by bbutb is never followed bya.
• P arallel: a||Lb if and only if a >L b and b >La, in some casesa is followed byb
and in some casesb is followed bya.
• Choice: a#Lb if and only if not a >L b and not b >L a, a is never followed by b
and bis never followed bya.
According to these relations we obtain the footprint of our log as the following.
A B C D
A # → → #
B ← # # →
C ← # # →
[image:35.595.223.336.314.385.2]D # ← ← #
Table 3.3: Footprint of the Sample Log
α algorithm uses the footprint of a log to discover process patterns that are required to construct a process model.
a b
sequence patterna→b
a
b
c
XOR-split pattern a→b,a→c, and b#c
a
b
c
XOR-join pattern a→c,b→c, and a#b
a
b
c
AND-split patterna→b,a→c, andbk|c
a
b
c
AND-join patterna→c,b→c, andakb
From the footprint of the sample log,αalgorithm discovers a XOR-split pattern among the activitiesa,b and c asa→b,a→c, and b#c, and a XOR-join pattern among the activitiesb,c, and dasb→d,c→d, and b#cthat result in a Petri net in figure 3.1.
Ayse Aslan Combining Process Mining and Queueing Theory
Figure 3.2: Subcontracting Work Network and Handover of Work Network
Process mining is also used for making performance analysis. We mine our event log with the inductive visual miner plug-in in ProM to find the frequencies of the activities.
Figure 3.3: Activity Frequencies with Inductive Visual Miner
3.5 Quality in Process Model Discovery
In this section, we discuss the quality criteria of discovered process models from event logs with process discovery algorithms.
LetL be an event log of instances of a process. A process discovery algorithm maps
L onto a process model M which represents the behavior seen in L. The quality of a discovered process model M is measured by how goodM represents the behavior seen inL. The four main quality criteria for discovered process models that are described in [5] are the following.
Fitness: M allows the behavior seen inL. M is a good fitting process model if M can replay most of the cases inL.
Precision: M is precise such that it does not allow behavior that is completely unrelated to the behavior seen in L.
Generalization: M generalizes the behavior seen inL.
Simplicity: M is simple such that it is the simplest process model that can explain the behavior seen in L.
start start end end
A B
C D
Figure 3.4: Flower Model of the Sample Log
A good process model which represents the behavior seen in an event log can be discovered if the event log contains the representative behavior. An event log which contains infrequent behavior or does not contain enough to describe the behavior is considered as less representative. Event logs which are not able to represent the behavior of the processes are a challenge for the process discovery techniques.
There is a trade-off between the quality criteria of discovered process models from event logs. It is difficult to balance these four quality criteria. For instance, a model which overly simplifies lacks in fitting and precision, and model which is perfect in fitness often lacks simplicity [5].
Let represent the sample log given in table 3.2 as L={< A, B, D >2, < A, C, D >1}. We output a process model forLwhich allows every possible behavior among all activities seen in L and name it flower process model as the shape resembles a flower. The flower process model of the sample log is described in figure 3.4. We compare the process model which α algorithm discovers in figure 3.1 and the flower process model with these four quality criteria. The two instances seen in the log, < A, B, D > and
< A, C, D >, fit in both models, so both models are perfect in fitness. The model that α algorithm discovers is more precise than the flower process model as the flower model allows unrelated behaviors. Both models are simple. Both models are not good in generalization. The flower model over generalizes the behavior, basically any instance which involves activitiesA, B, C andD can be replayed. On the other hand, the model thatα algorithm discovers under generalizes as the allowed behavior is restricted to the behavior seen in the log.
All four quality criteria can be quantified with metrics. In the literature, several metrics are proposed and used for assessing the quality criteria: fitness, precision, gen-eralization and simplicity. An overview of the state-of-the-art metrics used to quantify quality criteria to asses discovered process models is given in [8].
Ayse Aslan Combining Process Mining and Queueing Theory
discovered process models [35]. The study [1] states the need for a common evaluation framework for assessing the outputted process models that are discovered with process mining algorithms and presents an evaluation framework that aims to benefit the process mining researchers by enabling to assess the results of process discovery algorithms and to discuss the validity of the results obtained by process mining techniques.
4 Research Approach
In this chapter, we state our research goals and describe our research methodology.
4.1 Research Goals
In our research, we aim to model the ticket resolution process at ICT department based on the historical data of ticket resolution activities, analyze the performance of the ticket resolution process in terms of resolution times and provide resolution time predictions for the arriving tickets. The main objective of our research approach is combining pro-cess mining and queueing theory to build a data-driven model of the ticket resolution process and making use of process mining techniques and mean queueing performance measures to investigate the efficiency of the ticket resolution process. Besides, in produc-ing resolution time predictions we aim to utilize mean queueproduc-ing performance measures. For an arriving ticket, we aim to produce predictions based on the ticket classification information of priority and category.
4.2 Research Methodology
From the starting point of our research, the event log containing ticket resolution ac-tivities, to making predictions for the ticket resolution times, we describe our research methodology in figure 4.1.
• Log Preparation: ICT department does not have an event log for the ticket resolution process. To perform process mining for the ticket resolution process, we define activities and compose an event log of ticket resolution activities.
• Process Mining: We aim to apply process mining to gain insights of the ticket resolution process from the data. We make use of process mining techniques for several purposes. Firstly, we use process mining to analyze the current performance of the ticket resolution process and to discover social relations among operators. Secondly, we use process mining to give us an idea of the actual process so that we can build a fit data-driven model of the ticket resolution process. Lastly, we use process mining tools in obtaining input parameters for our model of ticket resolution process.
ICT DBMS Event Log Process Insights
Process Insights
Queueing Network
Model
Queueing Performance
Measures
Queueing Performance
Measures
Timed SPNs per Category and Priority
Resolution Time Predictions Log Preparation Process Mining
Modelling Queueing
Analysis
SPN
[image:42.595.137.492.247.519.2]Representation Simulation
Ayse Aslan Combining Process Mining and Queueing Theory
• Queueing Analysis: We obtain performance measures about the ticket resolution process by performing queueing analysis and obtaining mean queueing performance measures.
• SPN Representation: We make use of stochastic Petri nets (SPNs) in our queue-ing perspective resolution time prediction approach which takes ticket priority and category information as inputs. We use the mean queueing performance measures of the queueing network model in order to take a queueing perspective resolution time prediction approach. We represent per ticket category and priority a SPN of the ticket resolution process to obtain resolution time predictions per ticket category and priority.
• Simulation: We simulate the stochastic Petri nets given an initial marking, ticket category and priority to produce resolution time predictions. Our approach of using SPNs to obtain resolution time predictions is based on the study in [20].
4.3 How Are Process Mining and Queueing Theory Combined?
In our research approach, process mining and queueing theory are combined in the modeling phase. We model the ticket resolution process as a queueing network model of operators and make use of process mining to structure the queueing network similarly to the study [25]. We use process mining tools to understand the structure of the servers, to obtain queueing input parameters such as transition probabilities and service times in the queueing network model. Process mining techniques are utilized in our research to build a data-driven queueing model of the ticket resolution process.
5 Process Mining Ticket Resolution
Process
In this chapter, we present the steps of performing process mining the ticket resolution process at the ICT department in LUMC and the analyses of the process by process mining tools in ProM.
5.1 Event Log Preparation
Process mining takes an event log as input and discovers information about the process based on the process instances in the event log. In order to apply process mining for a process, an event log which contains the instances of the process is required. So, the first step of process mining is preparing an event log.
In order to process mine the ticket resolution process, we need an event log which captures the activities performed for resolving the tickets. We obtain our event log by relating the tables which contain the activities that are performed on the tickets and the operators who performed the activities on the tickets in the database at the ICT department.
Our event log consists of activities that are performed on the tickets by operators and operator groups. Operators respond to the tickets in a platform called ‘TopDesk’. The activities on a ticket consist of emails and resolution activities, the text entries that are sent by operators to resolve the ticket. Email activities on a ticket are performed when communicating with the ticket notifier, the person who creates the ticket, to learn more about the problem, communicating with other operators to get their help on the resolution of the ticket and assigning the ticket to another operator or operator group.
Tickets TicketID TicketType TicketCategory
TicketPriority TicketCreationDate
TicketCloseDate
Ticket Action History TicketID
UserID ActionText DateOfAction
Users UserID
Name
TicketEmailLink TicketID
EmailID
Emails EmailID EmailText SenderEmail SentToEmail
Operators OperatorID
[image:46.595.133.497.103.327.2]Name Email
Figure 5.1: Database Diagram of Topdesk Tables
groups.
Each day lots of tickets arrive at the ticket handling system with different categories, priorities and types. Therefore, we include the ticket classification data, the type of the tickets, the priority level of the tickets, and the category of the tickets, in the log to perform filtering. Namely, our event log includes the tickets as cases, the operators/-operator groups who executed the tickets as activities, the timestamps of the activities and the emails that are executed on the tickets, and the ticket classification information such as the problem category, problem subcategory, ticket type and ticket priority.
Ayse Aslan Combining Process Mining and Queueing Theory
t0
A
ta1
B
tr1
B
tr2
B
ta2
C
tr3
C
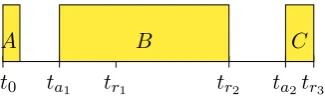
• t0: The ticket is registered by operator A. • ta1: The ticket is firstly assigned to operator B.
• tr1: The first resolution activity is executed by operator B. • tr2: The second resolution activity is executed by operator B. • ta2: The ticket is assigned to operator C.
[image:47.595.198.361.563.615.2]• tr3: The third resolution activity is executed by operator C and the ticket is resolved.
Figure 5.2: Resolution and Assignment Emails on a Ticket
The number of events that are executed per ticket and the amount of tickets that arrive over time leads to lots of records. In order to overcome this, we only take the data of the tickets that are created in a month, specifically the tickets that are created in January in the year 2015, to process mine and produce predictions.
Our log contains both operators and operator groups who perform activities on the tickets. In our research, we refer both operators and operator groups as operators for convenience.
In this research, we assume that the time that a ticket is assigned to an operator A
is the time that the service duration of the ticket at A starts. The service duration of the ticket at Aends with the last subsequent activity byA. Also, there exist resolution activities by operators which are not initiated by an assignment event. For those, we assume that the service time begins with the first resolution activity and ends with the last resolution activity before the ticket leaves the process or an another operator executes an activity on the ticket.
The service times of the operators are shown in figure 5.3 for the example ticket that is described in figure 5.2.
t0
A
ta1 tr1 tr2
B
ta2
C
tr3
Figure 5.3: Service Times of Tickets
In order to obtain the service times of operators on each ticket in the event log based on our assumptions, we apply the ProM plug-in ‘Merge Subsequent Events’ to prepare our log for process mining. This plug-in merges a trace ‘ABBBCC’ into ‘ABC’ and
composes service start time and service end time from the timestamp of the first event and the timestamp of the last event, respectively for each activity in the trace.
5.2 Analyzing Efficiency with Process Mining
Before moving to discovering process models and social relations with process mining, we analyze the log to investigate the current efficiency of the ticket resolution process with visualization plug-ins in ProM.
5.2.1 Basic Statistics
The log visualizer gives basic information about the log such as the number of cases, events and activities in the log, the minimum, maximum and average number of events and activities per case. We reach the following information from our log which contains operators who handle tickets as activities.
Number of Tickets Number of Events Number of Operators
5937 20518 255
Log Visualizer Min Mean Max Number of events per ticket 1 3 63 Number of operators per ticket 1 2 18 Table 5.1: Basic Statistical Information of the Log
5.2.2 How Many Operators Are Involved?
The number of operators involved in the resolution of the tickets is an indicator of the efficient routing of the tickets among operators and operator groups. For instance, in [29], the mean number of steps to resolution is used as a measure to define the efficiency of the ticket routing. Considering that the routing of a ticket to an operator who is not able to resolve the ticket is going to delay the resolution of the ticket, the number of operators involved per ticket is also an indicator of the efficiency of the ticket resolution process in terms of the resolution time.