Towards successful mass customization strategies in Dutch house building: An application of the motivation opportunity ability framework to investigate the customer value of houses customized with a product configurator
79
0
0
Full text
(2) University of Twente Towards successful mass customization strategies in Dutch house building An application of the motivation-opportunity-ability framework to investigate the customer value of houses customized with a product configurator. 1st. Supervisor: Dr.ir. E. Hofman 2nd. Supervisor: Dr. M. de Visser External academic supervisor: Prof.dr. E.J. Nijssen Company supervisor: MSc. J. Slaghekke. Author: R. Swanenburg S1019120. April 1st 2016.
(3) Abstract In many industries, mass customization is accepted as a successful way to create a competitive advantage, thanks to the resulting balance between production efficiency and customer value. An important part of a mass customization strategy is the interface that allows customers to configure a product. A frequently used interface is an on-line configurator that allows customers to configure a product by selecting options that are pre-designed by a company. In house building, the value of mass customization is recognized, but little successful implementations are known. In addition, the value of using of a house configurator has not been studied before. Therefore, the objective of this study is to empirically investigate the customer value of a mass customization concept for houses by performing an on-line experiment with a configurator. To accomplish this the focus of this study is twofold. First, drivers of customer value that are based on the motivation-ability-opportunity (MOA) framework are investigated and tested. Second, the difference between two configurator designs is studied. Respondents, recruited from a large database of potential house buyers, designed a house with an on-line configurator and evaluated their design in a survey. They were randomly assigned to either a customization via starting solutions (CvSS) or attribute-by-attribute (AbA) customization approach. These two groups were compared to a control group that had to evaluate a standardized house design. The motivation measure ”process enjoyment”, opportunity measure ”design freedom” and ability measure ”ease of use” correlated with the two dependent variables, preference fit and purchase probability. After hierarchical regression analysis ”design freedom” was found a predictor for preference fit. In addition, ”process enjoyment” was a predictor for both dependent variables. This means that the measures of the MOA framework can only be partly applied to evaluate the customer value of configurator based mass customization concepts in the Dutch house-building industry. Many of the positive aspects of configurators are retained in the case of house design. However, because buying a house differs from buying small customizable products, not all previously studied aspects of configurators can be applied to the house building industry. This has to be taken into account when designing future configurators..
(4) Preface One year ago I had my first meeting with the marketing and the innovation manager from building company Plegt-Vos. They told me about their new concept and that they wanted to know if it had potential. However, at the time this ’concept’ was no more than a few PowerPoint slides and the knowledge that it should be technologically possible to implement it. Although it took a lot of time, this gave me the opportunity to be present during the whole development process, from the meetings where the customization options were chosen to the development of the product configurator. I was involved with a lot of parties, the building company, the company that developed the configurator and the company that provided the database. Overall an interesting and valuable experience. Of course, I want to thank each of them for their role in my research, their comments and efforts that made it all possible. Then I want to thank my supervisors, Erwin Hofman and Matthias de Visser for reviewing my final work. In addition, I want to thank Ed Nijssen from the university of Eindhoven. Together with my first supervisor Erwin, he brought up lots of interesting ideas and critically reviewed everything I wrote. Also, many thanks to Brit and Stefan for reviewing my thesis, you have definitely won the best friend and boyfriend award! And thanks to Rens for being the best company during the infinite study (and tea!) sessions at the university. Unfortunately, my time as a student has come to an end, but it sure was the best time of my life... so far. Thanks to all of the great people I met and adventures we have been through in the past years. Let us continue having many more in the future!. 2.
(5) Contents 1 Introduction 1.1 Innovation in the house-building industry: Modular building . 1.2 Research motivation and aim . . . . . . . . . . . . . . . . . . 1.3 Central research questions and sub questions . . . . . . . . . 1.4 Report outline . . . . . . . . . . . . . . . . . . . . . . . . . .. . . . .. . . . .. 7 7 8 9 9. 2 Theoretical framework 2.1 Mass customization as manufacturing strategy . . . . . . . . . . 2.1.1 The value of customization: A paradigm shift . . . . . . . 2.1.2 Mass customization practices in house-building . . . . . . 2.2 The mass customization interface . . . . . . . . . . . . . . . . . . 2.2.1 Mapping variation preferences. . . . . . . . . . . . . . . . 2.2.2 Managing choice complexity. . . . . . . . . . . . . . . . . 2.2.3 The use of a product configurator for mapping preferences and managing choice complexity . . . . . . . . . . . . . . 2.3 Assessing customer value: An application of the MOA framework 2.3.1 Application of the framework . . . . . . . . . . . . . . . . 2.4 Conceptual model . . . . . . . . . . . . . . . . . . . . . . . . . .. 10 10 10 12 14 14 14. 3 Method 3.1 Research design and sample . . . . . . . . 3.2 Study development . . . . . . . . . . . . . 3.2.1 Concept and interface development 3.2.2 Measurement instrument . . . . . 3.2.3 Measurement items . . . . . . . . .. 21 21 23 23 24 24. . . . . .. . . . . .. . . . . .. . . . . .. . . . . .. . . . . .. . . . . .. . . . . .. . . . . .. . . . . .. 4 Results 4.1 Preliminary analyses, descriptive statistics and correlations . . . . . . . . . . . . . . . . . . . 4.1.1 Preliminary analyses . . . . . . . . . . . . . . . . . . 4.1.2 Descriptive statistics . . . . . . . . . . . . . . . . . . 4.1.3 Correlations . . . . . . . . . . . . . . . . . . . . . . . 4.2 Hierarchical multiple regression to test the applicability of MOA framework . . . . . . . . . . . . . . . . . . . . . . . . 4.3 Group comparisons . . . . . . . . . . . . . . . . . . . . . . . 4.3.1 Comparison CvSS vs. AbA customization . . . . . . 4.3.2 Comparison the research conditions . . . . . . . . .. 3. . . . . .. . . . . .. . . . . .. 15 16 17 20. 30 . . . . . . . . . . . . the . . . . . . . . . . . .. 30 30 32 34 35 38 38 39.
(6) 5 Discussion 40 5.1 Theoretical implications . . . . . . . . . . . . . . . . . . . . . . . 40 5.1.1 Finding a suitable measure for predicting customer value in on-line experiments with high cost products . . . . . . 40 5.1.2 Application of the MOA framework . . . . . . . . . . . . 40 5.1.3 The use of a product configurator . . . . . . . . . . . . . 42 5.2 Managerial implications . . . . . . . . . . . . . . . . . . . . . . . 42 5.2.1 Assessing the feasibility of a mass customization concept . 42 5.2.2 Product configurator design . . . . . . . . . . . . . . . . . 42 5.3 Limitations and future research . . . . . . . . . . . . . . . . . . . 43 6 Conclusion. 44. References. 45. Appendices. 50. A Bootstrapped correlations. 51. B Mailing. 52. C Questionnaire 1. 54. D Questionnaire 2. 58. E Questionnaire 3. 67. F Example standardized house design. 74. G Screenshots product configurator: CvSS vs. AbA customization 76. 4.
(7) List of Figures 2.1 2.2 2.3. . . . . . . . . . . . . . . . . . . . . based mass cus. . . . . . . . . . . . . . . . . . . .. 12 13. 2.4. Optimization of the cost-value trade-off . . . . Standardization vs. customization . . . . . . . Determinants of customer value for configurator tomization strategies . . . . . . . . . . . . . . . Conceptual model . . . . . . . . . . . . . . . .. 3.1 3.2 3.3. Experimental conditions . . . . . . . . . . . . . . . . . . . . . . . Procedure configurator experiment . . . . . . . . . . . . . . . . . Data collection procedure . . . . . . . . . . . . . . . . . . . . . .. 22 22 23. 4.1 4.2. Missing options . . . . . . . . . . . . . . . . . . . . . . . . . . . . Mean differences . . . . . . . . . . . . . . . . . . . . . . . . . . .. 33 39. 5. 16 20.
(8) List of Tables 2.1 2.2 2.3. Concept definitions . . . . . . . . . . . . . . . . . . . . . . . . . . 11 Characteristics of mass production versus individual customization adopted from Thuesen et al., (2009) . . . . . . . . . . . . . . 12 Variation preferences adopted from Hofman et al., (2006) & Schoenwitz et al., (2012) . . . . . . . . . . . . . . . . . . . . . . . . . . . 14. 3.1 3.2 3.3 3.4. Measurement items Control variables . Practical measures Dummy variables .. . . . .. . . . .. . . . .. . . . .. . . . .. . . . .. . . . .. . . . .. . . . .. . . . .. . . . .. . . . .. . . . .. . . . .. . . . .. . . . .. . . . .. . . . .. 26 28 29 29. 4.1 4.2 4.3 4.4 4.5 4.6 4.7. Factor analysis . . . . . . . . . . . . . . . . . . Means and standard deviations . . . . . . . . . Mean importance customization options . . . . Pearson correlations . . . . . . . . . . . . . . . Regression analysis purchase probability . . . . Regression analysis preference fit . . . . . . . . Mean differences CvSS vs. AbA customization. . . . . . . .. . . . . . . .. . . . . . . .. . . . . . . .. . . . . . . .. . . . . . . .. . . . . . . .. . . . . . . .. . . . . . . .. . . . . . . .. 31 32 33 34 36 37 38. A.1 BCa 95% confidence intervals . . . . . . . . . . . . . . . . . . . .. 51. 6. . . . .. . . . .. . . . .. . . . .. . . . .. . . . .. . . . .. . . . ..
(9) Chapter 1. Introduction The construction industry is often seen as a sector which lags behind in innovation (Dewulf, van Egmond, & Mohammadi, 2014). A strong culture of adapting and implementing well-known concepts, seems to keep construction companies from creating innovations (Yusof, Kamal, Kong-Seng, & Iranmanesh, 2014). Another explanation for the absence of innovativeness can be contributed to the lack of standardization in production processes, because of the customer-bound projects that have a strong need for tailored designs. For this reason construction companies often fail to improve their productivity and stick to traditional strategies (Dewulf et al., 2014). Focusing on house-building in particular, companies within this industry are challenged to strike a balance between the traditional focus on reducing construction costs and improving customer value. A promising strategy for creating this balance is mass customization (Barlow & Ozaki, 2005; Halman, Voordijk, & Reymen, 2008). Mass customization in the house-building industry can be defined by the company’s ”...ability to design and manufacture customized houses at mass production efficiency and speed” (Nahmens & Bindroo, 2011a). A well-designed mass customizable house could be a way to overcome the customer sacrifice gap which could be an important competitive advantage. The sacrifice gap can be defined as the gap between what the manufacturer offers and what the customer desires (Gilmore & Pine 2nd., 1997).. 1.1. Innovation in the house-building industry: Modular building. A recent development that increases the opportunity for creating mass customization strategies, is modular building. According to Halman et al. (2008), modularity in house-building refers to the way in which parts of the house can be decoupled into subsystems with standardized interfaces. These subsystems are highly independent and therefore can be produced separately. Where traditional house-building used to take place on-site, the use of decoupled production strategies revealed opportunities to produce prefabricated modules and transport them to the site after completing them in a factory. Using this strategy, a house can almost completely be produced off-site (Pan,. 7.
(10) Gibb, & Dainty, 2008). Previous studies showed that an industrialized production strategy has several advantages, such as achieving high product quality, reducing on-site safety and health risks, and minimization of the production time (Pan et al., 2008; Huang, Krawczyk, & Schipporeit, 2006). Modularization does not only decrease the complexity of the house design, but also enables house-building companies to deal with the increasing demand for large variety. This manifests itself in an increased possibility for housebuilding companies to offer customizable house designs to their customers. Customization can be offered in the subsystems with a high need for variety, while subsystems with a lower need for variety can be standardized, leading to a decrease in costs and production time (Barlow et al., 2003; Hofman, Halman, & Ion, 2006; Halman et al., 2008). When successfully implemented, this manufacturing strategy allows to function as a mass customization strategy. One of the current examples of successful mass customization practices in house-building nowadays can be found in Japan. In the Japanese industry, prefabricated components create the opportunity for house-building companies to offer variety while simultaneously standardizing parts of their production process (Barlow & Ozaki, 2005). Unfortunately, many building companies worldwide fail to follow the Japanese industry in efficiently integrating the customer preferences into their production process. Therefore, the house-building industry is still far away from calling itself successful in implementing mass customization strategies (Barlow et al., 2003).. 1.2. Research motivation and aim. In current research the value of mass customization strategies is broadly recognized, both in general and in house building (e.g. Hofman et al. (2006); Halman et al. (2008); Franke, Keinz, and Steger (2009a); Nahmens and Bindroo (2011b)). Additional research on mass customization strategies in house building provides insight in the customer preferences (Hofman et al., 2006; Schoenwitz, Gosling, Naim, & Potter, 2014) that could help building companies to develop the solution space (the customization options) that is offered to customers. However, an often studied subject in mass customization research in other industries (e.g. von Hippel and Katz (2002); Franke and Piller (2004); Franke, Schreier, and Kaiser (2009); Franke and Schreier (2010); Goduscheit and Jrgensen (2013); Grosso, Trentin, and Forza (2014); Trentin, Perin, and Forza (2014)) is not yet investigated for house building: The role of the product configurator in the assessment of customer value. Therefore, the primary objective of this study is to empirically investigate the customer value of a mass customization concept in Dutch house building by performing an on-line experiment with a product configurator. This is done by 1) Examining two different product configurator designs and 2) Investigating customer value drivers based on a presented framework that includes motivation, opportunity and ability measures. This Motivation-Opportunity-Ability (MOA) framework is frequently used in marketing studies as a way to predict human behaviour (MacInnis, Moorman, & Jaworski, 1991). In this framework it is assumed that behaviour depends on the motivation, opportunity and ability people have to implement certain behaviour. 8.
(11) 1.3. Central research questions and sub questions. To perform this research an industrial (modular) building concept that is currently being developed by a Dutch house building company is investigated. Since this research has both academic as practical interests, two research questions were formulated: Academic research question To what extent is the motivation-opportunityability (MOA) framework applicable for predicting customer value of a configurator based mass customization concept for houses? • S1: How can customer value be measured? • S2: What are drivers of motivation, opportunity, and ability in the context of mass customization concepts in house-building? • S3: What is the net value of drivers of motivation, opportunity and ability in the prediction of customer value? Practical research question Which variables are most important to consider in predicting customer value of a configurator based mass customization concept for houses? • S1: What is the impact of manipulating the configurator design on the perceived customer value? • S2: What is the customer value of a customized house, compared to a house where no customization is offered? • S3: What are possible improvements for the current interface design (the product configurator)?. 1.4. Report outline. In the next section a theoretical framework is delivered with an outline of relevant literature. In this section hypotheses and the conceptual model are also described. The thesis continues with a description of the research method, followed by the data collection and analysis. In the last chapter a discussion and conclusion is provided, where theoretical and managerial implications and possible future research directions are discussed.. 9.
(12) Chapter 2. Theoretical framework This theoretical framework is divided into four subsections, starting with a general exploration of the use of mass customization as a manufacturing strategy and the application of this concept in the house-building industry. After this, the focus is shifted towards the use of mass customization interfaces. In the third subsection, the customer value construct is examined and in the last subsection, the conceptual model for this study is presented. Table 2.1 shows the most important concept definitions of this research.. 2.1. Mass customization as manufacturing strategy. This section provides an overview of the development of mass customization in the house-building industry by 1) describing the paradigm shift towards mass customization and 2) explaining the mass customization concept and the development of modular off-site building.. 2.1.1. The value of customization: A paradigm shift. Due to strong competition in industries nowadays, companies are always searching for the next innovative strategy or product to create a competitive advantage. However, innovation in the house-building industry seems to develop slower compared to other industries. One explanation for this could be the nature of house-building itself, since it concerns big projects that are relatively complex and take a long time to complete. Also the nature of the industries’ market seems to slow down innovation. Customers in the house-building industry seem to be relatively reluctant of accepting new ideas compared to other industries. Since the life cycle of a house is long and requires a big investment, customers do not take high risks investing in new and unknown concepts. For this reason, most of the innovations are incremental instead of radical (Ball, 1999; Dewulf et al., 2014). Yusof et al. (2014) contribute to this view by concluding that the dominant practice of the house-building industry is to adopt rather than to create innovations.. 10.
(13) Table 2.1: Concept definitions Attribute-by-attribute approach Customization via starting solutions approach. Customer sacrifice gap Mass customization. Modularity. Off-site or industrialized production system Product configurator. Solution space. Standard method for product customization where customers configure their product by choosing each of its attributes individually (Hildebrand et al., 2014) Two-stage customization method where customers first select a predefined design as starting solution and then configure their final customized product by refining the starting solution one attribute at a time (Hildebrand et al., 2014). The gap between a manufacturers’ offering and what each customer truly desires (Gilmore & Pine 2nd., 1997). Manufacturing technique that focuses on the broad provision of individually customized products or services (Pine, 1993). Mass customization in the house-building industry refers to the ability to design and manufacture customized houses at mass production efficiency and speed (Nahmens & Bindroo 2011). A Modular product is decoupled into sub-assemblies and components. Modularity enables companies to standardize components and offers increased variety options. For the house-building industry in particular, modularity means the use of ”... sets of units designed to be arranged or joined in a variety of ways” (Gershenson, Prasad, & Zhang, 2003). ”...The manufacturing and pre-assembly of components, elements or modules before installation into their final location” (Goodier & Gibb, 2007) User friendly design tool that enables users to configure their own unique product by selecting from lists of options that have been predesigned by the mass customizer (von Hippel & Katz, 2002) ”...The pre-existing capability and degrees of freedom built into a given manufacturer’s production system (Hippel, 2001). Focusing on the development of the building industry in general, a paradigm shift from mass production to individual customization can be identified since 1980 (Thuesen, Jensen, & Gottlieb, 2009). This shift caused several changes in the nature of building, as summarized in table 2.2.. 11.
(14) Table 2.2: Characteristics of mass production versus individual customization adopted from Thuesen et al., (2009). Societal frame Perceived nature of the building Production paradigm Value chain Vehicle for realization Management paradigm Costs Implementation of lean management. Standardized. Unique (Project-based). Modern Complex but known Mass production Integrated Prefabrication Scientific Management Low Long term planning. Postmodern Chaotic Individual Customization Fragmented Project Project Management High Short term planning. Pursuing an individual customization approach that is more customer focused than earlier production strategies, has been found a successful approach for creating competitive advantage (Ozaki, 2003; Nahmens & Bindroo, 2011a; Schoenwitz, Gosling, Naim, & Potter, 2013). In practice this approach leads to project based building concepts. However, these concepts do not take advantage of economies of scale and therefore building companies struggle with high production costs and inefficiency. On the other hand, when pursuing a standardized building approach, companies may fail to integrate the customer preferences and therefore no competitive advantage is created in this field. Since both paradigms have disadvantages, Thuesen et al. (2009) claim the need for a new platform that could be named a ”mass customization platform”. This platform should form a way to bridge the two existing paradigms and optimize the cost-value ratio as shown in figure 2.1.. Figure 2.1: Optimization of the cost-value trade-off (Thuesen et al., 2009).. 2.1.2. Mass customization practices in house-building. In general, mass customization has been a widely applied strategy nowadays, causing a paradigm shift from build-to-forecast to build-to-order (Anderson, 2004). This leads to a more efficient and ’lean’ manufacturing strategy compared to earlier strategies. Examples of mass customization strategies can be found in the automotive industry, where customers can personalize their car, or in the shoe industry, where customers can assemble their running shoes out of several loose parts.. 12.
(15) A company pursuing a mass customization strategy tries to create a customizable product at the efficiency, cost and quality of a mass produced product (Pine, 1993). Successful mass customization practitioners are able to identify where customers differ in their needs, instead of the traditional focus of trying to identify homogeneity in the market. Similar to other industries the objective of mass customization in housebuilding is to create competitive advantage by both increasing the production efficiency (through standardization) and increasing the customer value (by offering customization). One of the most popular design practices of mass customization in house building is the decoupling of a house into modules and collaborating with the customer to assemble them to create a final product (Hofman et al., 2006; Hofman, Voordijk, & Halman, 2009; Hofman, 2010; Wang, Chen, Zhao, & Zhou, 2014a). The decoupling of a house allows companies to create modules separately in a factory instead of on the building site. Focusing on the supply chain of house-building concepts, five different strategies can be identified varying from total standardization to total customization (Figure 2.2). The strategy that is closest related to the original definition of mass customization is the customized standardization approach (Barlow et al., 2003). In this strategy the fabrication of modules and design of options are standardized, but can be assembled by the customer by choosing between options.. Figure 2.2: Standardization vs. customization adopted from (Barlow et al., 2003). To communicate the customizable options towards customers, a suitable mass customization interface is needed. The design of such an interface could be challenging. This will be further discussed in the next section.. 13.
(16) 2.2. The mass customization interface. Two challenges of mass customization should be tackled by the interface that is used: 1) Mapping the right variation preferences and 2) Managing choice complexity.. 2.2.1. Mapping variation preferences.. Since customers have widely spread preferences, an important step in creating mass customization strategies is to separate homogeneous and heterogeneous needs. Variation should be offered in the second category, while components from the first one should be standardized (Wang, Chen, Zhao, & Zhou, 2014b). The first challenge in the design process of a suitable mass customization interface is therefore to identify the customer needs. Hofman et al. (2006), defined five house dimensions where variety was offered: 1) technical systems, 2) interior finish, 3) floor plan, 4) house volume & exterior and 5) environment. Most variation was preferred in the interior finish, followed by the house volume & exterior, floor plan, technical systems and environment. In addition, Hofman et al. (2006) compiled a list of house attributes ranked by the amount of preferred variety. This indicates where to set the main focus for designing the interface. Schoenwitz et al. (2013) contribute to the theory about ”where to customize” by publicizing their own list. A comparison of both the studies is shown in table 2.3. Table 2.3: Variation preferences adopted from Hofman et al., (2006) & Schoenwitz et al., (2012) Dimensions Hofman et al., (2006) 1.Interior finish 2.House volume & exterior 3.Floor plan 4.Technical systems 5.Environment. 2.2.2. Dimensions Schoenwitz et al., (2012) 1.Sanitary 2.Internal design 3.Facade 4.Construction design 5.Home technology 6.Heating 7.Additional services (e.g. garage, furniture). Managing choice complexity.. Another need that appeared with the emergence of customization is to help customers manage their perceived choice complexity. When someone is asked to choose between several options in a house design, the customer becomes in some way a ’co-designer’, but often he or she lacks in experience with house building. When confronted with many modules and options an explosion of choices occurs, letting customers feel overwhelmed. As a result, satisfaction with the end design may go down rather than up. Therefore, offering too many options could lead to variety-induced complexity on both the production side and the customer side (Abdelkafi, 2008; Dellaert & Stremersch, 2005). The influence of choice complexity on product evaluations has already been investigated in several studies. One of the hypotheses in the research of Nahmens. 14.
(17) and Bindroo (2011a) was that high customizability should lead to a higher customer satisfaction. However, this turned out to be a false expectation. A possible explanation that the authors mentioned was the fact that the many options increased production complexity. Therefore, a longer completion time occurred that could have caused the dissatisfaction. A second explanation could be that customers that buy customized houses naturally have higher expectations that are harder to satisfy compared to customers that buy standardized houses. Another finding that advocates for the negative effect of choice complexity has been given by Dellaert and Stremersch (2005). The reason for this effect was that high complexity could have led to higher customization efforts. On the contrary, reducing complexity and therefore reducing variety could endanger the customers’ ability to create something that fits his/her preferences. This has a negative effect on their willingness to pay (Franke, Schreier, & Kaiser, 2009). An often used interface for mass customizations strategies is a product configurator. The configurator is a design tool that enables users to configure a product by selecting from lists of options that have been pre-designed by a company (von Hippel & Katz, 2002).. 2.2.3. The use of a product configurator for mapping preferences and managing choice complexity. A good configurator should strike a balance between perceived utility and complexity (Dellaert & Stremersch, 2005). First of all it is important to consider its user friendliness. The configurator should allow customers without specific skills regarding the product, to design something following their preferences. To accomplish this, perceived choice complexity should be reduced as far as possible (von Hippel, 2001) without limiting the availability of options too much. The dominant configurator design for current mass customization practitioners is the attribute-by-attribute customization approach (AbA), where users configure a product by choosing each of its attributes individually (Hildebrand, Hubl, & Herrmann, 2014). Examples of companies that make use of such configurators are Dell (personalized computers) and Nike (personalized running shoes). One problem that could occur when using a product configurator like above, could be the perceived complexity of using it. A way to reduce complexity is to use a customization via starting solutions (CvSS) architecture (Hildebrand et al., 2014). CvSS can be seen as a twostage customization process. First, a customer can choose her or his most preferred design out of several default designs. These default designs already include some pre-selected options. By presenting different default designs to a customer, a company could try to address different segments. After choosing a default design, the customer is able to add or drop options similar to the AbA customization processes. Besides decreasing the perceived choice complexity, CvSS enhances the possibility to create a mental simulation of the product use. This leads to higher satisfaction with the product and an increase in the options chosen (Park, Jun, & MacInnis, 2000; Hildebrand et al., 2014). Based on the above the first hypothesis for this research was set: • H1: Using a CvSS customization approach increases the perceived customer value compared to using an AbA customization approach in the configuration of a house. 15.
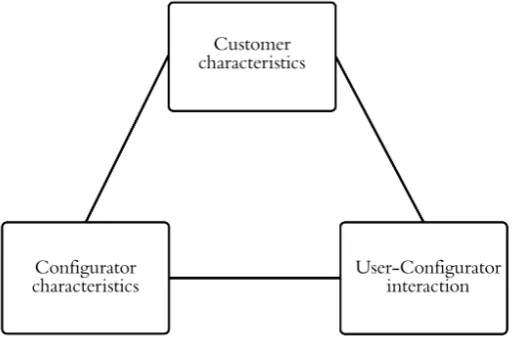
(18) To create a benchmark for a useful interpretation of the perceived customer value, the two customization approaches will be compared to a buying situation where no customization is offered. Based on the previous discussed value of mass customization, the second hypothesis is the following: • H2: When compared to buying a standardized house, being able to customize a house with the use of a product configurator increases the perceived customer value.. 2.3. Assessing customer value: An application of the MOA framework. When a suitable interface for a mass customization concept has been developed, the next thing a company wants to know is the feasibility of the concept. It is possible to just launch the product and see what happens, however by assessing the customer value via feasibility research, possible flaws could be detected beforehand. Three different determinants (Figure 2.3) of the customer value of a customized product can be identified in existing literature (Franke & Schreier, 2010). The first determinant includes the characteristics of the customers. Not every customer is equally likely to derive value from a customized product, due to heterogeneity in, for instance, their skills and preferences regarding a product. The second determinant are the configurator characteristics. If the configurator offers too little options or its user friendliness is limited, which increases perceived complexity, this influences the users evaluation of the final product. The third determinant concerns the process related factors. Some of the customer value is derived from the interaction process between user and configurator as concluded by Franke, Keinz, and Steger (2009b).. Figure 2.3: Determinants of customer value for configurator based mass customization strategies. 16.
(19) Although the determinants of customer value are a starting point for developing measures for a feasibility research, there is still a broad theoretical history of factors that influence customer value. Therefore it was found useful to choose a framework that could help in further identifying these factors. The motivation-opportunity-ability (hence MOA) framework (MacInnis et al., 1991), has proven to be a successful method in mapping consumers’ behavioral intentions in various marketing studies (Hildebrand et al., 2014; Bign, Ruiz, Andreu, & Hernandez, 2013; Siemsen, Roth, & Balasubramanian, 2008; Gruen, Osmonbekov, & Czaplewski, 2005; Binney, Hall, & Shaw, 2003). Following the framework, behavior can be enhanced by increasing the motivation, opportunity and ability of someone to perform such behavior. The framework indicated for instance the level of customer-to-customer exchange and therefore the value perceptions and loyalty intentions of customers in the study of Gruen, Osmonbekov, and Czaplewski (2007). Its predictive ability was also found in the repurchase intentions of on-line airline tickets according to the study of Bign et al. (2013). Based on its proven value in current research, the expectation is that the MOA framework is also useful in the light of this study. Based on this expectation, three hypotheses were set: • H3: Motivation, opportunity and ability drivers are applicable as predictors of the perceived customer value of houses customized with a product configurator. • H4: Motivation, opportunity and ability drivers increase the perceived customer value of configurator based customized houses. • H5: Opportunity and ability drivers moderate the effect of motivation drivers in predicting the perceived customer value of configurator based customized houses.. 2.3.1. Application of the framework. Measures of MOA are highly dependent on the context of the study. In general, measures can either be conducted in pre-exposure and post-exposure contexts. Pre-exposure measures display characteristics of the customers, while post-exposure measures show mediating effects of a certain communication solution (MacInnis et al., 1991). Three guidelines towards successfully applying the framework are proposed by MacInnis et al. (1991): 1) Both pre and postexposure measures should be used (if sufficient resources are available), 2) Using multiple measures might be beneficial, since MOA measures are still being validated, and 3) control for net effects of each measure, since the MOA measures are highly interrelated. With these three guidelines as starting point the three MOA constructs are further defined in the context of this study. Motivation A motivated customer should be ’energized, ready and willing’ (Gruen et al., 2007) to engage in a customization process. Assessing the customers’ goal directed arousal has been found the best measure for motivation (MacInnis et al., 1991). The motivation of customers can be seen in two different ways: Intrinsic and extrinsic (Sabnis, Chatterjee, Grewal, & Lilien, 2013). Intrinsic motivation. 17.
(20) refers to the way motivation is created based on internal factors of the customer. This kind of motivation can be influenced by, for instance, personal preferences or involvement with the product. Extrinsic motivation, on the contrary, depends on external factors which are easier to influence by the management of a company. For this study, motivation is defined as the intrinsic and extrinsic factors that increase a persons’ arousal to customize a house using a configurator. Measures Franke and Schreier (2010) found the positive effect of ”process enjoyment” on the customers’ evaluation of a customized product. This effect that was created by the interaction between a user and the configurator can be seen as a driver of extrinsic motivation. As mentioned above, intrinsic motivation depends on customer characteristics that are harder to influence. Franke, Schreier, and Kaiser (2009) found that involvement with the product significantly influenced the perceived customer value. This intrinsic motivation driver is expected to influence the customer value since customers with a high level of involvement are more likely to negatively value a product that does not fit their preferences. Given that customizable products allow for a better integration of preferences, people with high involvement are expected to give a higher product evaluation towards customized products that fit their preferences. Opportunity Opportunity can be defined as ”...the situational factors that influence the possibility to achieve a positive outcome.” These factors can either enhance the desired behavior or interfere in achieving this (Gruen et al., 2007). In this study we define opportunity as the configurator characteristics influencing the opportunity to create a custom house following the customers’ needs. Following this definition, opportunity can be influenced by the design of the configurator. As discussed in paragraph 2.2.3, the success of the configurator depends on its 1) performance in mapping customer preferences and 2) ability to decrease choice complexity. Since the latter is closely related to the definition of ability that is discussed next, only the first factor was taken for the opportunity construct. Measures The configurator’s success in mapping the customer preferences could be seen from two perspectives: The availability of sufficient options and the availability of the right options to allow for the optimal integration of preferences. Overall, the perceived usefulness of the configurator (Davis, 1989) could give a good indication of the configurator being successful. Measuring the degree of design freedom could indicate if the tool offers enough options to generate a design that fits the customer needs. In addition, a third opportunity measure is identified: The use of a product configurator is expected to have a negative impact on people who have a high need for interaction with a service person. Since in current customization strategies in house building a high level of interaction between the company and potential buyers is maintained, having an on-line interface only could decrease the customer value.. 18.
(21) Ability According to earlier studies of the MOA framework, ability can be defined as the customers’ skill or proficiency needed to achieve a goal (Deborah J. Maclnnis, 1989). In the context of this study this means that ability can be defined as the customers’ skill that is needed to make customization related decisions and to use the configurator. More specifically this means that ability measures should be indicators of customer qualities that provide the skill to make design decisions for a new house. Measures Despite involvement with the product Franke, Schreier, and Kaiser (2009) found two more factors influencing the customer value: Preference insight and ability to express preferences. These factors are indicators of a users ability since they indicate the level of personal skills to successfully engage in a customization process. The perceived preference insight refers to the extent to which customers know what they want in a certain product category. Ability to express preferences indicates if customers are able to express their preferences to an external party in a proper way. To measure if customers are able to use the configurator properly the TAM model (Davis, 1989) could again provide a suitable measure: Ease of use.. 19.
(22) 2.4. Conceptual model. According to the applied definitions of the MOA framework from the previous section, the value customers derive from customizing a house via a product configurator depends on the 1) Intrinsic and extrinsic motivation of the customer to customize a house, 2) configurator design factors that allow customers to create a house following their preferences, and 3) skills of the customer to create a suitable house design. Together with the hypotheses regarding the product configurator design, the conceptual model for this study was constructed as shown in figure 2.4.. Figure 2.4: Conceptual model. 20.
(23) Chapter 3. Method In order to investigate the hypotheses there is a need for studying a realistic buying situation. Since no suitable product configurator for houses was available it was chosen to conduct an experimental research.. 3.1. Research design and sample. For this study, a modular building concept of a Dutch house building company that is currently in its development phase was used as the subject of a case study. In current production strategies, the company already offers customization possibilities to customers. However, due to the large variety that is offered, this strategy is relatively expensive and inefficient. Therefore, the company has developed a new concept where a house is compiled out of several prefabricated modules. This house can be customized by the buyer by adding options on top of the basic (default) house. This default house already includes standardized components such as the technical systems. For the experiment, three experimental conditions (figure 3.1) were developed. In the first two conditions respondents were asked to configure a house with a product configurator. Each condition contained one of the two configurator designs that were discussed by Hildebrand et al. (2014): Attribute by attribute customization and customization via starting solutions. The third condition was created to set a benchmark that indicates the customer value of a standardized house. In this condition respondents were asked to choose one out of four predefined houses.. 21.
(24) Figure 3.1: Experimental conditions Main experiment For the first two conditions the experiment consisted out of 3 phases. After receiving an invitation (appendix B) to participate in the research the respondents were asked to fill out a short survey to receive some personal details. Second, the respondents were asked to use a product configurator to assemble a house. In the third phase, the respondents filled out a second survey to evaluate the customization process. The three parts were connected so respondents were automatically navigated through the whole experiment. The whole procedure is shown in figure 3.2.. Figure 3.2: Procedure configurator experiment. Control group In the third condition, respondents were asked to fill out one short survey. In this survey, impressions of four different house designs, based on the same concept as in the main experiment, were shown to the respondents. In contrast to the first two conditions, no customization process was included. After choosing the best fitting impression the respondents were asked to evaluate their choice. Study sample The respondents were recruited from database of 160.000 people that indicated to be interested in buying a new build home. The database was provided by Nieuwbouw Nederland. This is an on-line platform that matches building projects and potential buyers.. 22.
(25) Since the house building company that developed the concept expects their concept to be attractive for mid-class customers, only respondents that indicated to be interested in buying a terraced house were included in the mailing. As an incentive for participating in the study, a raffle of three coupons with a value of e 100 from the Dutch website Bol.com was promised to the participating respondents. Prior to sending out the survey, the surveys were pretested by 10 persons (2 experts and 8 non-experts). Some small flaws were corrected after this pretest. The data collection procedure is shown in figure 3.3. The respondents were randomly selected from the database on terms that they indicated to be interested in buying a terraced house. For the main experiment, a total sample of 15.000 people was taken from the database. In the first mailing, the survey was sent to 1000 respondents. The first responses were checked for possible flaws before addressing another 4000 respondents. After one week, the response rate was still low. Since it could be interpreted as spam, the database provider did not prefer sending reminders. Therefore, 10.000 new mail addresses were included in the sample. For the control condition, 5000 people were included in the sample. The response rate was expected to be higher, since this part of the study only contained a short survey.. Figure 3.3: Data collection procedure In total this study included a study sample of 20.000 people resulting in 158 fully completed surveys. Therefore, the overall response rate was 0.8 percent. The participants (57.3% females), had an average age of 40 (SD = 13.23). The amount of respondents per research condition (CvSS customization, Attribute to attribute customization and standardized houses) were respectively 52, 53 and 53.. 3.2. Study development. 3.2.1. Concept and interface development. The solution space of the concept was composed during three meetings with company experts. Choices were based on their experience with customer preferences. In addition, it was attempted to organize a focus group to review the concept design. However, too little people responded to the invitation, so it was decided to skip the focus group. For the interface, the company invested in 23.
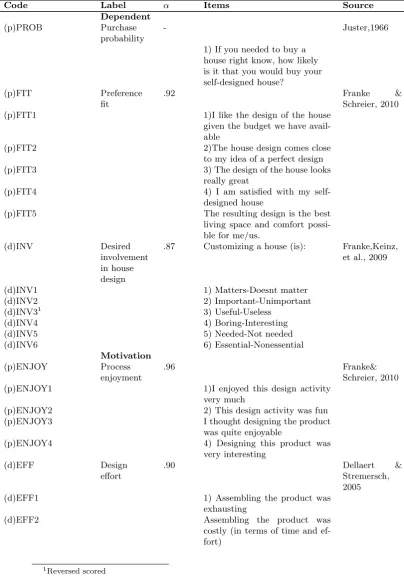
(26) a product configurator designed by a professional web designer. The first purpose of this configurator was to perform this study. However, the configurator was developed in such a way it should be suitable for the real implementation without expensive adjustments. To avoid order bias that could occur among the customization options, three different option category sequences were integrated in the configurator design. These sequences were randomly assigned to the respondents.. 3.2.2. Measurement instrument. The three surveys (see appendices C-F) were constructed with the survey software ”Limesurvey” that was made available by the University of Twente. Main experiment In the first survey control variables and questions about the demographic characteristics of the respondents were included. The main focus of the second survey was to measure the MOA drivers that were identified in the previous section. All the items were measured on multi-item 7-point Likert scales1 . In addition, some measures tat were of managerial interest for the company were included. Control group For the third survey (control group) the MOA measures and practical questions were excluded. Instead of letting respondents construct a house with a configurator, four images with different (partly visual, partly textual) house descriptions were shown. The four designs were composed in collaboration with an expert of the Dutch house building company. The images differed in price and degree of luxury/completeness of the finishing.. 3.2.3. Measurement items. Dependent variables In previous studies of product configurators willingness to pay (WTP) was most frequently used as dependent variable. However directly measuring WTP causes several biases. For instance, it could be hard for respondents to estimate realistic prices. Therefore indirect methods are frequently used for assessing WTP (Breidert, Hahsler, & Reutterer, 2006). Unfortunately no indirect method was found applicable for the current study design, therefore customer value was conceptualized by two different measures: Preference fit and Purchase probability. Preference fit can be defined as the ”...customers subjective evaluation of the extent to which the products features correspond to their preference system”. According to Franke and Schreier (2010), this measure is significantly related to the WTP of customers. The items for measuring preference fit were partly adapted from Franke and Schreier (2010). However, the original scale was missing budget related items and therefore two items were added that included budget considerations of potential buyers. Purchase probability (Juster, 1966) was added as a second measure since this should give a proper indication of buying behavior. The value of both measures is discussed in the last section of this report. 1 With. exception of purchase probability which was measured on the one-item 11-point scale from Juster (1966).. 24.
(27) Independent variables Motivation As discussed in paragraph 2.3, desired involvement in house design and process enjoyment are considered to be motivation drivers. Items for enjoyment and involvement were adopted from (Franke, Keinz, & Steger, 2009b) and (Franke & Schreier, 2010). Opportunity Perceived usefulness was adopted from the technology acceptance model (TAM) (Venkatesh, 2000). In addition, a new scale was developed to measure the perceived design freedom. The scale for measuring the need for interaction with a service person was adopted from (Dabholkar & Bagozzi, 2002). Ability The customers’ ability is measured by preference insight, ability to express preferences, and ease of use. Items for the measurement of preference insight and ability to express preferences were adapted from (Franke, Keinz, & Steger, 2009b). The ability to express preferences scale was adapted with the exception of one question that could not be translated to the context of this study. Ease of use was measured following the items of (Venkatesh, 2000). An overview of the measurements items is shown in table 3.1 For the multiitem scales also the internal consistency (Cronbach’s alpha) is displayed. Control variables, practical measures and dummy variables The variables income level, previous experience with house design, current interest in buying a house, house budget, gender, family type, education level, education type and age were included as control variables (table 3.2). In addition, the respondents were asked to rate the different options in terms of relative importance, quantity and affordability (table 3.3). These measures could give practical insights for the house-building company. At the end of the second survey, two open questions were added where respondents could indicate if they were missing specific options or had other remarks. For the regression analyses in the next section, some dummy variables were created. These variables are shown in table 3.4. 25.
(28) Table 3.1: Measurement items Code. Label Dependent Purchase probability. (p)PROB. α. Items. -. Source Juster,1966. 1) If you needed to buy a house right know, how likely is it that you would buy your self-designed house? (p)FIT. Preference fit. .92. (p)FIT1. (p)FIT2 (p)FIT3 (p)FIT4 (p)FIT5. (d)INV. Desired involvement in house design. .87. (d)INV1 (d)INV2 (d)INV31 (d)INV4 (d)INV5 (d)INV6. Franke & Schreier, 2010 1)I like the design of the house given the budget we have available 2)The house design comes close to my idea of a perfect design 3) The design of the house looks really great 4) I am satisfied with my selfdesigned house The resulting design is the best living space and comfort possible for me/us. Customizing a house (is):. 1) 2) 3) 4) 5) 6). (p)ENJOY. Motivation Process enjoyment. Franke& Schreier, 2010 1)I enjoyed this design activity very much 2) This design activity was fun I thought designing the product was quite enjoyable 4) Designing this product was very interesting. (p)ENJOY2 (p)ENJOY3 (p)ENJOY4 (d)EFF. Matters-Doesnt matter Important-Unimportant Useful-Useless Boring-Interesting Needed-Not needed Essential-Nonessential. .96. (p)ENJOY1. Design effort. (d)EFF1. .90. Dellaert & Stremersch, 2005 1) Assembling the product was exhausting Assembling the product was costly (in terms of time and effort). (d)EFF2. 1 Reversed. Franke,Keinz, et al., 2009. scored. 26.
(29) (d)EFF3. 3) Designing this product required much effort Opportunity Design .90 freedom. (d)FREE d)FREE1. 1) The tool offered me a high degree of design freedom The tool allowed me to have a lot of input in the design process I was missing little or no customization features during the design process. d)FREE2 d)FREE3. (p)USEFUL. Perceived usefulness. .96. (p)USEFUL1. Venkatesh, 2000 1)Using the tool improves my performance in assembling a house 2)Using the tool increases my productivity in assembling a house 3Using the tool enhances my effectiveness in assembling a house 4)I find the tool to be useful for assembling a house. (p)USEFUL2. (p)USEFUL3. (p)USEFUL4 (n)INTERACT. Need for interaction. .79. (n)INTERACT1. 1)Human contact in providing services makes the process enjoyable for the consumer. 2)I like interacting with the person who provides the service. 3)Personal attention by the service employee is not very important to me. 4)It bothers me to use a machine when I could talk to a person instead.. (n)INTERACT2 (n)INTERACT3. 1. (n)INTERACT4. 2. Ability Ease of use. (e)USE (e)USE1. Dabholkar & Bagozzi, 2002. .84. Venkatesh, 2000 1) My interaction with the tool was clear and understandable 2) Interacting with the tool did not require a lot of my mental effort 3) I find the tool to be easy to use 4) I find it easy to get the tool to do what I want it to do. (e)USE2. (e)USE3 (e)USE4. 1 Reversed 2 Item. scored was deleted due to low internal consistency. 27.
(30) (a)EXPRESS. Ability to express preferences. .94. (a)EXPRESS1. 1)It would be easy for me to describe what my ideal house should look like 2)It would be no problem for me to name those attributes of a house which are most important to me 3) I could easily explain to someone else what kind of house I like the best. (a)EXPRESS2. (a)EXPRESS3. (c)ABIL. Franke,Keinz, et al., 2009. Customization .96 ability. (c)ABIL1. 1) I am fully capable of assembling a house 2) I am confident in my ability to set up a house 3) Assembling a house is well within the scope of my abilities. (c)ABIL2 (c)ABIL3 (p)INSIGHT. Dong, Evans, & Zou, 2008. Preference insight. .88. (p)INSIGHT1. Franke, Keinz, et al., 2009 1)I know exactly what kind of house I want 2) When I would purchase and customize a house, I know quit soon what I prefer 3) When I would purchase and customize a house, I find it easy to choose among different alternatives. (p)INSIGHT2. (p)INSIGHT3. Table 3.2: Control variables Code Sex Income Budget. Label Gender Income level House budget. Education. Finished education. TechEducation Family Age Region Experience BuyingInterest. Education scope Family type Age Living region Prior experience Interest in buying a new house. 28. Item Wat is your gender? What is your income level? In which price range would you buy a house? What is your highest finished educational degree? Did you follow a technical education? What is your family situation? What is your age? In which province do you live? (Dellaert & Stremersch, 2005) Are you currently interested in buying a new build house?.
(31) Table 3.3: Practical measures Code Importance. Quantity Affordability. Label Relative importance of having customization abilities per customization category Option quantity per customization category Affordability of the different options per customization category. Item How important do you find the possibility to customize this category (floor finish) What did you think about the quantity of the options? What did you think of the price of the options?. Table 3.4: Dummy variables Code. Label. Item. D1Single D2Partner D3Childpartner D4Child D1NoEducation D2MBO D3HBO D4WO D1Budget D2Budget D1income D2income D3income D4income. Single Couple Couple with children Single parent No education MBO HBO WO Budget less than 200.000 Budget more than 200.000 Income till 40.000 Income between 40-60.000 Income between 60-90.000 Income more than 90.000. 1= Single 0=Other 1=With partner 0=Other 1= With children and partner 0= Other 1= Single parent 0=Other 1= No education 0=Other 1= MBO 0=Other 1= HBO 0=Other 1=WO 0=Other 1= Less than 200.000 0=Other 1= More than 200.000 0=Other 1= tot 40.000 0=Other 1= 40-60.000 0=Other 1= 60-90.000 0=Other 1= more than 90.000 0=Other. 29.
(32) Chapter 4. Results The data analysis was performed in the statistical research program SPSS statistics 23 (IBM corp.). This section contains 1) preliminary normality and factor analyses, descriptive statistics and correlations, 2) linear regression analyses to test the applicability of the MOA framework and identify predictors of customer value, and 3) group comparisons based on the three research conditions. As reference for the SPSS analyses, the book of Pallant (2013) was used.. 4.1. Preliminary analyses, descriptive statistics and correlations. 4.1.1. Preliminary analyses. Normality test Before starting the main analyses the normality of scores on all of the 7-point scales was assessed by performing the Kolmogorov-Smirnov statistic. For all of the variables that were included in the research model, a significant value (p = <0.05) was found, which means that the assumption of normality was violated. Also, further inspection of the normal probability plots did show that the score distributions did not have a reasonable level of normality. This is not uncommon for scales as used in this study, because of the underlying nature of the variables. However, since the sample of this study is relatively small (<200), it was decided to use bootstrapping as additional check for the reliability of the analyses. This means that bias corrected and accelerated (BCa) 95% intervals were investigated to find possible flaws in the significance level of a variable.. Factor analysis Since many variables were included in the conceptual model, it was found useful to perform a factor analysis to see if the model could be reduced to a lower number of measures. This analysis was performed for all three of the MOA components separately. Prior to performing the analysis the suitability of the data for the factor analysis was assessed. Since many correlations between the items were above .3, the Kaiser Meyer-Olkin value was above the preferable level of .6 for all three of the components and the Bartlett’s Test of Sphericity was statistically significant (p=.000), the factor analyses was believed valuable.. 30.
(33) The analysis resulted in eight components that had an eigenvalue above 1, explaining 80% of the total variance. The pattern matrix that explains the components and the item loadings, is shown in table 4.1.. Table 4.1: Factor analysis 1 Motivation (p)ENJOY3 (p)ENJOY2 (p)ENJOY4 (p)ENJOY1 (d)INV5 (d)INV6 (d)INV3 (d)INV2 (d)INV1 (d)INV4 Opportunity (p)USEFUL3 (p)USEFUL2 (p)USEFUL1 (p)USEFUL4 (d)FREE2 (d)FREE1 (d)FREE3 (n)INTERACT2 (n)INTERACT1 (n)INTERACT3 Ability (a)EXPRESS3 (a)EXPRESS1 (p)INSIGHT1 (a)EXPRESS2 (p)INSIGHT2 (p)INSIGHT3 (e)USE3 (e)USE4 (e)USE1 (e)USE2 (c)ABIL2 (c)ABIL1 (c)ABIL3. 2. 3. 4. 5. ,96 ,95 ,94 ,93 ,88 ,87 ,78 ,78 ,74 ,68 ,92 ,89 ,89 ,88 ,82 ,82 ,76 ,89 ,86 ,79 ,97 ,97 ,86 ,82 ,69 ,56 ,92 ,82 ,80 ,79 ,96 ,95 ,91. (p)ENJOY=Process enjoyment, (d)INV=Desired involvement, (p)USEFUL=Perceived usefulness, (d)FREE=Design freedom, (n)INTERACT=Need for interaction, (a)EXPRESS=Ability to express preferences, (e)USE=Ease of use, (p)INSIGHT=Preference insight, (c)ABIL=Customization ability. The items for ”design freedom” and ”perceived usefulness” seemed to explain the same. It was decided to maintain design freedom since this scale is more applied to the context of this study. Also, ”preference insight” and ”ability to express preferences” items showed high overlap. Franke et al. already named that the difference between these two measures is not visible in all situations (Franke, Schreier, & Kaiser, 2009).. 31.
(34) Therefore, ”ability to express preferences” was removed from further analyses.. 4.1.2. Descriptive statistics. Academic findings Table 4.2 shows the means and standard deviations of the main research variables. In addition, nominal variables were created out of the 7-point scores to simplify the interpretation. Positive answers (5-7) are labelled 1 (agree), while negative (1-3) and neutral (4) answers are labelled 0 (disagree).. Table 4.2: Means and standard deviations Variable Customer value (p)PROB (p)FIT Motivation (p)ENJOY (d)INV Opportunity (d)FREE (n)INTERACT Ability (e)USE (p)INSIGHT (c)ABIL. Mean (SD). Percentage Agree (Disagree). 5.24 (3.36) 4.99 (1.41). .52(.48) .71(.29). 5.54 (1.26) 6.20 (.95). .86(.14) .92(.08). 3.90 (1,50) 5.27 (1.20). .40 (.60) .74 (.26). 5,94 (,87) 5.68 (1.03) 5.32 (1.25). .95 (.05) .90 (.10) .80 (.20). (p)PROB=Purchase probability, (p)FIT=Preference fit, (p)ENJOY=Process enjoyment, (d)INV=Desired involvement, (d)FREE=Design freedom, (n)INTERACT=Need for interaction, (e)USE=Ease of use, (p)INSIGHT=Preference insight, (c)ABIL=Customization ability. Practical findings The respondents were asked to rate the importance of different customization categories. Table 4.3 shows the mean importance of the different customization categories that were used in the configurator. The respondents spent a mean amount of e47.978 on additional options on top of the default house design. The respondents also rated the affordability and quantity of the options. Regarding the affordability, 64,8% of the respondents chose 4 or lower on the affordability which means that they found the options very cheap to affordable. For the quantity scale, 29,5% of the respondents found that the configurator offered the perfect amount of options. 41% thought that the configurator offered too little options and 29,5 % indicated that there were too many options.. 32.
(35) Table 4.3: Mean importance customization options Category. Mean importance (SD). Kitchen layout Kitchen style Floor plan Sanitary facilities Sanitary tiling Surface expansion Floor finishes Wall finishes Roof window/ Dormer Garden door Energy (e.g. solar panels) Additional options (e.g. garden finish, storage) Interior doors. Figure 4.1: Missing options. 33. 6,34 6,29 6,15 5,89 5,80 5,80 5,74 5,55 5,55 5,40 5,34 5,30 5,09. (1,05) (1,04) (1,17) (1,35) (1,34) (1,33) (1,32) (1,29) (1,35) (1,58) (1,55) (1,50) (1,43).
(36) At the end of the second survey respondents could indicate what options they were missing in an open question. The answers were assigned to 12 different codes. The results are shown in figure 4.1. The numbers show the amount of respondents that were involved (e.g. 20 respondents indicated that they were missing options in the floor plan of the house).. 4.1.3. Correlations. A Pearson product-moment correlation coefficient (table 4.4) was used to investigate the correlations between the MOA measures that remained after the factor analysis. As an additional check, a bootstrap was performed. In appendix A the BCa 95% confidence intervals are shown. Both sides of the interval should be either positive or negative otherwise the correlation was not shown as significant in the correlation table.. Table 4.4: Pearson correlations Variable name. 1. 2. 3. 4. 1 ,65**. 1. ,54** ,09. ,71** -,00. 1 ,00. 1. 5. 6. Customer value (p)PROB(1) (p)FIT(2) Motivation (p)ENJOY(3) (d)INV(4) Opportunity (d)FREE(5) (n)INTER(6) Ability (e)USE(7) (p)INSIGHT(8) (c)ABIL (9). ,45** ,09. ,69** ,11. ,64** ,13. -,11 ,17. 1 ,11. 1. ,21* ,15 ,06. ,23** ,20* ,16. ,28** ,31** ,22*. ,11 ,19 ,19*. ,14 ,12 ,14. ,07 ,16 ,01. N=105. * Significant at 0,05 level. 7. 8. 9. 1 ,31** ,24. 1 ,67. 1. ** Significant at 0,01 level. (p)PROB=Purchase probability, (p)FIT=Preference fit, (p)ENJOY=Process enjoyment, (d)INV=Desired involvement, (d)FREE=Design freedom, (n)INTERACT=Need for interaction, (e)USE=Ease of use, (p)INSIGHT=Preference insight, (c)ABIL=Customization ability. To avoid noise in the results interrelationships (>0.7) within the MOA components were further inspected. The variable with the lowest correlation with purchase probability and preference fit was then excluded from the model. The correlations between the motivation and opportunity components were all below 0.7. However, for the ability construct, ’customization ability’ was removed.. 34.
(37) 4.2. Hierarchical multiple regression to test the applicability of the MOA framework. A hierarchical multiple regression was performed to investigate the net value of MOA measures in the prediction of customer value. In step one the control variables were entered. Only the control variables that had a significant influence on customer value and a sufficient variance to make comparisons were included: Age, income, house budget and buying interest. For the nominal variables income and house budget dummy variables were created following the k(amount of groups)-1 principle. Step two contained the main variables. To avoid noise in the results, the model was reduced to the MOA measures with a significant correlation with both customer value measures: ”Process enjoyment”, ”Design freedom” and ”Ease of use”. In the third step interactions were included. The interaction variables were made by multiplying two variables (for example ’process enjoyment’ vs. ’design freedom’. To reduce problems with multicollinearity for the individual regression coefficients, the variables were mean centered (Iacobucci, Schneider, Popovich, & Bakamitsos, 2015). The results for both purchase probability and preference fit are shown in table 4.5 and table 4.6.. 35.
(38) 36. Control variables Age Income till 40.000 Income between 40-60.000 House budget less than 200.000 Interest in buying a new house Main variables (p)Enjoyment (d)Freedom (e)Use Interaction effects (p)Enjoyment x (d)Freedom (p)Enjoyment x (e)Use (e)Use x (d)Freedom R square R square change N=105. Variable. ,02 ,83 ,72 ,77 ,15. ,02 ,75 ,64 ,68 ,13 ,28 ,23 ,33. -,28** ,12 ,08 ,08 ,35** ,34** ,12 ,07. Model 2 β Std. Error. ,33 ,51 ,33** ,18** * =Significant at 0.05 lvl. -,29** ,17 ,17 ,09 ,48**. Model 1 β Std. Error. ,51 ,01. ,11. ,44** ,10 ,05. -,28** ,10 ,07 ,06 ,35**. ,06. ,38 ,24 ,33. ,02 ,76 ,64 ,69 ,13. Model 3 β Std. Error. Table 4.5: Regression analysis purchase probability. ,21. ,30 ,23 ,33. ,02 ,76 ,64 ,69 ,13 ,33** ,13 ,07. -,29** ,12 ,07 ,07 ,35**. ,30 ,24 ,34. ,02 ,75 ,64 ,69 ,13. Model 5 β Std. Error. -,04 ,22 ,51 ,51 ,00 ,00 ** = Significant at 0.01 lvl. ,00. ,34** ,12 ,07. -,28** ,11 ,08 ,09 ,35**. Model 4 β Std. Error.
(39) 37. Control variables Age Income till 40.000 Income between 40-60.000 Budget less than 200.000 Interest in buying a new house Main variables (p)Enjoyment (d)Freedom (e)Use Interaction effects (p)Enjoyment x (d)Freedom (p)Enjoyment x (e)Use (e)Use x (d)Freedom R square R square change N=105. Variable. ,01 ,39 ,34 ,36 ,07. ,01 ,27 ,23 ,25 ,05 ,10 ,08 ,12. ,40** ,39** ,07. Std. Error. -,11 ,16 ,15 -,10 ,09. Model 2 β. ,15 ,63 ,15* ,49** * =Significant at 0.05 lvl. -,13 ,28* ,30* -,07 ,30*. Model 1 β Std. Error. ,63 ,00. ,04. ,43** ,39** ,06. -,12 ,15 ,15 -,11 ,09. ,06. ,14 ,07 ,12. ,01 ,28 ,23 ,25 ,05. Model 3 β Std. Error. Table 4.6: Regression analysis preference fit. ,10. ,11 ,09 ,12. ,01 ,28 ,23 ,25 ,05 ,37** ,41** ,08. -,13 ,16 ,15 -,11 ,08 ,11 ,09 ,12. ,01 ,27 ,23 ,25 ,05. Model 5 β Std. Error. -,07 ,08 ,63 ,63 ,00 ,01 ** = Significant at 0.01 lvl. -,01. ,39** ,39** ,06. -,11 ,16 ,15 -,10 ,09. Model 4 β Std. Error.
(40) Interpretation of the results According to the Pearson correlation table ”process enjoyment”, ”design freedom”, and ”ease of use” were positively correlated with both independent variables. These three measures represent the three constructs of the MOA framework and therefore H4 was confirmed. However, the net value that was shown in the regression tables was not significant for all of the MOA components. For purchase probability only the motivation driver ”process enjoyment” had a significant impact on customer value. In addition, age and current interest in buying a house had a significant influence on the purchase probability. For preference fit only the motivation driver ”process enjoyment” and opportunity driver ”design freedom” had a significant impact on preference fit. Therefore H3 was rejected for both dependent variables. Since none of the interactions were significant, H5 was rejected.. 4.3. Group comparisons. 4.3.1. Comparison CvSS vs. AbA customization. Table 4.7 shows mean differences between the MOA drivers of the two customization conditions (CvSS vs. AbA customization). An independent samples t-test was performed to see if there were significant differences between the dependent variables of two groups. The results did not show any significant p-values.. Table 4.7: Mean differences CvSS vs. AbA customization Variable. Approach. Mean. SD. (p)PROB. ABA CvSS ABA CvSS ABA CvSS ABA CvSS ABA CvSS ABA CvSS ABA CvSS. 5,04 5,44 5,06 4,92 5,54 5,53 3,99 3,80 6,22 6,18 5,86 6,01 5,71 5,65. 3,34 3,40 1,42 1,40 1,34 1,19 1,45 1,56 1,02 ,88 1,01 ,71 1,02 1,05. (p)FIT (p)ENJOY (d)FREE (d)INV (e)USE (p)INSIGHT. (p)PROB=Purchase probability, (p)FIT=Preference fit, (p)ENJOY=Process enjoyment, (d)FREE=Design freedom, (e)USE=Ease of use, (p)INSIGHT=Preference insight. Practical findings An independent sample t-test showed a significant difference in the session time between the two customization approaches. A significant decrease of the time spend on customizing the house was shown in the group that used the CvSS approach (M=5.54, SD=3.150) compared to the AbA group (M=7.20, SD=4.410), t (93) = 2.122, p=0.038 (two-tailed).. 38.
(41) A second t-test was performed to investigate differences in the mean amount of the chosen options. The test showed no significant p-value between CvSS (M=8,63 additional options) and AbA (M=7.85 additional options). This means that the two groups were evenly likely to choose for an optional feature above the basic house design.. 4.3.2. Comparison the research conditions. First, the research conditions were compared on basis of the control variables to see if there was no significant difference between the characteristics of the respondents. These comparisons were made by performing a one-way Anova. Since no significant pvalues (p<0.05) were found it was assumed that the populations of the three conditions were equal. A one-way Anova was performed to differences between the three conditions in both purchase probability and preference fit. The results of the test did not show any significant difference between the three research conditions for both purchase probability (F (1,06, p=.35) and preference fit (F=2.4, p=.09). Figure 4.2 shows the spread of the differences between the three conditions. Based on the results of the Anova analyses both H1 and H2 were rejected. This means that there is no statistical significant prove of a difference in customer value between the three research conditions.. (a) Purchase probability. (b) Preference fit. Figure 4.2: Mean differences. 39.
(42) Chapter 5. Discussion This discussion section consists of four parts: 1) Theoretical implications and discussion, 2) Managerial implications and discussion, 3) Limitations and future research, and 4) Conclusion.. 5.1. Theoretical implications. 5.1.1. Finding a suitable measure for predicting customer value in on-line experiments with high cost products. If it is not possible to evaluate real purchases because a concept is still in its development phase, it is important to carefully consider the measure you use as predictor for future success of a concept. In current mass customization research willingness to pay (WTP) was a frequently used measure of customer value. However, direct measures of WTP can be biased (Breidert et al., 2006) and indirect measurement methods as used in the studies of Franke, Keinz, and Steger (2009b); Franke and Schreier (2010) are hard to apply for experiments with a high cost product as a house. Therefore, two alternate scales were examined: Purchase probability and Preference fit. The results of this study showed that the independent variables ”process enjoyment”, ”design freedom” and ”ease of use”, were better predictors of preference fit than of purchase probability. This difference could be explained by the different natures of the measures. In line with the research of Franke, Keinz, and Steger (2009b); Franke and Schreier (2010), preference fit is considered to be a good way to evaluate the solution space of a mass customization concept and the interface design. The actual purchase decision for buying a house depends on more than a good interface alone. Therefore, preference fit is considered to be the best measure to evaluate a single mass customization concept. Purchase probability is expected to give a better indication of the net value of the concept among the total amount of trade-offs that people make in their decision to buy a house.. 5.1.2. Application of the MOA framework. Motivation Motivation was defined by ”the intrinsic and extrinsic factors that increase a persons’ arousal to customize a house using a configurator.” The results of this study show that the extrinsic factor ’process enjoyment’ was the strongest predictor of both customer value measures. This compliments the findings of Franke and Schreier (2010) who already confirmed the relation between preference fit and process enjoyment for small customizable products.. 40.
Figure


+7


Outline
Related documents
Through viewing heritage sites that showcase the struggle history of the country like Liliesleaf Farm Museum and the Hector Pieterson Memorial & Museum, it is hoped
The use of sodium polyacrylate in concrete as a super absorbent polymer has promising potential to increase numerous concrete properties, including concrete
After successfully supporting the development of the wind power technology, an approach is needed to include the owners of wind turbines in the task of realizing other ways, other
students who obtained their subject credits at a tVet college national Diploma English Mathematics Physical Science/Applied Engineering Technology Three other subjects,
Outcomes of laparoscopic radical nephrectomy in the setting of vena caval and renal vein thrombus: seven-year experience. Sundaram CP, Rehman J, Landman J, Oh J: Hand
The NOx emissions during the synthetic gas combustion in the gas turbine combustion chamber depends on the temperature level and temperatures distribution, the local excess
The diagrams were generated using a modification of the classical Lloyd algorithm, in which the weights of the generators are fixed and only the locations are updated at each
information, school leaders, special education directors, teacher preparation programs, and policymakers may be better equipped with the knowledge necessary to support
