A sneak preview
The effects of transparency as a
function of product type
Anke Marrit Vellema
Master Communication Studies
Dr. A. Fenko & Dr. T.J.L. Van Rompay
Drs. M.H. Tempelman
Abstract
For the past few years, designers have been using transparency in package designs. Previous research suggests that transparent package designs influence for instance the evaluation of the product and increases the purchase intention. However, research has been conducted with a completely transparent package design versus a non-transparent package design. In this research, a small transparent window was added to a non-transparent design to be able to compare three different degrees of transparency. Another dimension of this study is the level of homogeneity, i.e. whether or not a product has a single or multiple composition. The aim of this study is to investigate to what extent transparency and homogeneity influence consumers’ evaluation of a product. To study this effect, a two (homogeneous versus heterogeneous product) by three (non-transparent, small transparent window and fully transparent package design) experimental design has been conducted. Two pre-studies provided a product and a design for the main study. Results show that transparency has a significant effect on perceived product evaluation, and that the homogeneous product is evaluated better compared to the heterogeneous product. Furthermore, regarding product trust, transparency is more important for the homogeneous product compared to the heterogeneous product. In addition, transparency does not significantly influence purchase intention. The results of this study provide information for package designers how different transparency and homogeneity levels affect with the evaluation of a product.
Table of content
1. Introduction 5
2. Theoretical framework 7
2.1 Package design and consumer decision making process 7
2.2 Transparency 8
2.3 Homogeneity of the product 9
2.4 Purchase intention 9
2.5 Consumer trust 10
2.6 Conceptual model 10
3. Method 12
3.1 Pre-studies 12
3.2 Main study 15
3.3 Demographics 16
4. Measures 17
4.1 Constructs 17
4.2 Reliability analysis 18
5. Results 21
5.1 Perceived product quality 21
5.2 Product evaluation of the package design 21
5.3 Product evaluation of the content 22
5.4 Overall product evaluation 23
5.5 Purchase intention 23
5.6 Product trust 23
5.7 Conclusion 25
6. Discussion and conclusion 26
6.1 Discussion 26
6.2 Limitations 28
6.4 Implications 29
7. References 31
Appendices 35
Appendix A – Measurement scales 35
Appendix B – Stimulus materials 39
Appendix C – Pre-study one 42
1.
Introduction
‘A split second is all it takes. A consumer can appraise a product in a matter of seconds. Some products look tasty, others do not. Some products look feminine, other products look more
masculine. It is impressive that consumers can make an evaluation, regardless if the consumers used this product before. Product packaging has a strong influence on the affinity of brands. Subtle elements like color, shape and texture, create unconscious expectations about the taste, quality, luxury and the personality of the brand‘ (Amsterdam Brand, n.d.).
Imagine walking in your favorite supermarket looking for groceries. On what characteristic will you base your decision: visual appearance, price or your previous experiences. Many characteristics can influence your behavior, and different materials and different shapes might affect your decision. Most product packages change over time. One of the exceptions are meat products of which
packaging has always been transparent, so that you can easily make an evaluation. However, meat is not the only product with a transparent package. More and more producers add transparency to the design of their product packaging, and cookies, rice and spaghetti are examples of such products. Is this necessary and will this influence your behavior? Is there a general rule for the use of
transparency or is this dependent on the type of product? The level of transparency and the level of homogeneity (i.e. whether or not a product has a single or multiple composition) might interact and influence the evaluation of the quality of a product, the purchase intention or the level of trust consumers have in a product.
Nowadays, products are more the same (Van Rompay & Veltkamp, 2014), and for this reason designers of product packages have to be more creative to get attention from a customer
(Underwood & Ozanne, 1998; Van Rompay & Veltkamp, 2014). As Clement (2007) claims: ‘what you see is what you choose’ (p. 918). Before making a decision, consumers look at the product and therefore visual appearance is an important factor in the decision-making process. As a matter of fact, visual appearance is the most critical factor in the process of deciding whether a product is of high or poor quality (Fenko, Schifferstein & Hekkert, 2010; Spence 2016). The package design has to be different from competitors (Underwood & Ozanne, 1998; Rompay & Veltkamp, 2014), and evaluated more positively (Venter, van der Merwe, Beer, Kempen and Bosman, 2001) to be the first choice of a consumer.
dishonest impression to consumers about the content of the package. For example, the colors might be brighter or the product might be shown in an inaccurate proportion (Underwood & Ozanne, 1998). Consumer trust increases if the actual product is better visible and according to Troy and Kerry (2010), the color of food products is an important clue for consumers. Products covered with a completely non-transparent package do not provide this essential information of the product.
Although transparency provides information about the content, the study of Keizer (2016) shows that different products require different designs: for cookies transparency is not important but for pasta a non-transparent package design is recommended. Different products require different strategies of packaging and this might apply to products out the same category but with different homogeneity levels.
Every company wants to sell his products and trust is therefore an important factor. Products with an advantage are more likely to be noticed and therefore chosen. Package design is an important aspect and the first sense consumers use to evaluate the product is vision. Nonetheless, the evaluation of a completely non-transparent package depends on the package design instead of the product itself. The practical relevance of this study applies to designers and organizations intending to inform consumers differently and honestly.
The theoretical relevance of this study is to determine to what extent transparency influences the evaluation of a product. In addition to studies with transparent and non-transparent package designs, this study not only includes a small transparent window which allows consumers to see a fraction of the product, but also uses products of different homogeneity levels. This research focuses on the main effect of three different degrees of transparency, and interaction with the level of homogeneity, i.e. whether a product contains single versus multiple types of products, on different aspects of product evaluation. Therefore the following question has been formulated:
To what extent does transparency in a package design influence the evaluation of a product and
2.
Theoretical framework
2.1 Package design and consumer decision making process
The most important sense at the moment of buying a product is vision (Fenko, Schifferstein & Hekkert, 2010; Spence, 2016). As well as in this study, vision is the most important aspect. According to Schifferstein, Fenko, Desmet, Labbe and Martin (2013), food products are different from many other products because the five human senses - audition, smell, taste, touch, and vision - are involved. However, not all situations are in line with this statement (Lederman, Thorne & Jones, 1968). Fenko et al. (2010) stated that culture is an important determinant to indicate which of the senses is more dominant.
more important when consumers have to make a decision. In creating multisensory consistency, transparency can be used to provide information and eliminate the barricade between the consumers and the product inside the package.
2.2 Transparency
Product package designs are different and producers want their products to be unique (Schifferstein et al., 2013). Different degrees of transparency - non-transparent, semi-transparent (small window), and completely transparent packages - provide different information about the product. An
advantage of transparency like a small window is the possibility to see the actual product. Consumers are able to make an evaluation based on what they see, instead of, the taste, the smell or a picture of the product (Fenko et al., 2010; Spence 2016). According to the study of Keizer (2016), too much transparency was not preferred, based on pasta and cookies: the appealing picture on the non-transparent package design affected the evaluation of the product positively. Furthermore, different products have different results regarding the level of transparency. As Keizer (2016) stated, the package design of cookies could use a non-transparent as well as a transparent package design, however with pasta a non-transparent package design is recommended. As the study of Kroese (2017) concludes: the most transparent package design has the highest evaluation of the perceived healthiness and the perceived freshness compared to the partly transparent and the non-transparent packages. Product liking, perceived healthiness and perceived freshness were measured and the packages that included a degree of transparency were evaluated better (Kroese, 2017). Since a level of transparency in package designs shows the content, consumers can make an evaluation based on what they see. Because vision is an important factor in the decision-making process and product experience, the following hypotheses have been formulated:
Hypothesis 1: The more transparent a package design is, the higher the perceived product quality.
Hypothesis 2: The more transparent a package design is, the higher the evaluation of the content of
the package.
Hypothesis 3: The more transparent a package design is, the higher the evaluation of the package
2.3 Homogeneity of the product
Nowadays, a whole range of different products are available in supermarkets. According to
Underwood and Ozanne (1998), products give a dishonest impression if the proportions of the actual food components are not the same as those on the image of a package design. Heterogeneous products, which contain multiple types of products, and homogeneous products, which only contain one product, have different levels of homogeneity.Consumers need to trust a company that for example sells fruit, that they do equally divide the different types of fruit within the package. When a consumer chooses to purchase a heterogeneous product, he expects that all fruit types are present. A consumer who chooses to buy the homogeneous product, assumes that the company includes only one type of fruit. Not only is the distribution of different pieces of fruit important, but, for example, the quality, freshness, and appearance are also important clues. The level of trust in the
heterogeneous product should be more important compared to the homogeneous product. By including a transparent package design for the heterogeneous product, there is less uncertainty for consumers. According to Schoormans and Robben (as cited in Clement, Kristensen & Grønhaug, 2013), a more complex or conflicting package design forces customers to think harder than with a less complex design. This indicates that a complex design or product is more dependent on transparency to provide information about the content. Therefore transparency in heterogeneous products is more important compared to homogeneous products. This indicates that a misleading impression can be minimized with a transparent package design. Transparency is important to evaluate quality, package design, and content, to have a higher purchase intention and to increase the level of trust of a heterogeneous product. Therefore the following hypothesis has been formulated:
Hypothesis 5: The effects of transparency are more important for the heterogeneous product
compared to the homogeneous product.
2.4 Purchase intention
foundation, and to give a positive evaluation about a product or to become a brand-loyal customer. On the contrary, when there is no trust, contributors will not spend money and customers will not buy a product (Bandsuch et al.; Grunig & Huang, as cited in Auger, 2014). Simmonds and Spence (2016) show that a transparent package design boosts trust, indicating that trust is important for consumers, and results in a higher purchase intention. Therefore the following hypothesis has been formulated:
Hypothesis 6: The more transparent a package design is, the higher the purchase intention.
2.5 Consumer trust
Rousseau, Sitkin, Burt and Cremerer (1998) conducted a literature study and compared various definitions of trust, and made the following broad definition of trust: ‘trust is a psychological state comprising the intentions to accept vulnerability based upon positive expectations of the intentions or behavior of another’ (Rousseau et al., 1998, p. 395).
According to Rawlins (2008), trust and transparency are associated, and to become more
transparent, a brand should work on gaining consumer’s trust. Simmonds and Spence (2016) show that a transparent package design boosts trust, leading to an increased willingness to buy this product (Billeter et al. 2012). Customers determine the quality of a product based on the level of trust, and this is even stronger when a package design confirms the prediction of customers (Simmonds & Spence, 2016). Based on the association between transparency of a package design and trust in the product, the following hypothesis has been set:
Hypothesis 7: The more transparent a package design is, the higher the trust in the product.
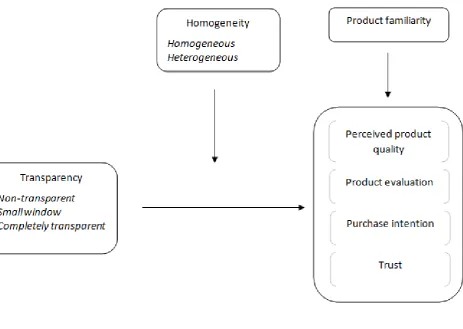
2.6 Conceptual model
3.
Method
For this study, a two by three design (figure 1) has been developed: three levels of transparency along with two homogeneity levels. In order to design the stimulus materials, two pre-tests have been conducted. This chapter provides the results of the pre-studies, followed by the method for the main study.
3.1 Pre-studies
Two pre-studies were conducted to explore different products and different homogeneity levels. In pre-study one, questions about quality, appearance, honesty, and homogeneity levels were asked on a 7-point Likert scale to evaluate five products (fruit, vegetables, nuts, licorice, and muesli) (N=40). Stimulus materials and questions can be found in appendix C.
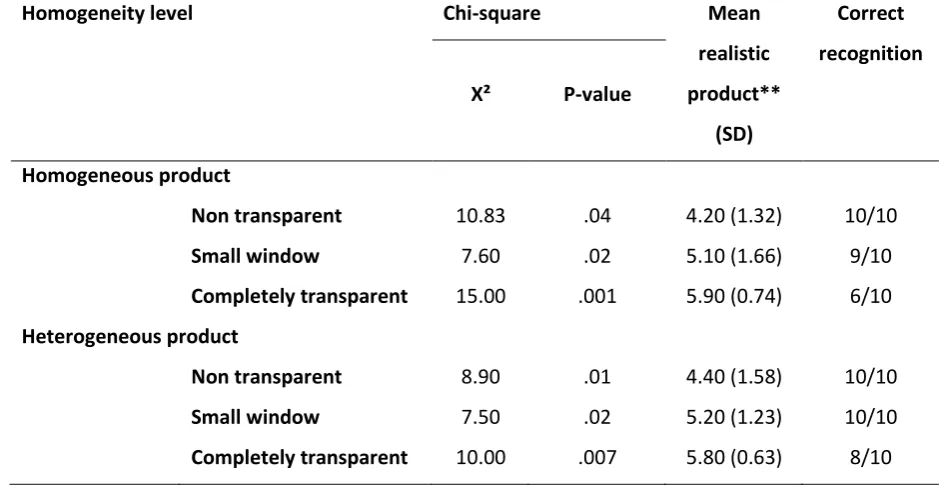
The second pre-study was conducted to establish the interpretations of the stimulus materials (N=30), because it has to match the intentions of the design. Participants were asked to answer questions about the appearance (7-point Likert scale) and degrees of transparency (yes-no questions) for one transparency level (non-transparent, small window or completely transparent). Finally, participants had to choose between the three transparency levels based on a picture. All questions can be found in appendix D.
The conclusion of the pre-studies is that fruit is used as type of product for this research because appearance and homogeneity levels are significantly different (table 1): there is a significant difference between the homogeneous and the heterogeneous product, although the homogeneity score is below average (on a 7-point Likert scale). There is a distinction between both levels,
Figure 2. Non-transparent - Figure 3. Small window - Figure 4. Completely
homogeneous product homogeneous product transparent - homogeneous
product
Figure 5. Non-transparent - Figure 6. Small window - Figure 7. Completely
heterogeneous product heterogeneous product transparent -
[image:13.595.399.543.85.309.2] [image:13.595.48.187.400.620.2]Table 1. Pre-study one, paired samples t-test between different products.
* Significant at a .05 level.
** Measured on a 7-point Likert scale.
Table 2. Pre-study two, chi-square analysis.
α = .05
** Measured on a 7-point Likert scale. Product Variable Mean
Homogeneous**
(SD)
Mean
Heterogeneous**
(SD)
T-value P-value
Muesli Appearance 4.95 (0.98) 4.60 (1.11) 1.09 .29 Homogeneity 3.30 (1.22) 4.10 (1.65) -1.62 .12 Licorice Appearance 4.45 (0.94) 4.12 (1.40) 0.97 .34 Homogeneity 3.00 (1.26) 3.10 (1.41) -0.22 .83 Nuts Appearance 4.47 (0.84) 4.33 (1.20) 0.44 .67 Homogeneity 3.05 (1.39) 3.10 (1.12) -0.13 .90 Fruit Appearance 4.35 (1.68) 5.53 (0.84) -2.79 .01*
Homogeneity 2.85 (1.18) 3.75 (1.52) -2.10 .05* Vegetables Appearance 4.35 (1.68) 4.20 (1.08) 0.35 .73
Homogeneity 3.15 (1.15) 4.40 (1.35) -0.42 .01*
Homogeneity level Chi-square Mean
realistic
product**
(SD)
Correct
recognition
X² P-value
Homogeneous product
Non transparent 10.83 .04 4.20 (1.32) 10/10
Small window 7.60 .02 5.10 (1.66) 9/10
Completely transparent 15.00 .001 5.90 (0.74) 6/10 Heterogeneous product
Non transparent 8.90 .01 4.40 (1.58) 10/10
Small window 7.50 .02 5.20 (1.23) 10/10
[image:14.595.60.530.441.684.2]3.2 Main study
3.2.1 Participants
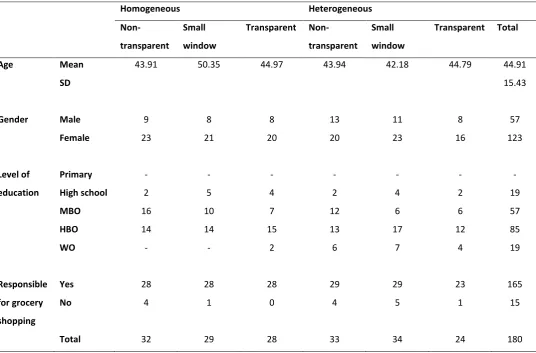
Participants of this study live in the Netherlands, speak Dutch, and are eighteen years or older. Demographics, like age, gender, and the level of education were measured to make distinctions between participants possible. At least 150 participants were required to give reliable conclusions. Possible participants were approached via social media, mail or personally in the supermarket. The participants received an anonymous link, which led to the questionnaire. The participants in the ‘Jumbo’ supermarket in Coevorden were approached on January 26, between 10:00 AM and 4:00 PM, and the questionnaire was completed on a laptop. After data collection, results providing information about the different products with different transparency and homogeneity levels, were analyzed. Participants who did not recognize the stimulus materials correct, were excluded from this research. A chi-square test showed no significant difference between the different conditions and the gender of the participants, X²(5) = 1.48, p = .92. An ANOVA revealed no statistical evidence of a difference between different conditions and the age of the participants, F(5) = 0.99, p = .43. The sample is random and further analysis can be conducted.
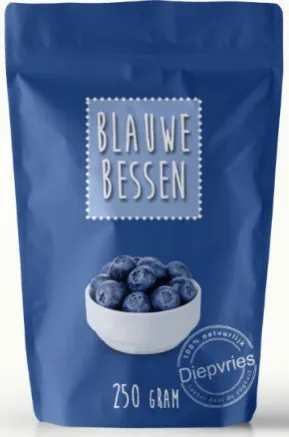
3.2.2 Stimulus materials
The stimulus materials used in this study are shown in figure 2-7. There are two homogeneity levels and three transparency levels. The first homogeneity level is a homogeneous product; there is only one product inside (figure 2-4). The second homogeneity level is a heterogeneous product; there is more than one product inside (figure 5-7). The three degrees of transparency are: a non-transparent package design (figure 2 and 5), a small window (figure 3 and 6), and a completely transparent package design (figure 4 and 7). Figure 2 and 5 show a non-transparent package design: product information depends on the information provided on the package design. No information can be acquired from the product itself. Figure 3 and 6 show a small window package design with a partly visible product. Figure 4 and 7 show a completely transparent package design; all of the content is visible.
3.2.3 Procedure
3.3 Demographics
[image:16.595.32.569.232.585.2]Out of a total of 57 male and 123 female participants, 165 participants are responsible for grocery shopping and the mean age is 40.74 (table 3). 19 graduated from high school, 57 from secondary vocational education (middelbaar beroepsonderwijs, MBO), 85 from higher professional education (hoger beroepsonderwijs, HBO), and 19 participants have a university degree (wetenschappelijk onderwijs, WO).
Table 3. Overview demographic results.
Homogeneous Heterogeneous
Non-transparent
Small
window
Transparent
Non-transparent
Small
window
Transparent Total
Age Mean 43.91 50.35 44.97 43.94 42.18 44.79 44.91
SD 15.43
Gender Male 9 8 8 13 11 8 57
Female 23 21 20 20 23 16 123
Level of Primary - - - -
education High school 2 5 4 2 4 2 19
MBO 16 10 7 12 6 6 57
HBO 14 14 15 13 17 12 85
WO - - 2 6 7 4 19
Responsible Yes 28 28 28 29 29 23 165
for grocery No 4 1 0 4 5 1 15
shopping
4.
Measures
This chapter presents general information of the main study, starting with an overview of the different constructs followed by a reliability analysis.
4.1 Constructs
The following constructs were measured on a 7-point Likert scale: perceived product quality, product evaluation, purchase intention, trust, and the covariate product familiarity. Most questions originate from existing scales and some had to be rephrased in order to fit into this research. Appendix A and table 4 provide an overview of existing scales with rephrased questions and (translated) questions with the corresponding reliability coefficient, respectively.
4.1.1 Perceived product quality
Differences in perceived taste experience of the participants were measured asking questions about taste, smell, and structure of the product. Questions from Fenko, Kersten and Bialkova (2016) were used to create this construct. Examples of questions are: ‘I think the appearance of this product will be good ‘ and ‘I think the texture of this product will be good’.
4.1.2 Product evaluation
This construct is divided into two sub-constructs: evaluation of package design and evaluation of the content. The questions were retrieved from Fenko, Otte & Schifferstein (2010) and Fenko et al. (2016). In the first sub-construct questions about appearance (‘I think this is a beautiful product’) and price (‘I think this is an expensive product’) were asked. Examples of questions in the second sub-construct are: ‘I think this is a fresh product’, ‘I think this is an unnatural product’, and ‘I think this product will be crushed when taken out of the package’.
4.1.3 Purchase intention
4.1.4 Trust
In this construct, questions about product trust and brand trust, as retrieved from Wulf, Odekerken-Schröder & Iacubuccini (2001), Hsiao, Chuan-Chuan Lin, Wang, Lu and Yu (2010), and Chaudhuri and Holbrook (2001) were asked, and ‘I think this product is safe to use’ and ‘I think this is a reliable product’ are examples of questions used to measure product trust, and ‘I think the company is reliable’ and ‘I think the company is honest’ are examples of questions used to measure brand trust.
4.1.5 Covariate
Product familiarity could influence perceived product quality, product evaluation, purchase intention, and product trust. The stimulus materials are non-existing products, and used questions like ‘I have heard of a similar product’ and ‘I have experience with a similar product’, are framed if participants are familiar with a similar product and are based on the measurement scale from Kent and Allen (1994).
4.2 Reliability analysis
Reliability of the different constructs are displayed in table 4. A Cronbach’s alpha score lower than .60 is not reliable and will be excluded from further research (H. Vos, personal communication, September, 2015). The perceived product quality construct has a Cronbach’s Alpha of .68, which is lower than the scores of the other constructs. After conducting an analysis of the best subset of items, the Cronbach’s Alpha decreased, and creating more constructs did not increase the
Table 4. Cronbach’s Alpha of the constructs.
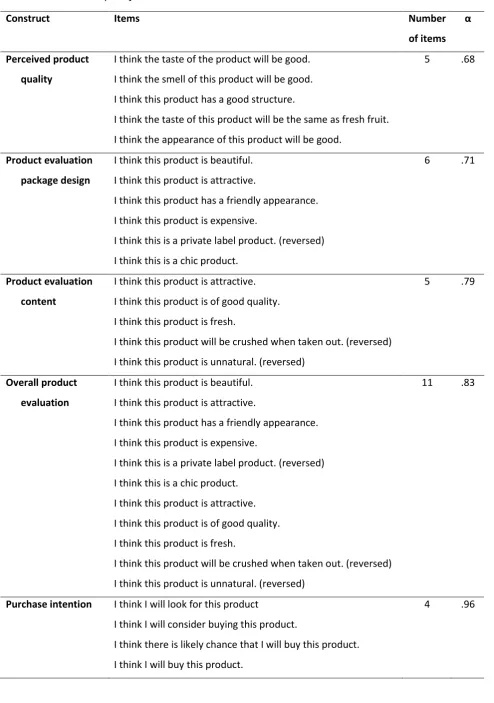
Construct Items Number
of items α
Perceived product I think the taste of the product will be good. 5 .68 quality I think the smell of this product will be good.
I think this product has a good structure.
I think the taste of this product will be the same as fresh fruit. I think the appearance of this product will be good.
Product evaluation I think this product is beautiful. 6 .71 package design I think this product is attractive.
I think this product has a friendly appearance. I think this product is expensive.
I think this is a private label product. (reversed) I think this is a chic product.
Product evaluation I think this product is attractive. 5 .79 content I think this product is of good quality.
I think this product is fresh.
I think this product will be crushed when taken out. (reversed) I think this product is unnatural. (reversed)
Overall product I think this product is beautiful. 11 .83 evaluation I think this product is attractive.
I think this product has a friendly appearance. I think this product is expensive.
I think this is a private label product. (reversed) I think this is a chic product.
I think this product is attractive. I think this product is of good quality. I think this product is fresh.
I think this product will be crushed when taken out. (reversed) I think this product is unnatural. (reversed)
Purchase intention I think I will look for this product 4 .96 I think I will consider buying this product.
Product trust I think this product is reliable. 4 .88 I think this product is trustworthy.
I think this product is safe to use.
I think this product is honest (what you see is what you get).
Brand trust I think the company is trustful. 3 .95
I think the company is honest.
I think the company takes its responsibility.
Covariate - I have heard of a similar product. 3 .91
5.
Results
5.1 Perceived product quality
Figure 8.
An ANCOVA analysis revealed a significant main effect of the transparency level on perceived product quality (F(2, 173) = 6.13, p = < .001). The results show that the completely transparent package design (M = 4.76, SD = 1.09) is evaluated more positive compared to the small window (M = 4.35, SD = 1.07) and the non-transparent package design (M = 4.00, SD = 1.03). When participants
[image:21.595.346.571.126.276.2]are able to see the content of the product, the evaluation of the product quality increases. Figure 9.
An ANCOVA analysis revealed a marginally significant main effect of homogeneity on perceived product quality (F(1, 173) = 3.23, p = .07). The results show that the homogeneous product (M = 4.46, SD = 1.20) is evaluated more positive compared to the heterogeneous product (M = 4.22, SD = 0.99), indicating that the homogeneous product is evaluated tastier compared to the heterogeneous product.
No interaction effect was found between homogeneity and transparency (F < 1, ns) for perceived product quality.
[image:21.595.344.570.602.752.2]
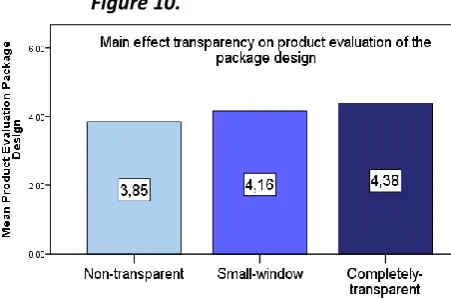
5.2 Product evaluation of the package design
Figure 10.
An ANCOVA analysis revealed a significant main effect of the transparency level on the evaluation of the package design (F(2, 173) = 3.69, p = .03). The results show that the completely transparent package design (M = 4.38, SD = 0.88) is evaluated more positive compared to the small window (M = 4.16, SD = 0.93) and the non-transparent package design (M = 3.85, SD = 1.08). When participants
The results show there is no significant main effect of homogeneity on the evaluation of the package design (F < 1, ns).
No interaction effect was found between homogeneity and transparency (F < 1, ns) for the evaluation of the package design.
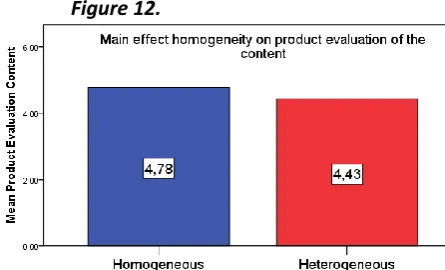
5.3 Product evaluation of the content
Figure 11.
An ANCOVA analysis revealed a significant main effect of the transparency level on the evaluation of the content (F(2, 173) = 4.62, p = .01). The results show that the completely transparent package design (M = 5.00, SD = 1.10) is evaluated more positive compared to the small window (M = 4.63, SD = 1.13) and the non-transparent package design (M = 4.27, SD = 1.19). When the
participants are able to see the content of the product, the evaluation of the content increases. Figure 12.
An ANCOVA analysis revealed a significant main effect of homogeneity on the evaluation of the content (F(1, 173) = 20.35, p = < .001). The results show that the homogeneous product (M = 4.78, SD = 1.23) is evaluated more positive compared to the heterogeneous product (M = 4.43, SD = 1.10), indicating that the homogeneous product is
evaluated better compared to the heterogeneous products.
[image:22.595.354.577.406.541.2]5.4 Overall product evaluation
Figure 13.
An ANCOVA analysis revealed a significant main effect of the transparency level on the evaluation of overall product evaluation (F(2, 173) = 5.24, p = .01). The results show that the transparent package design (M = 4.67, SD = 0.83) is evaluated more positive compared to the small window (M = 4.38, SD = 0.95) and the non-transparent package design (M = 4.04, SD = 1.00). When participants are able to see the content of the product, the overall product evaluation increases.
The results show no significant main effect of homogeneity on the overall product (F < 1, ns).
No interaction effect was found between homogeneity and transparency (F < 1, ns) for the overall product evaluation.
5.5 Purchase intention
The results show no significant main effect of homogeneity on purchase intention (F < 1, ns) and no significant main effect of transparency on purchase intention (F < 1, ns). No interaction effect was found between homogeneity and transparency (F < 1, ns) for purchase intention.
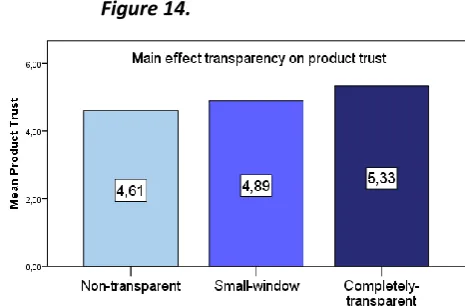
5.6 Product trust
Figure 14.
[image:23.595.339.572.557.710.2]Figure 15.
An ANCOVA analysis revealed a significant main effect of homogeneity on product trust (F(1, 173) = 13.57, p = < .001). The results show that the homogeneous product (M = 5.21, SD = 1.22) is evaluated more positive
compared to the heterogeneous product (M = 4.63, SD = 1.13), indicating that participants have more trust in the
homogeneous product compared to the heterogeneous product.
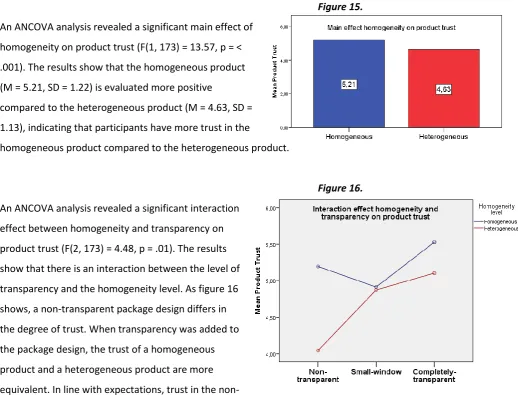
Figure 16.
An ANCOVA analysis revealed a significant interaction effect between homogeneity and transparency on product trust (F(2, 173) = 4.48, p = .01). The results show that there is an interaction between the level of transparency and the homogeneity level. As figure 16 shows, a non-transparent package design differs in the degree of trust. When transparency was added to the package design, the trust of a homogeneous product and a heterogeneous product are more equivalent. In line with expectations, trust in the
[image:24.595.71.590.71.466.2]5.7 Conclusion
The following table (table 5) provides an overview of the hypotheses and the corresponding results.
Table 5. Overview of hypotheses.
Hypotheses Result
H1 The more transparent a package design is, the higher the perceived product quality.
Accepted
H2 The more transparent a package design is, the higher the evaluation of the package.
Accepted
H3 The more transparent a package design is, the higher the evaluation of the content of the package design.
Accepted
H4 The more transparent a package design is, the higher the overall product evaluation.
Accepted
H5 The more transparent a package design is, the higher the purchase intention. Rejected
H6 The effects of transparency are more important for the heterogeneous product compared to the homogeneous product.
Partly rejected* H7 The more transparent a package design is, the higher the trust in the product. Accepted
6.
Discussion and conclusion
This chapter presents an overview of the results, starting with the discussion, followed by the limitations of this study, conclusion, and implications.
6.1 Discussion
Although it was not hypothesized, there are main effects from homogeneity to perceived product quality, product evaluation of the content, and product trust; there is no interaction effect between the transparency and homogeneity except to product trust. Simmonds and Spence (2016) show that a transparent package design boosts trust and vision is important for product evaluation (Fenko et al. 2010). For the non-transparent package design there is a difference between trust in the
homogeneous product and trust in the heterogeneous product. Consumers have more trust in the non-transparent homogeneous package design compared to the non-transparent heterogeneous package design. For the amount of trust consumers have in a product, it is important that a
heterogeneous product has a transparent package design. To evaluate the perceived product quality, product evaluation, and purchase intention, transparency is important and the homogeneity level does not influence this evaluation. Both are visual cues and processed the same. A possible
explanation could be that there is too much information to process which leads to cognitive overload (Spreitzer, 2006). Both manipulations (transparency and homogeneity) are visual cues and that might be too much to process at the same time. In order to evaluate the perceived product quality, product evaluation, and purchase intention, transparency is more important than the homogeneity level. It does not matter if the content of the package design is homogeneous or heterogeneous, as long as the package design is transparent, the evaluation of the dependent variables is better compared to the non-transparent design and the small window design. It is important for fruit to see the product itself (Fenko et al. 2010; Spence, 2016), and Schoormans and Robben (as cited in Clement, Kristensen & Grønhaug, 2013) suggested that a complex product requires more thinking. Transparency should decrease the problem of a barricade, because the product is directly visible, however it did not apply to most variables. Consumers want to know what the actual fruit looks like, i.e. the color of fruit or if it is moldy, the color of fruit is an important clue for consumers (Troy & Kerry, 2010). There is no difference in the evaluation of one type of fruit of multiple types of fruit in the package design. Most likely, consumers want to have the most appealing fruit to keep it fresh as long as possible, therefore it is important to see the quality at the moment of buying. Transparency is therefore an important component and it does not matter how many fruit types are inside. For the trust consumers have in the product, the level of homogeneity is important and influences the relationship between the level of transparency and trust.
intention, and trust). An important note is that product familiarity increases when the package design is more transparent. The participants recognized the product more when the content was visible, this holds for both levels of homogeneity. Participants could be familiar with the content of the product, not the product itself. Because of this, participants might get confused and answered ‘no’ on this question. Furthermore, different types of trust were measured: product trust and brand trust. The results show there is a correlation between the two types of trust. There was no brand visible on the package designs and yet participants gave their opinion on trust in the brand. Notable is the fact that participants had to make the evaluation based on the appearance of the package design.
6.2 Limitations
opinion about products. Finally, a questionnaire does not measure why people think the way they do. It provides the opinion on the asked questions, however the reasoning is an important factor as well.
6.3 Conclusion and future research
The aim of this study was to investigate ‘to what extent does transparency in a package design influence the evaluation of a product and furthermore to what extent does homogeneity influence the
effects of transparency?’ Results of this study show that transparent package designs have a higher
evaluation of the perceived product experience, higher evaluation of the content, higher evaluation of the package design, higher overall evaluation, and more trust compared to a non-transparent package or a small window design. This study did not show results on the interaction between transparency and homogeneity, except for product trust. Only for the non-transparent package design, there is a difference in the amount of trust consumers have in the homogeneous product and the heterogeneous product. The consumers have more trust in the non-transparent homogeneous product.
The first suggestion for further research is to repeat the study with a real product and the possibility to taste the product. The second suggestion is to use different products to make sure it applies to other food products as well. If there will be a change in the way designers design the packages, it is important that there are significant results for multiple food categories. There are interesting results with frozen fruit and to make sure transparency and the interaction between transparency and homogeneity occur in different products, comparable research needs to be conducted, for example with vegetables, but for other non-food related products as well. Because of the results from pre-study one, further research has to be conducted to a homogeneous product which is evaluated as homogeneous and a heterogeneous product which is evaluated as heterogeneous. Except for
different types of food, it is important to investigate different types of supermarkets as well, because consumers in different supermarkets have different demands. Finally, further research has to clarify why there is no main effect on purchase intention.
6.4 Implications
6.4.1 Practical implications
show, there is some information that companies can use in designing packages. A higher level of transparency, results in a higher mean score of perceived product quality, evaluation of the package design, and evaluation of the content. There is an advantage in using transparency for packaging food products. When the content of a product is heterogeneous, consumers evaluate for example the perceived product quality significant lower, compared to the homogeneous product. Product trust results into brand trust and, for this reason, designers have to include transparency in their package designs in order to increase trust in a brand. Even if there is no brand visible, transparent product designs are more trustful and related to a trustful brand.
6.4.2 Theoretical implications
The theoretical relevance was to find out if the small window makes a difference in the evaluation of a product and whether transparency and homogeneity interact. The findings suggest that the transparent package design is better evaluated on perceived product quality, evaluation of the content, evaluation of the package design, overall product evaluation, and product trust. According to the results, the small window does influence the consumers’ evaluation, although the results of the completely transparent package designs are better evaluated. This knowledge can be used for further research. More research to homogeneity and transparency is necessary to conclude if there is an interaction between transparency and complexity.
7.
References
Alba, J. W., & Hutchinson, J. W. (1987). Dimensions of consumer expertise. Journal of consumer research, 13(4), 411-454.
Amsterdam Brand, Impliciet Markerting Research (n.d.). Retrieved from:
http://amsterbrand.com/impliciete-marketing/69-verpakkingspsychologie, 04-04-2018.
Ajzen, I. (1991). The theory of planned behavior. Organizational behavior and human decision processes, 50(2), 179-211.
Auger, G. A. (2014). Trust me, trust me not: An experimental analysis of the effect of transparency on organizations. Journal of Public Relations Research, 26(4), 325-343.
Bettman, J. R., & Park, C. W. (1980). Effects of prior knowledge and experience and phase of the choice process on consumer decision processes: A protocol analysis. Journal of consumer research, 7(3), 234-248.
Billeter, D., Zhu, M., & Inman, J. J. (2012). Transparent Packaging and Consumer Purchase Decisions. NA-Advances in Consumer Research Volume 40.
Butkevičienė, V., Stravinskienė, J., & Rūtelionienė, A. (2008). Impact of consumer package communication on consumer decision making process. Engineering Economics, 56(1).
Chaudhuri, A., & Holbrook, M. B. (2001). The chain of effects from brand trust and brand affect to brand performance: the role of brand loyalty. Journal of marketing, 65(2), 81-93.
Clement, J. (2007). Visual influence on in-store buying decisions: an eye-track experiment on the visual influence of packaging design. Journal of marketing management, 23(9-10), 917-928.
Clement, J., Kristensen, T., & Grønhaug, K. (2013). Understanding consumers' in-store visual perception: The influence of package design features on visual attention. Journal of Retailing and
Dainton, M., & Zelley, E. D. (2014). Applying communication theory for professional life: A practical introduction. Sage publications.
David, P., Kline, S., & Dai, Y. (2005). Corporate social responsibility practices, corporate identity, and purchase intention: A dual-process model. Journal of Public Relations Research, 17(3), 291.
Diamond, W., & Oppenheim, R. M. (2004). Product Development, Packaging, Pricing and Place. Journal of Business & Finance Librarianship, 9(4), 269-284.
Fenko, A., Kersten, L., & Bialkova, S. (2016). Overcoming consumer scepticism toward food labels: The role of multisensory experience. Food quality and preference, 48, 81-92.
Fenko, A., Otten, J. J., & Schifferstein, H. N. (2010). Describing product experience in different languages: The role of sensory modalities. Journal of Pragmatics, 42(12), 3314-3327.
Fenko, A., Schifferstein, H. N., & Hekkert, P. (2010). Shifts in sensory dominance between various stages of user–product interactions. Applied ergonomics, 41(1), 34-40.
Grunert, K. G., Bech-Larsen, T., & Bredahl, L. (2000). Three issues in consumer quality perception and acceptance of dairy products. International Dairy Journal, 10(8), 575-584.
Hsiao, K. L., Chuan-Chuan Lin, J., Wang, X. Y., Lu, H. P., & Yu, H. (2010). Antecedents and consequences of trust in online product recommendations: An empirical study in social shopping. Online Information Review, 34(6), 935-953.
Keizer, J. (2016). The visual influence of transparent product packages (Master’s thesis). Retrieved from: http://essay.utwente.nl/view/faculty/BMS.html
Kent, R. J., & Allen, C. T. (1994). Competitive interference effects in consumer memory for advertising: the role of brand familiarity. The Journal of Marketing, 97-105.
Lederman, S. J., Thorne, G., & Jones, B. (1986). Perception of texture by vision and touch: multidimensionality and intersensory integration. Journal of Experimental Psychology: Human Perception and Performance, 12(2), 169.
Park, C. W., & Moon, B. J. (2003). The relationship between product involvement and product knowledge: Moderating roles of product type and product knowledge type. Psychology & Marketing, 20(11), 977-997.
Raju, P. S., & Reilly, M. D. (1980). Product familiarity and information processing strategies: An exploratory investigation. Journal of Business Research, 8(2), 187-212.
Rawlins, B. (2008). Measuring the relationship between organizational transparency and trust. Public Relations Journal, 2(2), 425–439.
Rawlins, B. (2008). Give the emperor a mirror: Toward developing a stakeholder measurement of organizational transparency. Journal of Public Relations Research, 21(1), 71-99.
Rompay, T. J., & Veltkamp, M. (2014). Product packaging metaphors: Effects of ambiguity and explanatory information on consumer appreciation and brand perception. Psychology & marketing, 31(6), 404-415.
Rousseau, D. M., Sitkin, S. B., Burt, R. S., & Camerer, C. (1998). Not so different after all: A cross-discipline view of trust. Academy of management review, 23(3), 393-404.
Schifferstein, H. N., Fenko, A., Desmet, P. M., Labbe, D., & Martin, N. (2013). Influence of package design on the dynamics of multisensory and emotional food experience. Food Quality and Preference, 27(1), 18-25.
Schifferstein, H.N.J. & Spence, C. (2008). Multisensory product experience. In Schifferstein, H.N.J. & Hekkert, P. (Eds.) Product experience (pp. 133-161) Retrieved from:
http://ezproxy2.utwente.nl:2078/science/book/9780080450896
Schoonbrood, J. M. J. (2016). Shaping designs: Effects of the graphic design of packaging sales promotion shapes and products’ packaging shapes on customers’ expectations, pre-purchase attitude
Simmonds, G., & Spence, C. (2016). Thinking inside the box: How seeing products on, or through, the packaging influences consumer perceptions and purchase behaviour. Food Quality and Preference.
Söderlund, M. (2002). Customer familiarity and its effects on satisfaction and behavioral intentions. Psychology & Marketing, 19(10), 861-879.
Spears, N., & Singh, S. N. (2004). Measuring attitude toward the brand and purchase intentions. Journal of Current Issues & Research in Advertising, 26(2), 53-66.
Spence, C. (2016). Multisensory packaging design: Colour, shape, texture, sound, and
smell. Integrating the packaging and product experience: A route to consumer satisfaction, 1-22.
Spreitzer, G. M. (2006). Leading to grow and growing to lead: Leadership development lessons from positive organizational studies. Organizational Dynamics, 35(4), 305-315.
Troy, D. J., & Kerry, J. P. (2010). Consumer perception and the role of science in the meat industry. Meat science, 86(1), 214-226.
Underwood, R. L., & Ozanne, J. L. (1998). Is your package an effective communicator? A normative framework for increasing the communicative competence of packaging. Journal of Marketing Communications, 4(4), 207-220.
Venter, K., Van der Merwe, D., De Beer, H., Kempen, E., & Bosman, M. (2011). Consumers' perceptions of food packaging: an exploratory investigation in Potchefstroom, South Africa. International Journal of Consumer Studies, 35(3), 273-281.
Appendices
Appendix A – Measurement scales
[image:35.595.45.554.204.310.2]Product evaluation
Table 6. Product evaluation measurement scale product evaluation from Fenko, Otten and
Schifferstein (2010).
Table 7. Product evaluation measurement scale product evaluation from Fenko et al. (2016).
Literature Rephrased Translated
Beautiful – ugly Ugly – beautiful Ik denk dat dit een mooi product is
Agreeable – disagreeable -
-Friendly – unfriendly Unfriendly – friendly Ik denk dat dit product een vriendelijke aanblik heeft
Literature Rephrased Translated
Very good – very bad Bad – good Slecht – goed
Very unpleasant – very pleasant - -
Very unattractive – very attractive Unattractive – attractive Ik denk dat dit een mooi product is
Very rejecting – very inviting - -
Very unhealthy – very healthy - -
Very tasteless – very tasty - Ik denk dat de smaak van dit
product hetzelfde is als die van vers fruit
Very bad quality – very good quality
[image:35.595.33.553.349.647.2]Product experience
Table 8. Product experience measurement scale from Fenko, Kersten and Bialkova (2016)
[image:36.595.33.557.442.631.2]Purchase intention
Table 9.Purchase intention measurement scale purchase intention from Fenko et al. (2016).
Table 10. Purchase intention measurement scale from David, Kline and Dai (2005).
Literature Rephrased Translated
The colour of this product is very bad / very good
- -
The appearance of this product is.. I expect the appearance of this product will be..
Ik denk dat de aanblik van dit product goed is
The smell of this product is.. I expect the smell of this product will be..
Ik denk dat de geur van dit product lekker is
The taste of this product is.. I expect the taste of this product will be..
Ik denk dat de smaak van dit product lekker is
The texture of this product is.. I expect the texture of this product will be..
Ik denk dat de structuur van dit product stevig is
The aftertaste of this product is..
-Literature Rephrased Translated
I would buy this product is I happened to see it in a store
- -
I would actively seek out to this product in a store
- Ik denk dat ik op zoek zou gaan naar
dit product
I would consider buying this product - Ik denk dat ik zou overwegen dit product te kopen
I would recommend this product to others
- -
Literature Rephrased Translated
[image:36.595.29.565.675.738.2]Table 11. Purchase intention measurement scale from Schoonbrood (2016).
[image:37.595.39.554.354.504.2]Trust
Table 12. Trust measurement scale from Wulf, Odekerken-Schröder and Iacubucci (2001).
Table 13. Trust measurement scale from Hsiao, Chuan-Chuan Lin, Wang, Lu and Yu (2010).
Literature Rephrased Translated
I would purchase this product - Ik denk dat ik dit product ga kopen
It is likely that I would try this product
- Ik denk dat de kans groot is dat ik dit
product zou kopen I would consider buying this product
the next time I need.. (fruit, cereals etc.)
- Ik denk dat ik zou overwegen om dit
product te kopen
I would buy this product when it becomes available.
- -
Literature Rephrased Translated
This store gives me a feeling of trust -
-I have trust in this store I have trust in this product Ik denk dat dit product te vertrouwen is / ik denk dat dit bedrijf betrouwbaar is
This store gives me a trustworthy impression
This product gives me a trustworthy impression
Dit product geeft mij een betrouwbaar gevoel
Literature Rephrased Translated
I think this website is credible I think this product is credible Ik denk dat dit een geloofwaardig product is
I trust this website I trust this product Ik denk dat dit product te vertrouwen is
I believe that this website is trustworthy
- Ik denk dat dit een geloofwaardig
[image:37.595.32.561.558.706.2]Table 14. Trust measurement scale Chaudhuri and Holbrook (2001).
[image:38.595.43.553.346.493.2]Product familiarity
Table 15. Product familiarity measurement scale Kent and Allen (1994).
Demographics
Table 16. Demographic questions.
Literature Rephrased Translated
I trust this brand I trust this product Ik denk dat dit product te vertrouwen is
I rely on this brand I rely on this product Ik heb vertrouwen in dit product This brand is safe This product is safe Ik denk dat dit product veilig is om
te gebruiken
This is a honest brand This is a honest product Ik denk dat dit een eerlijk product is / ik denk dat dit bedrijf eerlijk is
Literature Rephrased Translated
Familiar – unfamiliar I have heard from a similar product Ik heb gehoord van een soort gelijk product
Inexperienced – experienced I have experience with a similar product
Ik heb ervaring met een soort gelijk product
Knowledgeable – not knowledgeable
I have knowledge of a similar product
Ik heb kennis van een soort gelijk product
English Dutch
Gender Man / vrouw
Age Leeftijd
Highest level of education Hoogst behaalde opleiding
Are you responsible for the groceries
Appendix B – Stimulus materials
[image:39.595.159.520.129.411.2]Homogeneous product
Figure 17. Homogeneous product; non-transparent package design.
[image:39.595.131.523.469.747.2]Figure 19. Homogeneous product; completely transparent package design.
Heterogeneous products
[image:40.595.96.519.467.748.2]Figure 21. Heterogeneous product; small window package design.
[image:41.595.137.522.450.732.2]Appendix C – Pre-study one
Questions pre-study one
Each participant saw either the homogeneous version (pictures above) or the heterogeneous version (pictures below). The same questions needed to be answered about every single picture.
Questionnaire
Bekijk de onderstaande afbeelding, er zullen een aantal vragen over gesteld worden. Hierbij gaat het om de eerste indruk van het product waarbij het merk niet van belang is.
Geef uw mening over de volgende stellingen. Klik onder het getal op de balk om het gewenste antwoord te geven of verplaats tot de schuiver onder het juiste antwoord staat.
Ik vind dit product:
Onaantrekkelijk – aantrekkelijk 1 – 7
Onaangenaam – aangenaam 1 – 7
Van slechte kwaliteit – van goede kwaliteit 1 – 7
Geef uw mening over de volgende stellingen. Ik heb vertrouwen in dit product:
Oneens – eens 1 – 7
Dit is een eerlijk product: Oneens – eens 1 – 7
Ik zou dit artikel sneller kopen als ik de inhoud van de verpakking zou kunnen zien: Oneens – eens
1 – 7
Dit product is:
Appendix D – Pre-study two
Questions pre-study two
The questions below are used in the second pre-study. The first questions are on the mixed products, the second part consist of questions about the simple version. Each participant view one level of transparency on the heterogeneous product as well as on the homogeneous product. The following questions have to be answered.
Geef aan in hoeverre u het eens bent met de volgende stellingen. Ik vind dit product er realistisch uitzien:
1 – 7
De voorkant van de verpakking is volledig transparant:
o Ja
o Nee
De voorkant van de verpakking is voor een gedeelte transparant:
o Ja
o Nee
Op de voorkant van de verpakking staat een afbeelding van fruit:
o Ja
o Nee
Geef aan of u het eens bent met de volgende stellingen. Het gewicht van dit product is 300 gram volgens de verpakking:
o Ja
o Nee
Dit product bevat groente:
o Ja
De kleur van de verpakking is rood:
o Ja
o Nee
De voorkant van de verpakking:
o is volledig transparant
o is voor een gedeelte transparant
o bevat een afbeelding
Geef aan in hoeverre u het eens bent met de volgende stellingen. Ik vind dit product er realistisch uitzien:
1 – 7
De voorkant van de verpakking is volledig transparant:
o Ja
o Nee
De voorkant van de verpakking is voor een gedeelte transparant:
o Ja
o Nee
Op de voorkant van de verpakking staat een afbeelding van fruit:
o Ja
o Nee
Geef aan of u het eens bent met de volgende stellingen. Dit is een diepvries product volgens de verpakking:
o Ja
o Nee
Dit product bevat een mix van fruit:
o Ja
De kleur van de verpakking is blauw:
o Ja
o Nee
De voorkant van de verpakking:
o is volledig transparant
o is voor een gedeelte transparant