Munich Personal RePEc Archive
Poverty, Inequality and Trade
Facilitation in Low and Middle Income
Countries
Nguyen, Cuong
15 September 2013
Online at
https://mpra.ub.uni-muenchen.de/50312/
1
Poverty, Inequality and Trade Facilitation in Low and
Middle Income Countries
Nguyen Viet Cuong1
Abstract
Although there are numerous empirical studies on the effect of trade facilitation on
international trade and GDP, there have been no studies on the association between trade
facilitation and poverty as well as inequality. This paper examines this association in low
and middle income countries using GMM-type instruments for trade facilitation. It is
found that trade facilitation which is measured by the number of documents and the time
for exports and imports is strongly correlated with poverty, inequality and per capita GDP.
Countries with more improvement in trade facilitation are more likely to have lower
poverty and inequality, and higher per capita GDP than other countries with less
improvement in trade facilitation.
Keywords: Trade facilitation, poverty, inequality, international trade, developing
countries.
JEL Classification: F13, F15, I30.
1
This study is funded by the United Nations Economic and Social Commission for Asia and the Pacific (ESCAP), the United Nations. I would like to express great thanks to participants in the workshop “Trade Facilitation for Poverty Reduction: Building Capacity for the Implementation of Pro-Poor Trade Facilitation Policies and Measures in Developing Asian Countries” on March 26, 2013 for their useful comments on this paper. I would also like to thank an anonymous reviewer of ARTNeT Working Paper for his/her helpful comments on this paper.
Nguyen Viet Cuong is a researcher from National Economics University, and Mekong Development Research Institute, Hanoi, Vietnam.
Tel: (84) 904159258; Fax: (844) 38693369 Email: nguyen.cuong@ippm.edu.vn
2
1. Introduction
International trade is a key element of global economic integration. Since the Second
World War, the world economy has experienced high economic growth and the
international trade. Together with global economic integration, the world trade volume has
been increasing remarkably. During the period 1950-2007, the world trade volume
increased by twenty-seven fold, three times as much as the world output growth (World
Trade Organization, 2007). The world trade volume accounted for one-tenth of the world
GDP in 1950, but around one-third of the world GDP in 2000 (Mussa, 2000).
One of the main reasons for increasing international trade is decreasing cost of the
international trade. Together with continuous trade liberalization, a significant tariff
reduction has been experienced in most countries throughout the world (World Trade
Organization, 2007). It is estimated that “levels of protection for domestic manufacturing
industries in industrial countries have declined by as much as 90 percent since the Second
World War” (Mussa, 2000). Technology development in transportation and
communication also contribute largely to reduction of international cost.
Recently, trade facilitation has been emerging as an important strategy in
international trade promotion. Trade facilitation has been put in the agenda of WTO since
1994, and the member governments of WTO have started negotiations on trade facilitation
since 2004 (Duval, 2007). As countries have been increasingly involved in bilateral and
multilateral trade agreements, the tariff rates tend have been decreasing. There is a
growing recognition that non-tariff regulations will be a main obstacle for international
trade. The main objective of trade facilitation is to reduce transaction costs of international
trade by simplifying customary and technical regulations (United Nations, 2002). Trade
facilitation often refers to simplifying and improving efficiency of international trade
procedures (United Nations, 2002; Wlson et al., 2003, 2005; Engman, 2005; Iwanow and
Kirkpatrick; 2007). Trade facilitation can include from improving the trade logistics at
ports to improving the environment of transaction costs such as simplification and
harmonization of procedures on international movements of goods and services (Wilson et
3 facilitation can be improved by increasing efficiency of trade-related activities including
customs, transport, and banking and insurance (services and infrastructure). Trade
facilitation is not limited to at-the-border and customs control processes. It can be
involved with governance and human resource development.
The direct impact of trade facilitation is to increase the international trade. Wilson
et al. (2005) examines the relationship between trade facilitation and international trade in
Asia-Pacific countries. They find that improving port efficiency, customs and e-business
can have a positive effect on trade flows. On the contrary, heavy regulatory environments
can harm the trade flows. In Clark et al. (2004), it shows that a reduction in inefficiencies
in transport costs can result in an increase in bilateral trades of countries to the US. Dollar
et al. (2006) finds that the number of days to clear goods through customs has a negative
effect on exports in developing countries. Iwanow and Kirkpatrick (2007) find that a 10
percent improvement in trade facilitation can increase the export volume by around 5
percent. Djankov et al. (2010) examine how the time delays of shipment of products on
international trade. They find that an additional day that a product is delayed can decrease
the international trade volume by around one percent. Recently, Dennis and Shepherd
(2011) show that trade facilitation improvement can promote export diversification in
developing countries. A 10 percent reduction in the export cost can lead to a three percent
increase in export diversification.
There are other numerous studies which find a positive relation between trade
facilitation and international trade flows (e.g. APEC, 1999; Hertel et al., 2001; Hummels,
2001; Kim et al., 2004; Walkenhorst, 2005; Clarke, 2005; Hertel and Keeney, 2006;
Francois and Manchin, 2006; Nordas et al., 2006; Sadikov, 2007; Duval and Utoktham,
2009). Engman (2005) provides an overview of 9 empirical studies on the effect of trade
facilitation on trades, and find several interesting findings. Firstly, most studies find a
positive effect of trade facilitation even very small improvement in trade facilitation.
Secondly, the effect of trade facilitation in relative value tends to be higher for developing
countries than developed countries. Thirdly, the effect on trade of improvement in port
efficiency is larger than the effect of improvement in custom procedures.
Since trade facilitation can increase international trade of a country, it can promote
4 growth constitutes a prerequisite to reduce poverty (Dollar and Kraay, 2000; Ravallion,
2004). Many studies have documents the positive effect of trade facilitation on
employment and poverty reduction (e.g., McCulloch, 2001; Harrison, 2005; Winters, et.
al., 2004; Hoekman and Winters, 2005). Hoekman and Winters (2005) find the role of
trade in employment generation tends to increase overtime. Expansion of export-oriented
sectors can create employment for low skilled workers. Several studies find a positive
correlation between trade facilitation and employment (Dennis, 2006; ESCAP, 2009;
Zaki, C., 2011)
However, the effect of trade facilitation on poverty is not always known a priori. If
the rich are mainly beneficiaries from economic growth caused by international trade, the
effect on poverty reduction of economic growth will be modest (Kakwani and Pernia,
2000; Ravallion, 2004). International trade does not necessarily lead to poverty reduction,
since it can have adverse impacts on economies and the poor in the short-run (Easterly and
Kraay, 2000). A main channel for shock transmission from the global economy to an
economy of a country is the price of output and inputs (Winters et. al., 2004). A sudden
decrease in output prices can quickly push the poor households who are in tradable sectors
into losses and poverty. Another way that trade liberalization can be harmful to the poor is
through employment and wages. A traditional Hechscher-Ohlin trade model argues that if
unskilled labor in developing countries is abundant, trade liberalization will result in an
increase in export sectors that are unskilled labor intensive, thereby increasing
employment for the unskilled labor and reducing poverty. However, if unskilled labor is
not abundant, or they are concentrated in non-traded sectors, the impact on employment of
the poor is negligible, e.g., in Latin America countries (Marquez and Pages, 1998,
Levinsohn, 1999, and Moreira and Najberg, 2000). Trade liberalization can result in
technology changes favorable for semi-skilled or skilled labors, but not unskilled labors.
International trade can change real wages, thus income and poverty can be
affected. According to the Stolpher-Samuelson theorem, if the price of labor-intensive
products increases, the production and employment will go up, and real wage increases. In
contrast, a decrease in the price will be associated with a decrease in wages. Several
empirical studies show the negative impact of trade liberalization on wage (Revenga,
5 effect of international trade boost on poverty cannot be predicted with a certainty. The
effect of international trade on inequality is also ambiguous, since international trade can
have heterogeneous effects on different people.
In this study, we aim to examine the association between trade facilitation and
poverty and inequality in low and middle income countries (the list of countries is
presented in Table A.3 in Appendix). We focus on the low and middle income countries
for two reasons. Firstly, the poverty rate is substantially higher in low and middle income
countries than in high income countries. In this study, we will measure poverty using the
poverty line of $1.25 and $2 a day (PPP). Under these poverty lines, the poverty rate in all
the high income countries is almost zero.2 Secondly, compared with developed countries,
trade transactions costs are higher, and there is a higher impact of trade facilitation on
trade flows (Engman, 2005; Layton, 2007). As a result, we can expect a large effect of
trade facilitation on poverty and inequality in the developing countries.
Although there are numerous empirical studies on the direct effect of trade
facilitation on international trade, there are few empirical studies on indirect effects of
trade facilitation on other economic outcomes. There are several studies which examine
the effect of trade facilitation on GDP and economic welfare and they find a positive
effect of trade facilitation (e.g., APEC 1999; Kinnman and Decreux and Fontagné, 2006;
Hertel and Keeney, 2006; Lodefalk, 2007). Engman (2005) reviews several studies which
investigate the effect of trade facilitation on government revenue and foreign direct
investment. These studies find a positive association between the trade facilitation level
and government revenue and foreign direct investment. To our knowledge, there have
been no studies on the relation between trade facilitation and poverty as well as inequality.
Thus, the study is expected to make an empirical contribution to the literature of
international trade as well as development economics.
The paper is structured into five sections. The second section presents the
descriptive statistics on trade facilitation, poverty and inequality of developing countries.
The third section presents the estimation method, and the fourth section reports the
empirical findings. Finally, the fifth section concludes.
2
6
2. Trade facilitation, poverty and inequality
The main data source in this study is from the World Bank database.3 Up to 2012,
there were data on 1,260 indicators of countries throughout the world. The data are
collected from different sources, provided by international agencies and governments. The
data set includes several indicators of trade facilitation, such as logistics performance
index, the number of documents, the number of days, and import and export costs for most
countries in the world. Data on poverty indexes, Gini and other country-level indicators
are also available. These yearly data form unbalanced panel data of countries during
2005-2012. The number of low- and middle-income countries that have data on trade facilitation
as well as poverty and inequality is 90. The number of observations totals 225.
For the study detailed in this chapter, based on the availability of the World Bank’s
database, four measures of trade facilitation were used:
(a) The number of documents for exports (figure 1). Such documents are required
by government ministries, customs authorities, port and container terminals,
health and technical control agencies, and banks for each shipment to be
exported;
(b) The number of documents for imports (figure 1). Such documents are required
by government ministries, customs authorities, port and container terminals,
health and technical control agencies, and banks for each imported shipment;
(c) Time taken to export (number of days) (figure 2). The time calculation for the
export procedure starts from when a shipment is initiated up until the shipment
is completed;
(d) Time taken to import (number of days) (figure 2). The time calculation for the
import procedure starts from when a shipment is initiated up until receipt of the
shipment is completed.
The first two measures are more related to custom procedures and regulations,
while the last two measures reflect efficiency of overall international trade procedures. A
more detailed definition of these trade facilitation measures is presented in annex table 1.
3
7
Figure 1. Number of documents required for exports and imports
Source: Author’s calculation based on the World Bank database.
According to the United Nations (2002), customs procedures and documentation
can be obstacles to international trade. It is estimated that high administrative costs caused
by customs procedures and requirements can account for between 7 per cent and 10 per
cent of the value of global trade. Figure 1 shows the average number of documents for
exporting and importing a good in low- and middle-income countries during 2005-2012.
As expected, exporting requires fewer documents than importing. The number of
documents required for both exporting and for importing decreased during that period. In
2005, the average number of documents for exporting and importing was approximately
7.55 and 9.05, respectively. These figures decreased to 7.11 and 8.06, respectively, in
2012.
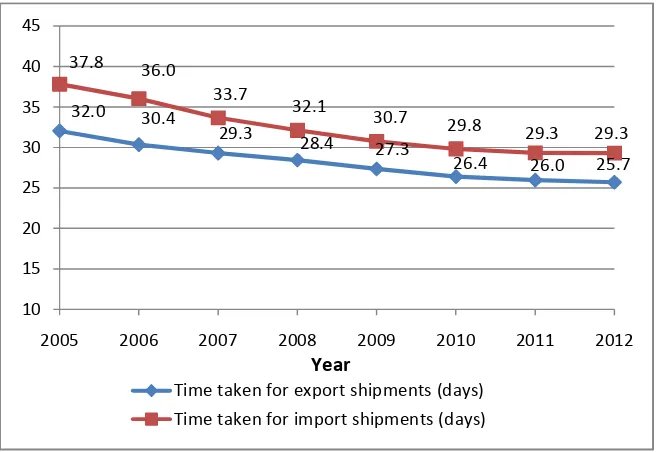
Figure 2 shows the average time needed to export as well as to import a good in
the low- and middle-income countries (expressed in the number of days). The average
time decreased during 2005-2012. The time required to import a good was lower than the
time to export a good. In 2012, the number of days was 25.7 for exports and 29.3 for
imports, respectively.
7.55 7.53
7.36 7.25 7.19
7.15 7.14 7.11 9.05
8.70
8.32 8.20
8.13 8.07 8.06 8.06
5 6 7 8 9 10
2005 2006 2007 2008 2009 2010 2011 2012
N
o
.
o
f
d
o
c
u
m
e
n
t
s
Year
8
Figure 2. Time to export and import (days)
Source: Author’s calculation from the World Bank database.
Table 1 presents the four trade facilitation measures by income level and
geographical region of countries. Trade facilitation has improved more in higher income
countries. Countries in the Latin American and Caribbean, European, and East Asia and
the Pacific regions require a smaller number of documents and a fewer days for
international trade than countries in other regions. Compared with other countries, Central
Asian, sub-Sahara African and South Asian countries require a higher number of
[image:9.595.128.470.614.740.2]documents and longer times for exports and imports.
Table 1. Trade facilitation by income levels and regions
Documents for exports (number)
Documents for imports (number)
Time to export (days)
Time to import
(days) Income group
Low income 8.23 9.91 40.24 46.78
Lower middle income 7.42 8.18 27.47 31.42
Upper middle income 6.51 7.41 20.81 23.61
Region
East Asia and the Pacific 6.75 7.64 24.31 26.21
Central Asia 11.16 13.03 75.13 77.41
32.0 30.4
29.3
28.4 27.3
26.4 26.0 25.7 37.8 36.0
33.7
32.1
30.7 29.8
29.3 29.3
10 15 20 25 30 35 40 45
2005 2006 2007 2008 2009 2010 2011 2012
Year
9
Documents for exports (number) Documents for imports (number) Time to export (days) Time to import (days)
Europe 6.69 7.75 19.67 22.06
Latin America and
Caribbean 6.43 7.24 19.69 22.52
Middle East and North
Africa 6.79 8.19 26.18 31.36
South Asia 8.34 9.47 33.05 34.73
Sub-Sahara Africa 7.88 8.94 33.96 41.00
Average 7.28 8.32 28.18 32.34
Source: Author’s calculation based on the World Bank database.
The World Bank database contains data on logistics performance indexes, which
are computed from Logistics Performance Index surveys conducted by the World Bank.
Table 2 presents the seven logistics performance indexes for seven areas as well as the
overall weighted index that is computed from the seven indexes. The logistics
performance indexes express a very similar pattern for the number of documents and time
for trade and tend to improve overtime. Table 2 shows that trade facilitation measured by
the logistics performance indexes has improved more in higher-income countries than in
lower-income countries. Countries in Latin America and the Caribbean, and East Asia and
the Pacific have lower logistics performance indexes, while sub-Sahara African and South
[image:10.595.129.467.106.225.2]Asian countries have higher logistics performance indexes.
Table 2. Logistics performance index
Logistics performance index
Efficiency of customs clearance process (1= low, 5=high) Quality of trade and transport-related infrastructure (1=low , 5=high) Ease of arranging competitively priced shipments (1=low, 5=high) Competence and quality of logistics services (1=low, 5=high) Ability to track and trace consignments (1=low, 5=high) Frequency with which shipments reach consignee on schedule (1=low, 5=high) Overall (1=low, 5=high) Year
2007 2.27 2.23 2.46 2.40 2.41 2.87 2.44
2010 2.29 2.28 2.67 2.47 2.63 3.18 2.60
2012 2.38 2.46 2.62 2.55 2.60 3.02 2.61
Income group
Low income 2.15 2.06 2.39 2.25 2.30 2.76 2.32
Lower middle
income 2.25 2.25 2.53 2.44 2.50 3.02 2.50
Upper middle
income 2.49 2.58 2.78 2.67 2.78 3.22 2.76
Region
East Asia and
Pacific 2.44 2.47 2.73 2.59 2.71 3.20 2.69
Central Asia 2.21 2.22 2.45 2.32 2.42 2.91 2.36
Europe 2.40 2.47 2.77 2.60 2.69 3.17 2.71
[image:10.595.86.521.477.746.2]10
Logistics performance index
Efficiency of customs clearance
process (1= low, 5=high)
Quality of trade and transport-related infrastructure
(1=low , 5=high)
Ease of arranging competitively
priced shipments
(1=low, 5=high)
Competence and quality of logistics
services (1=low, 5=high)
Ability to track and trace consignments
(1=low, 5=high)
Frequency with which shipments
reach consignee on
schedule (1=low, 5=high)
Overall (1=low, 5=high)
and Caribbean Middle East and
North Africa 2.27 2.33 2.59 2.44 2.45 3.01 2.52
South Asia 2.25 2.19 2.49 2.41 2.45 2.91 2.46
Sub-Sahara
Africa 2.22 2.15 2.45 2.35 2.40 2.85 2.41
Average 2.31 2.32 2.58 2.47 2.55 3.02 2.55
Source: Author’s calculation based on the World Bank database.
It should be noted that in the current study the logistics performance indexes were
not used as a trade facilitation measurement in the main analysis of trade facilitation and
poverty because of several observations. Data on both poverty measures and the logistics
performance indexes are available for only 52 countries. However, the number of
documents and days needed for exports and imports can be relevant measures of trade
facilitation. Table 3 shows a strongly negative correlation between the logistics
performance indexes and the number of documents and days needed for exports and
11
Table 3. Correlation between trade facilitation measures Documents
for exporting (number)
Documents for importing (number)
Time taken to
export (days)
Time taken to
import (days)
Efficiency of customs clearance
process
Quality of trade and transport-related infrastructure
Ease of arranging competitively
priced shipment
Compete and quality of
logistics services
Ability to track and trace consignments
Frequency shipments reach consignee
within schedule
Overall index
Documents for exporting (number)
1.00
Documents for importing (number)
0.57 1.00
Time taken to export (days)
0.57 0.94 1.00
Time taken to import (days)
0.72 0.59 0.62 1.00
Efficiency of customs clearance process
-0.38 -0.40 -0.39 -0.37 1.00
Quality of trade and transport-related infrastructure
-0.36 -0.45 -0.43 -0.36 0.83 1.00
Ease of arranging competitively priced shipments
-0.34 -0.38 -0.38 -0.31 0.69 0.72 1.00
Competence and quality of logistics services
-0.29 -0.40 -0.38 -0.31 0.83 0.85 0.75 1.00
Ability to track and trace consignments
-0.36 -0.41 -0.40 -0.33 0.76 0.77 0.74 0.83 1.00
Frequency shipments reach consignee within schedule
-0.31 -0.36 -0.35 -0.28 0.67 0.66 0.67 0.73 0.76 1.00
Overall index -0.38 -0.45 -0.44 -0.36 0.88 0.90 0.87 0.93 0.91 0.85 1.00
Source: Author’s calculation based on the World Bank database.
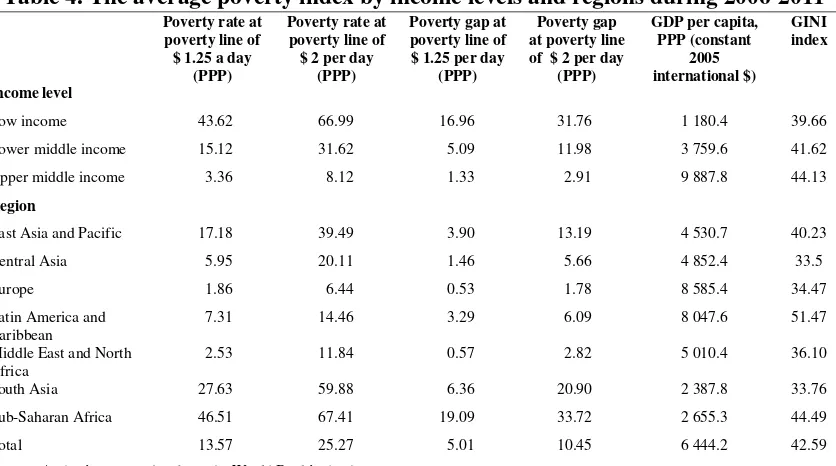
12 Poverty indexes, per capita GDP and the Gini index are presented in table 4.
Poverty is measured by the poverty rate and poverty gap index (both in per cent).4 There
are no data on the poverty severity index. As expected, there is a strongly negative
correlation between poverty and per capita GDP. The poverty rate and poverty gap index
are higher in sub-Sahara African and South Asian countries, which have low per capita
GDP. However, inequality measured by the Gini index is higher in high-income countries
[image:13.595.91.509.260.493.2]than in low-income countries.
Table 4. The average poverty index by income levels and regions during 2006-2011 Poverty rate at
poverty line of $ 1.25 a day
(PPP)
Poverty rate at poverty line of $ 2 per day
(PPP)
Poverty gap at poverty line of $ 1.25 per day
(PPP)
Poverty gap at poverty line of $ 2 per day
(PPP)
GDP per capita, PPP (constant
2005 international $)
GINI index
Income level
Low income 43.62 66.99 16.96 31.76 1 180.4 39.66 Lower middle income 15.12 31.62 5.09 11.98 3 759.6 41.62 Upper middle income 3.36 8.12 1.33 2.91 9 887.8 44.13
Region
East Asia and Pacific 17.18 39.49 3.90 13.19 4 530.7 40.23
Central Asia 5.95 20.11 1.46 5.66 4 852.4 33.5
Europe 1.86 6.44 0.53 1.78 8 585.4 34.47
Latin America and Caribbean
7.31 14.46 3.29 6.09 8 047.6 51.47
Middle East and North Africa
2.53 11.84 0.57 2.82 5 010.4 36.10
South Asia 27.63 59.88 6.36 20.90 2 387.8 33.76
Sub-Saharan Africa 46.51 67.41 19.09 33.72 2 655.3 44.49
Total 13.57 25.27 5.01 10.45 6 444.2 42.59
Source: Author’s preparation from the World Bank’s database.
Note: The number of observations is 224.
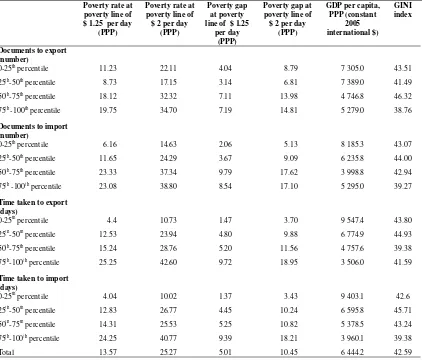
Table 5 presents the average poverty measures, per capita GDP and Gini index by
different percentiles of trade facilitation measures. It is obvious that countries with greater
improvement in trade facilitation are more likely to have lower poverty and higher per
4
The poverty measures are expressed as (Foster and others, 1984):
∑
∑
−= α
α) ( 1 ) (1 ( / ))
( w x z
w
FGT i i
i
13 capita GDP. The relationship between the Gini index and the level of trade facilitation are
[image:14.595.88.510.178.538.2]less clear.
Table 5. Average poverty index by percentile of trade facilitation measures, 2006-2011
Poverty rate at poverty line of $ 1.25 per day
(PPP)
Poverty rate at poverty line of $ 2 per day
(PPP)
Poverty gap at poverty line of $ 1.25
per day (PPP)
Poverty gap at poverty line of $ 2 per day
(PPP)
GDP per capita, PPP (constant
2005 international $)
GINI index
Documents to export (number)
0-25th percentile 11.23 22.11 4.04 8.79 7 305.0 43.51
25th-50th percentile 8.73 17.15 3.14 6.81 7 389.0 41.49
50th-75th percentile 18.12 32.32 7.11 13.98 4 746.8 46.32
75th -100th percentile 19.75 34.70 7.19 14.81 5 279.0 38.76 Documents to import
(number)
0-25th percentile 6.16 14.63 2.06 5.13 8 185.3 43.07
25th-50th percentile 11.65 24.29 3.67 9.09 6 235.8 44.00
50th-75th percentile 23.33 37.34 9.79 17.62 3 998.8 42.94
75th -100th percentile 23.08 38.80 8.54 17.10 5 295.0 39.27 Time taken to export
(days)
0-25th percentile 4.4 10.73 1.47 3.70 9 547.4 43.80
25th-50th percentile 12.53 23.94 4.80 9.88 6 774.9 44.93
50th-75th percentile 15.24 28.76 5.20 11.56 4 757.6 39.38
75th-100th percentile 25.25 42.60 9.72 18.95 3 506.0 41.59 Time taken to import
(days)
0-25th percentile 4.04 10.02 1.37 3.43 9 403.1 42.6
25th-50th percentile 12.83 26.77 4.45 10.24 6 595.8 45.71
50th-75th percentile 14.31 25.53 5.25 10.82 5 378.5 43.24
75th-100th percentile 24.25 40.77 9.39 18.21 3 960.1 39.38
Total 13.57 25.27 5.01 10.45 6 444.2 42.59
Source: Author’s calculation based on the World Bank database.
Note: The number of observations is 224.
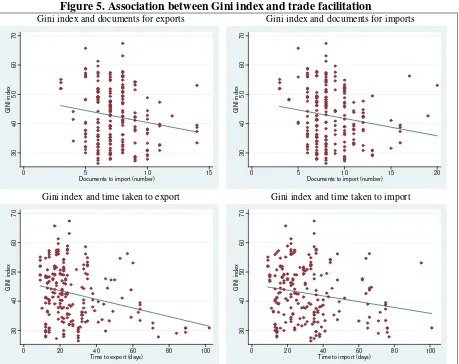
Figures 3, 4 and 5 show the level of poverty rate, per capita GDP and the Gini
index in relation to the trade facilitation variables. The lines in the figures are the linear
regressions of the variable in the vertical axis on the variable in the horizontal axis. The
slope of the regression line is statistically significant at the 1 per cent level. Countries with
a larger number of documents and days needed for exporting and importing tend to have a
higher poverty rate, lower per capita GDP and a slightly lower inequality level.5
5
14
Figure 3. Association between the poverty rate (measured at the poverty line of $ 1.25 PPP per day and trade facilitation
Poverty rate and documents for exports Poverty rate and documents for imports
Poverty rate and time taken to export Poverty rate and time taken to import
Source: Author’s calculation based on the World Bank database.
Note: The number of observations is 224.
0 2 0 4 0 6 0 8 0 P o v e rt y r a te a t $ 1 .2 5 a d a y (P P P ) (% )
0 5 10 15
Documents to import (number)
0 2 0 4 0 6 0 8 0 P o v e rt y r a te a t $ 1 .2 5 a d a y (P P P ) (% )
0 5 10 15 20
Documents to import (number)
0 2 0 4 0 6 0 8 0 P o v e rt y r a te a t $ 1 .2 5 a d a y (P P P ) (% )
0 20 40 60 80 100
Time to export (days)
0 2 0 4 0 6 0 8 0 P o v e rt y r a te a t $ 1 .2 5 a d a y (P P P ) (% )
0 20 40 60 80 100
15
Figure 4. Association between GDP per capita (PPP) and trade facilitation
GDP and documents for exports GDP and documents for imports
GDP and time taken to export GDP and time taken to import
Source: Author’s calculation based on the World Bank database.
Note: The number of observations is 900.
0 5 0 0 0 1 0 0 0 0 1 5 0 0 0 2 0 0 0 0 2 5 0 0 0 G D P p e r c a p it a ( P P P ) (c o n s ta n t 2 0 0 5 in te rn a tio n a l $ )
0 5 10 15
Documents to export (number)
-1 0 0 0 0 0 1 0 0 0 0 2 0 0 0 0 3 0 0 0 0 G D P p e r c a p it a ( P P P ) (c o n s ta n t 2 0 0 5 in te rn a tio n a l $ )
0 5 10 15 20
Documents to import (number)
-1 0 0 0 0 0 1 0 0 0 0 2 0 0 0 0 3 0 0 0 0 G D P p e r c a p it a ( P P P ) (c o n s ta n t 2 0 0 5 in te rn a tio n a l $ )
0 20 40 60 80 100
Time to export (days)
0 5 0 0 0 1 0 0 0 0 1 5 0 0 0 2 0 0 0 0 2 5 0 0 0 G D P p e r c a p it a ( P P P ) (c o n s ta n t 2 0 0 5 in te rn a tio n a l $ )
0 20 40 60 80 100
16
Figure 5. Association between Gini index and trade facilitation
Gini index and documents for exports Gini index and documents for imports
Gini index and time taken to export Gini index and time taken to import
Source: Author’s calculation based on the World Bank database.
Note: The number of observations is 224.
3. Regression analysis
The study used econometric models to measure the effect of trade facilitation on
poverty, GDP and inequality. More specifically, regressions were run of poverty indexes,
per capita GDP and the Gini index on trade facilitation indicators and other explanatory
variables, using panel data of low- and middle-income countries.6 More specifically, the
following function of poverty as well as inequality was used:
it i it it
it TF X v u
y =α+ β + θ+ + , (1)
where yit is the poverty index (also log of per capita GDP, log of export volume and the
Gini index) of country i in year t, and TFit are trade facilitation variables of country i in
6
Since the effect of trade facilitation on international trade is not estimated, a gravity model is not used.
3 0 4 0 5 0 6 0 7 0 G IN I in d e x
0 5 10 15
Documents to import (number)
3 0 4 0 5 0 6 0 7 0 G IN I in d e x
0 5 10 15 20
Documents to import (number)
3 0 4 0 5 0 6 0 7 0 G IN I in d e x
0 20 40 60 80 100
Time to export (days)
3 0 4 0 5 0 6 0 7 0 G IN I in d e x
0 20 40 60 80 100
17 year t. As mentioned, indicators of trade facilitation are the number of documents required
for exporting and importing a good, and the number of days taken to export and import.
it
X is a vector of explanatory (control) variables that include dummy variables of years,
population density and geographical regional dummies. A small set of control variables
that are strictly exogenous was used. The control variables should not be affected by trade
facilitation (Heckman and others, 1999; Angrist and Pischke, 2008). As trade facilitation
affects trade and GDP, it can also affect a large number of economic outcomes of the
countries. In addition, the difference data were used and time-invariant control variables
removed from the estimation. Thus, the number of control variables is small in the
regressions. The error term is decomposed into time-invariant component vi and
time-variant component uit. The effect of trade facilitation is measured by β .
Estimation of the effect of a programme or a policy is always challenging. Without
randomization, the effect of a policy can be correlated with unobserved factors. The trade
facilitation variables can be correlated with error terms in equation (1). We use panel data
to eliminate the time-invariant component vi by the first-differencing of equation (1):
it it
it
it TF X u
y =∆ +∆ +∆
∆ β θ (2)
However, it is possible that ∆TFit can still be correlated with∆uit. Finding
absolutely exogenous instrumental variables for trade facilitation variables is difficult.
Thus, for estimates ofβ , a widely-used Generalized Method of Moments (GMM)
developed by Holtz-Eakin and others (1988), and Arellano and Bond (1991) can be relied
upon. The GMM-type instruments for ∆TFit are higher order lags of the trade facilitation
variables. Although the exogeneity of these instruments is always questionable, the
over-identification test for the validation of the instruments can be performed.
4. Empirical results
Tables 6 to 9 present the GMM regression of the poverty rate and poverty gap
index (measured at the poverty line of $ 1.25 and $ 2 PPP/day), per capita GDP and the
Gini index on the trade facilitation variables and other explanatory variables. The results
18 Several points should be noted. First, the instruments are the first lagged difference
of trade variables and other explanatory variables. Since the number of observations is not
large, the second-order lagged differences cannot be used as instruments. The Sargan test
of over-identifying restrictions is performed and reported in the tables 6 to 9. The null
hypothesis that over-identifying restrictions are valid is not rejected in all the regressions.
Second, the Arellano-Bond test for zero autocorrelation of the first-order and
second-order in first-differenced errors was performed. The P-value of the test in all the
regressions was above 0.1, indicating that the null hypothesis of no autocorrelation was
not rejected.
Third, in each regression only one variable of trade facilitation was used in order to
avoid the multi-collinearity problem. As indicated in table 3, the trade facilitation
variables are strongly correlated. Thus, for each outcome, there are four models with
different measures of trade facilitation.
As mentioned above, there are only 52 observations for which data are available
both on poverty measures and the logistics performance indexes of trade facilitation.
There are no panel data on the logistics performance indexes of trade facilitation.
However, the OLS regression of outcomes was also tried on the logistics performance
indexes. The results were very similar to the OLS results using the time and documents for
imports and exports as the trade facilitation measures.7
Table 6 shows the association between the trade facilitation variables and the
poverty rate at the poverty line of $ 1.25 PPP per day. Except for the variable “documents
for exports”, all the trade facilitation variables are statistically significant at the 5 per cent
level. Countries requiring a large number of documents for imports and more time for
imports and exports are more likely to have a higher poverty rate. One additional
document for imports can be associated with a 0.77 percentage point increase in the
poverty rate. One additional day in the time needed for exports and imports might increase
the poverty rate by 0.49 and 0.47 percentage points, respectively. The sign of trade
facilitation variables in GMM regressions is the same as in the OLS regression.
7
19 Improvement in trade facilitation by reducing the number of documents and times for
exports and imports is also negatively associated with the poverty gap.
Although the over-identification test is not rejected, the exogeneity of the
GMM-type instruments cannot be fully convincing. Thus, the estimate of trade facilitation
variables in the GMM regression could be explained as an association between trade
[image:20.595.90.520.245.563.2]facilitation and outcomes instead of a causal effect of trade facilitation.
Table 6. GMM regression of poverty rate at poverty line of $ 1.25 per day (PPP)
Explanatory variables
Poverty rate (%) Poverty gap index (%)
Model 1 Model 2 Model 3 Model 4 Model 1 Model 2 Model 3 Model 4
Documents for exporting (number)
0.357 0.107
(0.483) (0.220) Documents for
importing (number)
0.773*** 0.297** (0.272) (0.122) Time taken to
export (days)
0.494*** 0.162*** (0.108) (0.044) Time taken to
import (days)
0.474*** 0.163*** (0.128) (0.052) Population density
(people/km2
)
-0.367** -0.247 0.276 0.493 -0.174** -0.121 0.042 0.126 (0.173) (0.196) (0.266) (0.349) (0.079) (0.088) (0.108) (0.142) 2005 Base
omitted
2006 -0.995* -0.670 -0.254 -0.404 -0.549** -0.425 -0.309 -0.349 (0.526) (0.580) (0.729) (0.837) (0.240) (0.260) (0.295) (0.341) 2007 -1.701*** -1.186* -0.362 -0.184 -0.826*** -0.635** -0.387 -0.307
(0.559) (0.630) (0.816) (0.977) (0.255) (0.282) (0.331) (0.398) 2008 -1.838*** -1.261* 0.260 0.646 -0.649** -0.441 0.031 0.197
(0.566) (0.644) (0.904) (1.130) (0.258) (0.289) (0.366) (0.460) 2009 -1.314** -0.670 0.496 0.839 -0.421 -0.181 0.162 0.309
(0.669) (0.739) (0.974) (1.196) (0.305) (0.331) (0.394) (0.487) Constant 46.884*** 31.070 -25.994 -48.479 21.187*** 14.247 -3.204 -12.072
(16.998) (19.498) (26.958) (36.063) (7.744) (8.743) (10.920) (14.680) Observations 224 224 224 224 224 224 224 224 Sargan test of
over-identifying restrictions: χ2
statistic and P-value
8.129 0.975
3.957 0.861
2.427 0.999
4.177 0.997
6.403 0.602
12.36 0.498
1.858 0.999
3.208 0.999
Source: Estimation based on the World Bank database.
Heteroskedasticity-robust standard errors are shown in parentheses. *** p<0.01, ** p<0.05, * p<0.1.
Table 7 presents the regressions of the poverty rate at the poverty line of $ 2 (PPP)
per day. All the trade facilitation variables are statistically significant and have the same
sign as the regression in Table 6. The point estimates in Table 7 are larger than in Table 6,
since the poverty rate measured at the poverty line of $ 2 (PPP) a day is higher than at the
20
Table 7.GMM regression of poverty at poverty line of $ 2 per day (PPP)
Explanatory variables
Poverty rate (%) Poverty gap index (%)
Model 1 Model 2 Model 3 Model 4 Model 1 Model 2 Model 3 Model 4
Documents for exporting (number)
1.342** 0.370
(0.669) (0.332) Documents for
importing (number)
1.154*** 0.553*** (0.374) (0.188) Time taken to
export (days)
0.696*** 0.332*** (0.150) (0.074) Time taken to
import (days)
0.748*** 0.336*** (0.189) (0.090) Population density
(people/km2)
-0.437* -0.257 0.473 0.896* -0.262** -0.173 0.174 0.346 (0.240) (0.270) (0.371) (0.515) (0.119) (0.135) (0.182) (0.247) 2005 Base
omitted
2006 -1.170 -0.734 -0.119 -0.220 -0.747** -0.523 -0.248 -0.326 (0.729) (0.798) (1.015) (1.237) (0.362) (0.401) (0.498) (0.593) Year 2007 -2.368*** -1.651* -0.516 0.026 -1.285*** -0.928** -0.389 -0.209
(0.774) (0.865) (1.137) (1.444) (0.384) (0.435) (0.558) (0.692)
2008 -3.403*** -2.633*** -0.540 0.462 -1.392*** -1.001** -0.001 0.356 (0.784) (0.886) (1.260) (1.670) (0.389) (0.445) (0.618) (0.800) 2009 -2.340** -1.739* -0.236 0.721 -0.952** -0.554 0.185 0.514
(0.926) (1.015) (1.356) (1.767) (0.460) (0.510) (0.665) (0.847) Constant 58.772** 41.025 -38.146 -83.826 33.501*** 22.653* -14.898 -33.154 (23.537) (26.796) (37.540) (53.305) (11.683) (13.460) (18.424) (25.548) Observations 224 224 224 224 224 224 224 224 Sargan test of
over-identifying restrictions: χ2
statistic and P-value
1.358 0.999
2.747 0.949
8.284 0.874
2.612 0.999
5.693 0.681
2.450 0.964
2.175 0.9999
1.897 1.000
Source: Estimation based on the World Bank database. Heteroskedasticity-robust standard errors in parentheses. *** p<0.01, ** p<0.05, * p<0.1.
Table 8 shows a negative relation between per capita GDP and the number of
documents and days needed for exports and imports. The OLS regression shown in the
annex also shows a negative association. An additional document for exports and imports
is associated with a reduction in per capita GDP by the equivalent to 2.9 per cent and 1.5
per cent of per capita GDP, respectively. It should be noted that the average number of
documents required for exporting and importing a commodity is 7.3 and 8.3, respectively.
It means that the elasticity of the per capita GDP with regard to the number of documents
required for exporting and importing is around 0.21 per cent and 0.22 per cent,
respectively. Similarly, the increase in the time taken to export and to import is negatively
correlated with per capita GDP.
To examine whether the export is the channel through which the trade facilitation
21 facilitation variables are negative and very significant. Improvement in trade facilitation
would help countries significantly increase exportation. The point estimates are larger than
[image:22.595.86.522.208.520.2]those in the regression of GDP on trade facilitation.
Table 8. GMM regression of log of GDP per capita and export volume, PPP (Constant 2005 international $)
Explanatory variables
Log of GDP per capita Log of export volume
Model 1 Model 2 Model 3 Model 4 Model 1 Model 2 Model 3 Model 4
Documents for exporting (number)
-0.029*** -0.051*** (0.009) (0.012) Documents for
importing (number)
-0.015*** -0.034*** (0.005) (0.008) Time taken to
export (days)
-0.009*** -0.022*** (0.002) (0.005) Time taken to
import (days)
-0.011*** -0.018*** (0.002) (0.004) Population density
(people/km2
)
0.018*** 0.015*** 0.006 -0.002 0.013*** 0.009* -0.013 -0.017* (0.003) (0.003) (0.004) (0.006) (0.004) (0.005) (0.008) (0.010) 2005 Base
omitted
2006 0.017* 0.012 0.004 0.005 0.023* 0.019 0.018 0.023 (0.009) (0.010) (0.012) (0.015) (0.014) (0.014) (0.020) (0.022) 2007 0.069*** 0.062*** 0.046*** 0.036** 0.083*** 0.073*** 0.052** 0.045* (0.010) (0.011) (0.014) (0.018) (0.015) (0.016) (0.022) (0.026) 2008 0.103*** 0.095*** 0.066*** 0.049** 0.114*** 0.103*** 0.046* 0.037 (0.010) (0.011) (0.015) (0.021) (0.015) (0.016) (0.027) (0.032) 2009 0.047*** 0.044*** 0.020 0.005 -0.012 -0.015 -0.060** -0.068**
(0.012) (0.013) (0.016) (0.022) (0.017) (0.018) (0.028) (0.033) Constant 7.058*** 7.210*** 8.173*** 8.943*** 22.203*** 22.479*** 24.799*** 25.158***
(0.287) (0.315) (0.428) (0.630) (0.412) (0.464) (0.841) (1.019) Observations 222 222 222 222 198 198 198 198 Sargan test of
over-identifying restrictions: χ2
statistic and P-value
6.370 0.605
2.771 0.947
8.394 0.495
4.587 0.917
8.185 0.415
16.39 0.228
12.01 0.605
5.546 0.986
Source: Estimation based on the World Bank database. Heteroskedasticity-robust standard errors in parentheses. *** p<0.01, ** p<0.05, * p<0.1.
An increase in the number of documents and time required for exports and imports
is associated with a small decrease in per capita GDP but a relatively large increase in
inequality. It means that income distribution can be worsened by increasing the number of
documents and time required for exports and imports. Table 11 shows this relationship. If
the number of documents needed for imports increases by one, the Gini index can increase
by 0.4 percentage points. An additional day in the time taken to export and import is
22
Table 9. GMM regression of Gini index
Explanatory variables Model 1 Model 2 Model 3 Model 4
Documents for exporting(number) 0.444 (0.320)
Documents for importing (number) 0.400** (0.179)
Time taken to export (days) 0.217*** (0.059)
Time taken to import (days) 0.245*** (0.071) Sum of documents for exporting and
importing
Sum of time taken to export and import
Population density (people per km2
of land area)
-0.174 -0.107 0.128 0.333 (0.127) (0.138) (0.154) (0.209)
2005 Base
omitted
2006 0.288 0.456 0.621 0.598 (0.362) (0.386) (0.405) (0.474) 2007 0.022 0.259 0.596 0.826
(0.386) (0.421) (0.455) (0.558) 2008 -0.571 -0.320 0.358 0.748
(0.391) (0.431) (0.507) (0.649) 2009 -0.764* -0.553 -0.038 0.279
(0.462) (0.496) (0.548) (0.688) Constant 55.683*** 49.077*** 24.544 3.517
(12.211) (13.392) (15.204) (21.008)
Observations 217 217 217 217 Sargan test of over-identifying
restrictions: χ2 statistic and P-value
11.47 0.648
6.868 0.961
12.35 0.499
8.708 0.892
Source: Estimation based on the World Bank’s database. Heteroskedasticity-robust standard errors in parentheses. *** p<0.01, ** p<0.05, * p<0.1.
5. Conclusion
Since trade facilitation can help to boost economic growth, it can also help poverty
and inequality reduction. This chapter attempts to examine the effect of trade facilitation
on poverty, GDP, exports and income inequality in low- and middle-income countries.
Trade facilitation is measured by the number of documents and the number of days needed
for exports and imports. The findings show that improvement in trade facilitation is
positively correlated with exports and per capita GDP, and negatively correlated with
poverty and inequality. More specifically, deterioration in trade facilitation – which is
measured by the increase in the number of documents required and days taken for
exporting and importing a good – can reduce per capita GDP, albeit to a small amount.
23 tend to have higher levels of poverty (measured by the headcount and poverty gap index)
and inequality (measured by the Gini index) than other countries.
It should be noted that although this study is aimed at estimating the causal effect
of trade facilitation on GDP and poverty in developing countries, using instrumental
variable regressions, caution is advised in the interpretation of the causal effect as the
exogeneity of GMM-type instruments is not fully convincing. Another limitation is the
small number of observations used in this study, which does not allow for estimation of
the heterogeneous effects of trade facilitation. The extent to which trade facilitation affects
GDP, poverty and inequality in a country depends on the structure of the economy;
therefore, it can vary across different countries. While estimating the heterogeneous
effects of trade facilitation is beyond the scope of this study, it is an important aspect for
24
Annex
Annex table 1. Definition of trade facilitation measures
Trade facilitation measure
Detailed definition
Documents required for exporting (number)
All documents required per shipment to export goods are recorded. It is assumed that the contract has already been agreed upon and signed by both parties. Documents required for clearance by government ministries, customs authorities, port and container terminal authorities, health and technical control agencies and banks are taken into account. Since payment is by letter of credit, all documents required by banks for the issuance or securing of a letter of credit are also taken into account. Documents that are renewed annually and that do not require renewal per shipment (for example, an annual tax clearance certificate) are not included.
Time taken to export (days)
Time is recorded in calendar days. The time calculation for a procedure starts from the moment it is initiated and runs until it is completed. If a procedure can be accelerated for an additional cost, the fastest legal procedure is chosen. It is assumed that neither the exporter nor the importer wastes time and that each commits to completing each remaining procedure without delay. Procedures that can be completed in parallel are measured as simultaneous. The waiting time between procedures – for example, during unloading of the cargo – is included in the measure.
Documents required for importing (number)
All documents required per shipment to import goods are recorded. It is assumed that the contract has already been agreed upon and signed by both parties. Documents required for clearance by government ministries, customs authorities, port and container terminal authorities, health and technical control agencies, and banks are taken into account. Since payment is by letter of credit, all documents required by banks for the issuance or securing of a letter of credit are also taken into account. Documents that are renewed annually and that do not require renewal per shipment (for example, an annual tax clearance certificate) are not included.
Time taken to import (days)
Time is recorded in calendar days. The time calculation for a procedure starts from the moment it is initiated and runs until it is completed. If a procedure can be accelerated for an additional cost, the fastest legal procedure is chosen. It is assumed that neither the exporter nor the importer wastes time and that each commits to completing each remaining procedure without delay. Procedures that can be completed in parallel are measured as simultaneous. The waiting time between procedures – for example, during unloading of the cargo – is included in the measure.
Logistics
performance index: Efficiency of customs clearance process (1=low to 5=high)
Logistics professionals’ perception of the efficiency of country’s customs clearance processes (i.e., speed, simplicity and predictability of formalities), on a rating ranging from 1 (very low) to 5 (very high). Scores are averaged across all respondents.
Logistics
performance index: Quality of trade and transport-related infrastructure (1=low to 5=high)
Logistics professionals’ perception of country’s quality of trade and transport related infrastructure (e.g., ports, railroads, roads and information technology), on a rating ranging from 1 (very low) to 5 (very high). Scores are averaged across all respondents.
Logistics
performance index:
25
Trade facilitation measure
Detailed definition
Ease of arranging competitively priced shipments (1=low to 5=high)
Scores are averaged across all respondents.
Logistics
performance index: Competence and quality of logistics services (1=low to 5=high)
Logistics professionals’ perception of country’s overall level of competence and quality of logistics services (e.g., transport operators, customs brokers), on a rating ranging from 1 (very low) to 5 (very high). Scores are averaged across all
respondents.
Logistics
performance index: Overall (1=low to 5=high)
Logistics Performance Index overall score reflects perceptions of a country's logistics based on efficiency of customs clearance process, quality of trade- and transport-related infrastructure, ease of arranging competitively priced shipments, quality of logistics services, ability to track and trace consignments, and frequency with which shipments reach the consignee within the scheduled time. The index ranges from 1 to 5, with a higher score representing better performance.
Logistics
performance index: Frequency with which shipments reach consignee within scheduled or expected time (1=low to 5=high)
Logistics professionals’ perception of how often the shipments to assessed country reach the consignee within the scheduled or expected delivery time, on a rating ranging from 1 (hardly ever) to 5 (nearly always). Scores are averaged across all respondents.
Logistics
performance index: Ability to track and trace consignments (1=low to 5=high)
Logistics professionals’ perception of the ability to track and trace consignments when shipping to the country, on a rating ranging from 1 (very low) to 5 (very high). Scores are averaged across all respondents.
26
Annex table 2. Summary statistics of variables
Variables Obs. Mean Std. Dev. Min. Max.
Documents required for exporting (number) 225 7.209 1.972 3 14 Documents required for importing(number) 225 8.471 2.644 3 20 Time taken to export (days) 225 26.236 15.972 9 102 Time taken to import (days) 225 30.831 17.543 9 101 Population density (people per km2 of land area) 224 95.54 135.00 3.20 1 142.29 East Asia and the Pacific 225 0.098 0.298 0 1 Europe and Central Asia 225 0.302 0.460 0 1 Latin America and Caribbean 225 0.347 0.477 0 1 Middle East and North Africa 225 0.053 0.225 0 1 South Asia 225 0.044 0.207 0 1 Sub-Saharan Africa 225 0.156 0.363 0 1 Poverty rate at poverty line of $ 1.25 a day (PPP) 225 13.571 18.948 0 87.72 Poverty rate at poverty line of $ 2 a day (PPP) 225 25.265 26.490 0.05 95.15 Poverty gap at poverty line of $ 1.25 a day (PPP) 225 5.009 8.447 0 52.76 Poverty gap at poverty line of $ 2 a day (PPP) 225 10.454 13.558 0.01 67.58 GDP per capita, PPP (constant 2005 international $) 223 6 444.17 4 153.85 284.20 2 1026.04 GINI index 218 42.593 9.277 26.44 67.4
27
Annex table 3. List of low- and middle-income countries
Afghanistan Egypt Mauritania Syrian Arab Republic
Albania El Salvador Mauritius São Tomé and Principe
Algeria Eritrea Mexico Tajikistan
American Samoa Ethiopia Micronesia Tanzania
Angola Fiji Moldova Thailand
Antigua and Barbuda Gabon Mongolia The Gambia
Argentina Georgia Montenegro Timor-Leste
Armenia Ghana Morocco Togo
Azerbaijan Grenada Mozambique Tonga
Bangladesh Guatemala Myanmar Tunisia
Belarus Guinea Namibia Turkey
Belize Guinea-Bissau Nepal Turkmenistan
Benin Guyana Nicaragua Tuvalu
Bhutan Haiti Niger Uganda
Bolivia Honduras Nigeria Ukraine
Bosnia and Herzegovina India Pakistan Uruguay
Botswana Indonesia Palau Uzbekistan
Brazil Islamic Rep. of Iran Panama Vanuatu
Bulgaria Iraq Papua New Guinea Venezuela
Burkina Faso Jamaica Paraguay Viet Nam
Burundi Jordan Peru
Cambodia Kazakhstan Philippines Yemen
Cameroon Kenya Romania Zambia
Cape Verde Kiribati Russian Federation Zimbabwe
Central African Republic Kosovo Rwanda
Chad Kyrgyz Republic Samoa
Chile Lao PDR Senegal
China Latvia Serbia
Colombia Lebanon Seychelles
Comoros Lesotho Sierra Leone
Congo Liberia Solomon Islands
Costa Rica Libya Somalia
Cuba Lithuania South Africa
Côte d'Ivoire Macedonia South Sudan
Dem. Rep. of the Congo Madagascar Sri Lanka
Dem. Rep. of Korea Malawi St. Lucia
Djibouti Malaysia
St. Vincent and Grenadines
Dominica Maldives Sudan
Dominican Republic Mali Suriname
28
Annex table 4. OLS regression of poverty indexes at poverty line of $ 1.25 per day (PPP)
Explanatory variables
Dependent variable is poverty rate (%) Dependent variable is poverty gap index (%) Model 1 Model 2 Model 3 Model 4 Model 1 Model 2 Model 3 Model 4
Documents required for exporting (number)
0.915** 0.341
(0.439) (0.232)
Documents required for exporting (number)
1.229*** 0.537***
(0.297) (0.153)
Time taken to export (days)
0.177*** 0.071***
(0.051) (0.025)
Time taken to import (days)
0.202*** 0.089***
(0.050) (0.026)
Population density (people/km2)
0.018*** 0.018*** 0.019*** 0.016*** 0.007** 0.007** 0.007** 0.006** (0.006) (0.006) (0.006) (0.005) (0.003) (0.003) (0.003) (0.002)
2005 Base Base
Omitted Omitted
2006 -0.613 -0.216 -0.257 -0.434 0.656 0.823 0.795 0.728 (2.329) (2.323) (2.235) (2.150) (1.310) (1.300) (1.283) (1.230) 2007 -3.196 -2.417 -2.776 -2.161 -0.781 -0.440 -0.613 -0.326 (2.639) (2.550) (2.612) (2.554) (1.173) (1.146) (1.172) (1.148) 2008 -3.147 -2.292 -2.301 -1.688 -0.789 -0.413 -0.451 -0.144 (1.989) (1.906) (1.944) (1.982) (0.954) (0.926) (0.960) (0.982) 2009 -6.809*** -5.720*** -6.408*** -5.657*** -2.463** -1.978** -2.299** -1.946* (2.155) (2.058) (2.062) (2.090) (1.012) (0.972) (0.992) (1.006) 2010 0.758 1.453 1.724 2.522 1.101 1.437 1.500 1.911
(3.131) (3.069) (3.100) (3.142) (1.848) (1.851) (1.856) (1.865) East Asia and the
Pacific Base Omitted Europe and
Central Asia
-15.125*** -15.460*** -15.403*** -15.774*** -3.398*** -3.614*** -3.537*** -3.756*** (2.599) (2.545) (2.457) (2.351) (0.698) (0.688) (0.646) (0.621) Latin America and
Caribbean
-9.595*** -9.031*** -9.108*** -9.466*** -0.546 -0.305 -0.354 -0.495 (2.587) (2.518) (2.445) (2.329) (0.742) (0.746) (0.704) (0.660) Middle East and
North Africa
-16.211*** -16.292*** -17.276*** -17.989*** -3.838*** -3.876*** -4.263*** -4.622*** (2.923) (2.767) (2.949) (3.012) (0.795) (0.751) (0.854) (0.914) South Asia 1.712 1.574 1.755 1.877 -0.823 -1.010 -0.858 -0.883 (3.905) (3.748) (3.840) (3.653) (1.364) (1.242) (1.239) (1.136) Sub-Saharan
Africa
27.255*** 25.980*** 26.520*** 24.617*** 14.306*** 13.654*** 13.974*** 13.047*** (4.848) (4.722) (4.701) (4.738) (2.418) (2.360) (2.336) (2.318) Constant 11.888*** 7.541** 13.389*** 12.215*** 1.562 -0.733 1.998 1.291
(4.210) (3.695) (3.149) (3.173) (1.955) (1.674) (1.222) (1.294)
Observations 224 224 224 224 224 224 224 224 R-squared 0.686 0.703 0.697 0.706 0.564 0.583 0.574 0.586
29
Annex table 5. OLS regression of poverty indexes at the poverty line of $ 2 per day (PPP)
Explanatory variables
Dependent variable is poverty rate (%) Dependent variable is poverty gap index (%)
Model 1 Model 2 Model 3 Model 4 Model 1 Model 2 Model 3 Model 4
Documents required for exporting (number)
1.705*** 0.703**
(0.577) (0.315)
Documents required for importing (number)
1.783*** 0.910***
(0.422) (0.214)
Time taken to export (days)
0.314*** 0.137***
(0.079) (0.038)
Time taken to import (days)
0.317*** 0.154***
(0.066) (0.036)
Population density (people/km2
)
0.017** 0.016** 0.018*** 0.014* 0.011*** 0.011*** 0.011*** 0.010*** (0.007) (0.007) (0.007) (0.007) (0.004) (0.004) (0.004) (0.004)
2005 Base Base
Omitted Omitted
2006 -3.700 -3.089 -3.062 -3.393 -0.428 -0.133 -0.154 -0.291 (2.941) (2.970) (2.746) (2.719) (1.710) (1.706) (1.634) (1.572) 2007 -6.810* -5.683 -6.066* -5.191 -2.416 -1.839 -2.091 -1.628 (3.627) (3.511) (3.521) (3.470) (1.855) (1.791) (1.832) (1.788) 2008 -6.531** -5.311* -5.036* -4.258 -2.346 -1.715 -1.692 -1.235 (2.814) (2.723) (2.704) (2.779) (1.434) (1.373) (1.403) (1.432) 2009 -11.045*** -9.526*** -10.347*** -9.281*** -4.955*** -4.153*** -4.644*** -4.077***
(3.192) (3.095) (2.968) (3.027) (1.557) (1.488) (1.484) (1.503) 2010 -2.697 -1.892 -1.027 -0.077 0.325 0.826 1.076 1.666
(3.565) (3.372) (3.414) (3.506) (2.316) (2.270) (2.295) (2.322) East Asia and the
Pacific Base Base
Omitted Omitted
Europe and Central Asia
-32.786*** -32.834*** -33.184*** -33.489*** -11.317*** -11.536*** -11.539*** -11.806*** (4.955) (4.878) (4.703) (4.542) (1.866) (1.829) (1.755) (1.676) Latin America and
Caribbean
-25.407*** -24.557*** -24.537*** -25.182*** -7.055*** -6.636*** -6.679*** -6.957*** (4.925) (4.747) (4.636) (4.461) (1.873) (1.815) (1.759) (1.669) Middle East and
North Africa
-30.088*** -30.189*** -31.972*** -32.863*** -11.444*** -11.503*** -12.268*** -12.798*** (5.835) (5.577) (5.691) (5.772) (2.142) (2.021) (2.139) (2.187) South Asia 9.895 10.507 10.148 10.735 1.953 1.906 1.975 2.091
(6.532) (6.616) (6.608) (6.515) (2.705) (2.646) (2.667) (2.556) Sub-Saharan
Africa
23.951*** 22.706*** 22.779*** 20.248*** 18.860*** 17.957*** 18.282*** 16.858*** (6.430) (6.246) (6.109) (6.142) (3.480) (3.381) (3.348) (3.355) Constant 32.571*** 28.793*** 35.780*** 34.892*** 9.440*** 6.392** 10.564*** 9.724***
(6.718) (6.051) (5.398) (5.296) (3.054) (2.662) (2.265) (2.260)
Observations 224 224 224 224 224 224 224 224 R-squared 0.721 0.734 0.737 0.742 0.675 0.693 0.689 0.698
30
Annex table 6. OLS regression of GDP per capita, PPP (constant 2005 international $) and Gini index
Explanatory variables
Dependent variable is log of GDP per capita Dependent variable is Gini index Model 1 Model 2 Model 3 Model 4 Model 1 Model 2 Model 3 Model 4
Documents required for exporting (number)
-0.106*** 0.029
(0.023) (0.201)
Documents required for importing (number)
-0.084*** 0.016
(0.020) (0.177)
Time taken to export (days)
-0.019*** -0.042*
(0.004) (0.023)
Time taken to import (days)
-0.018*** -0.023
(0.003) (0.025)
Population density (people/km2
)
-0.001*** -0.001*** -0.001*** -0.001*** -0.002 -0.002 -0.002 -0.002 (0.000) (0.000) (0.000) (0.000) (0.002) (0.002) (0.002) (0.002) 2005 Base
Omitted
2006 0.024 -0.006 -0.015 0.005 0.734 0.741 0.676 0.729 (0.130) (0.134) (0.120) (0.122) (1.215) (1.216) (1.219) (1.223) 2007 0.082 0.035 0.037 -0.012 0.156 0.167 0.060 0.038
(0.145) (0.145) (0.143) (0.142) (1.219) (1.198) (1.194) (1.197) 2008 0.115 0.061 0.025 -0.012 -0.650 -0.641 -0.864 -0.826 (0.120) (0.119) (0.112) (0.116) (1.125) (1.140) (1.135) (1.160) 2009 0.180 0.118 0.137 0.078 -0.088 -0.076 -0.218 -0.240 (0.149) (0.149) (0.133) (0.138) (1.316) (1.311) (1.287) (1.310) 2010 0.098 0.073 0.001 -0.040 -1.372 -1.369 -1.718 -1.651 (0.175) (0.162) (0.149) (0.158) (1.413) (1.423) (1.396) (1.432) East Asia and the
Pacific Base Omitted Europe and
Central Asia
0.667*** 0.644*** 0.685*** 0.688*** -6.073*** -6.070*** -5.758*** -5.825*** (0.149) (0.149) (0.133) (0.131) (1.266) (1.278) (1.280) (1.302) Latin America and
Caribbean
0.648*** 0.611*** 0.595*** 0.630*** 11.173*** 11.167*** 11.040*** 11.187*** (0.138) (0.133) (0.126) (0.122) (1.233) (1.231) (1.202) (1.210) Middle East and
North Africa
0.198 0.231 0.303 0.325* -3.967** -3.981*** -3.741** -3.740** (0.180) (0.170) (0.192) (0.194) (1.549) (1.528) (1.447) (1.500) South Asia -0.075 -0.174 -0.095 -0.133 -5.739*** -5.717*** -5.232*** -5.439***
(0.180) (0.200) (0.176) (0.190) (1.804) (1.799) (1.827) (1.828) Sub-Saharan
Africa
-0.818*** -0.794*** -0.755*** -0.636*** 3.947* 3.945* 4.476** 4.480** (0.227) (0.223) (0.214) (0.221) (2.033) (2.096) (2.037) (2.152) Constant 8.948*** 8.946*** 8.732*** 8.752*** 40.300*** 40.379*** 41.630*** 41.143***
(0.228) (0.229) (0.193) (0.183) (2.115) (2.082) (1.478) (1.547)
Observations 222 222 222 222 217 217 217 217 R-squared 0.543 0.548 0.594 0.591 0.660 0.660 0.665 0.662