http://www.scirp.org/journal/gep ISSN Online: 2327-4344
ISSN Print: 2327-4336
Studying Malaria Epidemic for Vulnerability
Zones: Multi-Criteria Approach of Geospatial
Tools
Firoz Ahmad
1, Laxmi Goparaju
1, Abdul Qayum
2*1Vindhyan Ecology and Natural History Foundation, Mirzapur, India
2Department of Environment and Forest, Govt. of Arunachal Pradesh, Itanagar, India
Abstract
Introduction: Despite serious interventions worldwide, malaria remains a significant cause of global morbidity and mortality. Malaria endemic zones are predominant in the poorest tropical regions of the world, especially in continental Africa and South-Asia. Major Indian population reside in malaria endemic zones which are tribal dominated and inaccessible. Lack of suitable data, reporting and medical facilities in malaria vulnerable regions handicaps the decision makers in taking adequate steps. Natural resources were mapped to establish their possible linkage with malaria incidence and to delineate ma-laria hotspots using geo-spatial tools. Methods: Remote sensing data along with various ancillary data such as socio-economic (population in general, child population, tribal population, literacy), epidemiology (Malaria API and Pf cases) and environmental parameters (wetness, forest cover, rainfall, aspect, elevation, slope, drainage buffer, and breeding sites) were integrated on GIS platform using a designed weight matrix. Multi criteria evaluation was done to generate hotspot for effective monitoring of malaria incidences. Results: Var-ious thematic layers were utilized for integrated mapping, and the final map depicted 59.1% of the study area is vulnerable to high to very high risk of ma-laria occurrence. Manoharpur Administrative Block consisted of 89% of its area under high to very high probability of malaria incidence and it needs to be prioritized first for preventing epidemic outbreak. Various village pockets were revealed for prioritizing it for focused intervention of malaria control measures. Conclusions: Geospatial technology can be potentially used to map in the field of vector-borne diseases including malaria. The maps produced enable easy update of information both spatially and temporally provide ef-fortless accessibility of geo-referenced data to the policy makers to produce cost-effective measures for malaria control in the endemic regions.
How to cite this paper: Ahmad, F., Go-paraju, L. and Qayum, A. (2017) Studying Malaria Epidemic for Vulnerability Zones: Multi-Criteria Approach of Geospatial
Tools. Journal of Geoscience and
Envi-ronment Protection, 5, 30-53.
https://doi.org/10.4236/gep.2017.55003
Received: March 30, 2017 Accepted: May 19, 2017 Published: May 22, 2017
Copyright © 2017 by authors and Scientific Research Publishing Inc. This work is licensed under the Creative Commons Attribution International License (CC BY 4.0).
Keywords
Geo-Spatial Tools, GIS, Integrated Mapping, Multi-Criteria Analysis, Remote Sensing
1. Introduction
Malaria and tuberculosis have global coverage and although no longer classified as Neglected Tropical Diseases (NTDs), share the characteristic of insufficient attention from the research community towards control and therapy. Tropical regions are home to both diversified natural resources and local populations from ancient times, allowing the development of traditional practices in disease control and management [1]. Malaria is a parasitic protozoal disease, caused by parasites of Plasmodium genus and transmitted to man by species of infected female Anopheles mosquito [2]. The parasite belongs to the diverse group of unicellular eukaryotes called protozoa. The genus has 250 Plasmodium species but Plasmodiumfalciparum and Plasmodiumvivax are two key species found in the Indian sub-region [3]. Most prevalent among them is the Plasmodium falci-parum which alone is responsible for the maximum deaths [4]. Falciparum ma-laria has the highest fatality rate worldwide [5]. It is estimated that 20% of the world population in tropical areas and the some of the poorest countries, are living under the high risk of malaria [6].
The spread of malaria depends on three important factors of malaria parasite, human host and the female Anopheles mosquito. The process begins when the germs enter the mosquito as soon as it bites a person infected with malaria. It sucks up its blood along with some germs, and the germs start growing in the body of a mosquito which takes about 7 - 10 days [7]. This is called the incuba-tion period when the same mosquito bites a healthy person; it transfers some of the malarial germs into the new host thus causing infection. An exponential in-crease in mosquito-borne diseases has been reported in the recent past. It is pri-mary because of the development of drug resistance in previously contained diseases and discovery of novel diseases.
Around 2.5 million malaria cases are reported annually from Southeast Asia, of which India alone contributes 76% [8]. Behind all statistics and graphs there exists the tragedy that malaria takes the life of an African child every minute. The tribal, hilly and remote places constitute a large part of the country’s popu-lation (85%), and around 95% are found to reside in malaria endemic zones [9]. The cases of P. falciparum (53.7%) and P. vivax (46.3%) are observed to be widespread (both independently and together) in India, particularly in the north-eastern States and States of Jharkhand, Chhattisgarh, Madhya Pradesh, Rajasthan, and Orissa in India [10].
spatial analysis was done for an effective environment strategy in urban areas of Dar es Salam by Dongus et al. [12]. In Venezuala, Delgado et al. [13] utilized geospatial technology to identify and delineate a malaria corridor. Areas which are vulnerable to vector habitat suitability have been assessed using satellite data at various resolutions such as IRS LISS I, LISS II and WiFS [14][15][16]. An in-tegrated approach is required to tackle the above problem wherein the incorpo-ration of latest technology is required to predict the problematic areas, spatial mapping and assessment of transmission risk. Further, reliable and accurate data is needed for vector control and vector borne disease control and management [17][18].
A pivotal role is played by the forest ecosystems towards malaria transmission [19]. The suitable habitat for vectors is surface water for reproduction; humidity needed for adult mosquito survival, influence of temperature for developmental rates of both vector and parasite populations [20][21]. Thus, the mosquito pop-ulation varies according to the forest locality and their behavior is governed by forest microclimate, human population and social behavior. Forests with hilly areas and streams arising from slopes which provide efficient breeding sites are conducive for malaria vector growths [22]. Forest ecosystems were reported as meso-endemic to hyper-endemic to the conditions of malaria [23].
The advent of information processing tools which can be used to map natural resources, climatic factors, and disease epidemiology provides a powerful me-chanism for identifying previously unknown disease causing factors and control mechanism. In order to understand the frequent malaria epidemics it is neces-sary that it is understood at large both spatially and temporally with respect to the various environmental parameters being an environmental disease [24]. Satel-lite data of various resolutions when coupled with geographic information system (GIS) provide huge scope to analyze large data at low cost, accurate and in an ef-ficient manner. Such data have been employed to study the mosquitoes breeding habitats in India, where the remotely sensing (RS) data was found capable of mapping vector habitat areas, estimating vector abundance and vector density.
Landsat satellite data was used to predict Anopheles mosquito population dy-namics in the coastal plain of Chiapas, Mexico, by integrating GIS and field re-search [25]. Landsat TM data was found useful in identifying Anopheles larva habitat sites in California [26]. It was also used in mapping rift valley fever vec-tors in Kenya, East Africa and image was classified and delineated roads, water, vegetation which helped in revealing habitat types which produced low, medium and high larva producing groups.
pastures.
Ahmed [27] used Multi criteria analysis (MCA) by integrating various the-matic layers along with RS data and on GIS platform for malaria risk mapping for the district of Kersa in Ethiopia. Most of the natural factors involved were assessed and malaria risk maps were produced. Qayum et al. [28] incorporated various socio-economic, epidemiological and geographic features and integrated these datasets to identify malarial hotspots by using twelve thematic layers. Many tribal areas in India have been studied for malaria dynamics including So-nitpur district in Assam [5]; Koraput district in Orissa [29]; Mewat region in Harayana [30] and Udalguri district of Assam by Yadav et al. [31].
The present study was aimed for tribal dominated Indian State of Jharkhand, where malaria incidences are high yet sufficient database is lacking and malaria hotspots have not been identified so far leading to numerous problems in effec-tive monitoring of the epidemic disease. The objeceffec-tives of the current study was to apply GIS tools on RS and other ancillary data for visualizing and analyzing the various environmental, socio-economic and epidemiological data to reveal trends and interrelationships towards malaria incidences and to obtain a malaria risk map or vulnerability map of the target malaria endemic zone.
2. Materials and Methods
2.1. The Study Area
The present study area lies between the geographic coordinates of Latitude 22˚04'21''N to 22˚52'42''N and Longitude 84˚58'08''E to 85˚44'32''E and the total geographical area covered by it is approximately 355,136 Ha (Figure 1). It falls in Chakardharpur subdivision of the West Singhbhum district of the Jharkhand state in India. It is basically a tribal dominated subdivision. The range of eleva-tion from the mean sea level differs from 170 m to 883 m. The forests of this area are best described by Champion and Seth (1968) [32], as moist peninsular valley
Shorea robusta (Sal) under the category [3C/C2e (iii)]. Natural regeneration seems to be best seen here and disparity in tree structure and composition is found to be different with moisture because of variation in aspect and slope of the land. Other important features are hills alternating with valleys, steep moun-tains and dense forests on the mountain slopes. Besides, Asia’s famous dense Sal forests are found in Saranda forests which form a part of the subdivision.
2.2. Data Preprocessing and Analysis
Figure 1. Study area (clockwise): → India → Jharkhand State → West Singhbhum district → Chakardharpur.
Digital elevation model (DEM) was downloaded from the USGS portal (ASTER DEM, resolution 30 m). Various obtained tiles were mosaicked and a subset was generated from the mosaic image using the vector layer for the study area. The-matic maps such as slope, aspect, elevation, drainage maps were generated using spatial analyst ArcGIS (10.1) and ERDAS Imagine software. Ancillary data such as rainfall, general population, child population, tribal population, literacy, epi-demiology (Malaria API and Pf cases) were used to generate individual maps based upon interpolation technique and as per the schematic flowchart (Figure 2).
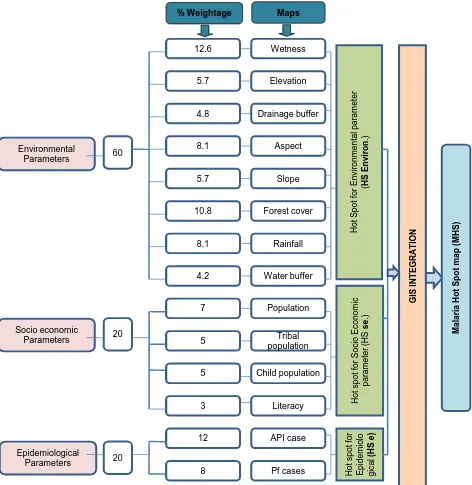
Figure 2. Flow chart showing the methodology.
2.3. Environmental Parameters
Malaria transmission is strongly associated with environmental parameters, which control mosquito breeding and parasite growth [33][34]. Consequently parameters such as wetness index, forest cover, rainfall, aspect, elevation, slope, distance to stream (drainage buffer), breeding sites (water buffer) were consi-dered in order of importance based upon findings of various research outputs and accordingly weights and respective ranks were provided for different the-matic map and its significance towards malaria hotspot identification (Table 1 and Figure 4).
2.3.1. Wetness Index
This is one of the strong environmental parameters which provides suitable ha-bitat for the malaria vectors to thrive [35]. Baig et al. [36] has developed the me-thodology to map wetness using Landsat 8 data and has developed the wetness Software
Function RS (Landsat 8)
Socio economic Parameter
Epidemiological Parameter Wetness
Forest cover
Rainfall
Water buffer
Population
Tribal population
Child population
Literacy
API
Pf case Maps
Aster DEM Ancillary Data
Databases (DBs)
Environmental Parameter
Image Processing and GIS ERDAS Imagine & ArcGIS
Elevation Drainage buffer
Aspect
Figure 3. Schematic flowchart showing for malaria hotspot analysis.
coefficient for different bands (Table 2). The wetness map of the study area was generated using the coefficient of Table 2 and five classes (<1, 1 - 7, 7 - 23, 23 - 32, >=32) were identified and ranked as 1, 2, 3, 4, and 5 with respective degree of vulnerability as very low, low, moderate, high, and very high (Figure 4(a)).
2.3.2. Forest Cover
Forest ecosystems are one of the important parameters well known to support transmission of malaria [37]. Dense forest generates lot of leaf, which after de-composition produces litters with high moisture content which provides better environment for the mosquitoes to layeggs, development of larvae, pupae of
M a la ri a H o t Sp o t m a p (M H S) Environmental Parameters Socio economic Parameters Epidemiological Parameters
% Weightage Maps
Table 1. Weight matrix for environmental parameters.
Environmental factor Weight Class interval Ranks Degrees of vulnerability
Wetness 12.6
<1 1 - 7 7 - 23 23 - 32 >=32 1 2 3 4 5 Very low Low Medium High Very high
Forest cover 10.8
Dense forest Medium forest Open forest Non forest 5 4 3 1 Very high High Medium Very Low
Rainfall 8.1
<1257 mm 1257 - 1264 mm 1264 - 1271 mm 1271 - 1278 mm >=1278 mm 1 2 3 4 5 Very low Low Medium High Very high
Aspect 8.1 Non shadow Shadow 1 3 Very low Medium
Elevation 5.7
<200 meter 200 - 400 meter 400 - 600 meter 600 - 800 meter >=800 meter 5 4 3 2 1 Very high High Medium Low Very low
Slope 5.7
<4 4 - 9 9 - 18 >=18 4 3 2 1 High Medium Low Very low
Drainage buffer 4.8
<250 meter 250 - 500 meter 500 - 750 meter 750 - 1000 meter >=1000 meter 5 4 3 2 1 Very high High Medium Low Very low
Water buffer 4.2
[image:8.595.210.539.87.519.2]<400 meter 400 - 800 meter 800 - 1200 meter 1200 - 1600 meter >=1600 meter 5 4 3 2 1 Very high High Medium Low Very low
Table 2. Wetness coefficients for Landsat 8 OLI reflectance.
Band Blue Green Red NIR SWIR 1 SWIR 2
Wetness 0.1511 0.1973 0.3283 0.3407 −0.7117 −0.4559
(a) (b)
(e) (f)
[image:10.595.58.541.56.702.2]
(g) (h)
2.3.3. Rainfall Intensity
Rainfall is considered as the most important malaria triggering parameter and its spatial variation shows a heavy positive correlation with malaria incidence [38]. Several studies were done for malaria mapping in India and Africa. Qayum et al. [28] used rainfall data as one of the environmental parameters for GIS integra-tion to generate malaria hotspots. Increase in precipitaintegra-tion increases the likelih-ood of increasing vector populations and increases the availability of anopheles breeding sites. The rainfall data from (1990 to 2002) was downloaded from the website [39]. The average (13 years) annual rainfall was used to generate spatial rainfall pattern (continuous surface) in Arc GIS by Kriging method of interpola-tion. The rainfall map was further classified into five classes (Table 1) based upon malaria risk level (Figure 4(c)).
2.3.4. Aspect
Aspect is another important parameter which affects malaria transmission [40]. The northern aspect ranges from NW340˚ to NE70˚ and is called as shadow area. In the shadow area due to lack of direct sunlight, moisture content is high as well as relatively dense vegetation is found when compared with the other as-pects [41]. Shadow affects the larval distribution for the malarial risk [42]. Northern aspect (shadow area) is more susceptible to malaria. Aspect map was generated from DEM and reclassified into two classes of shadow and non-shadow and were ranked as 3 and 1 with description of moderate and very low, respec-tively (Figure 4(d)).
2.3.5. Digital Elevation Model (DEM)
As the elevation increases, temperature gradually decreases, which affects the mosquito breeding as the length of immature stage in life cycle [43]. At high temperatures, various stages like egg, larval and pupae, the time span will be shortened such that the turnover will be increased. DEM was reclassified into five sub groups at 200 meter interval and new values were re-assigned towards integrated (Figure 4(e), Table 1).
2.3.6. Slope
It is one of the important topographic parameters, which can determine the ex-istence of mosquito larval habitat [40]. It is described as the rate of change of elevation of the land per unit distance. The steeper slopes are known to allow faster movement of water and affects stability of aquatic habitats [44]. At gentle slopes surface water movement is nearly stagnant and this creates fertile situa-tion for mosquito breeding sites. The slope was derived from aster DEM of the study area and reclassified in to four classes using standard reclassification tech-nique (Figure 4(f); Table 1).
2.3.7. Drainage Buffer (Distance to Stream)
as basis for reclassification of the drainage layer. Flow distance-to-stream (drai-nage buffer) affected availability of the aquatic habitat and was calculated based upon creating multiple buffer of 250 meter distance using drainage layer. The drainage layer was derived from ASTER DEM using Spatial Analyst tool hy-drology of Arc GIS (Figure 4(g)).
2.3.8. Waterbuffer (Distance to Breeding Site)
Wetlands provide habitats for the juvenile (immature) stages (egg, larvae, pupae) of the malaria vectors. Monitoring the state of small water bodies and wetlands using satellite data is therefore very useful in identifying the source of malaria vectors. Two-kilometer distance around wetlands was considered to be the maximum flying distance for the mosquitoes. Water bodies were extracted using the satellite map and multi water buffer with interval of 400 m was created. It was classified into five classes and was ranked as 5, 4, 3, 2, and 1 with description ranging from very high to very low (Figure 4(h)).
2.4. Socio-Economic Parameters
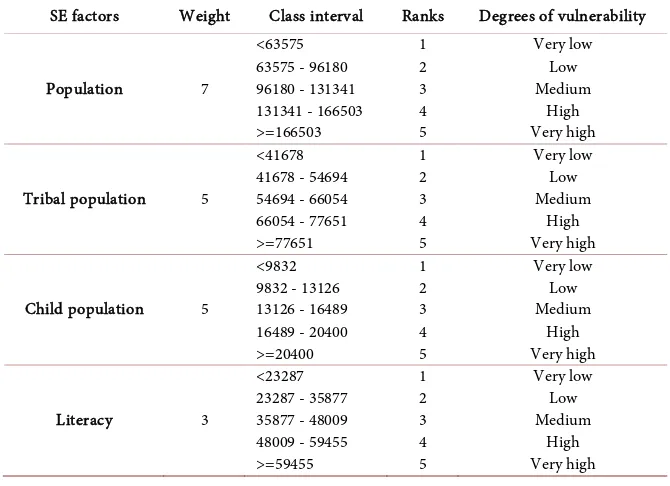
Socio economic parameter is another major layer in integrated mapping towards understanding the malaria transmission [47]. Both malaria incidences and transmission showed significant relationship with socio-economic parameter and accordingly weights for different sub-layers such as population, tribal popu-lation, child popupopu-lation, literacy were chosen (Table 3).
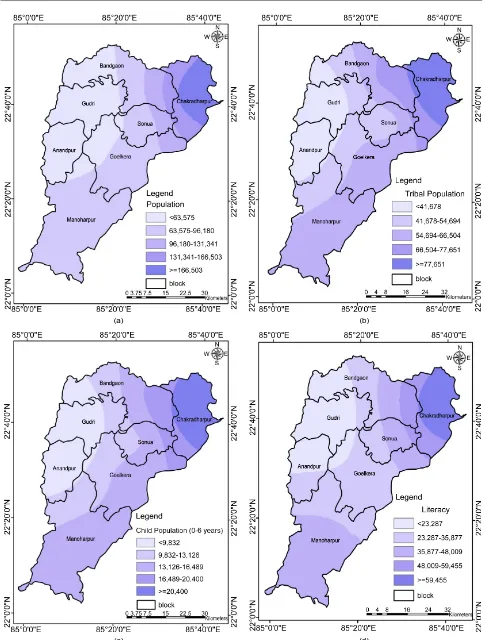
2.4.1. General Population
[image:12.595.205.540.497.740.2]It is one of the most important socio-economic parameter which is directly re-lated to the increasing risk of malaria. The population data of census 2011 [48] for the study area was interpolated in ArcGIS to create population map (Figure 5(a)).
Table 3. Weight matrix for socio-economic parameters.
SE factors Weight Class interval Ranks Degrees of vulnerability
Population 7
<63575 63575 - 96180 96180 - 131341 131341 - 166503 >=166503 1 2 3 4 5 Very low Low Medium High Very high
Tribal population 5
<41678 41678 - 54694 54694 - 66054 66054 - 77651 >=77651 1 2 3 4 5 Very low Low Medium High Very high
Child population 5
<9832 9832 - 13126 13126 - 16489 16489 - 20400 >=20400 1 2 3 4 5 Very low Low Medium High Very high
Literacy 3
(a) (b)
[image:13.595.56.542.57.697.2]
(c) (d)
The map was further classified into five classes with ranks 1, 2, 3, 4, and 5 and description as very low, low, moderate, high, and very high, respectively.
2.4.2. Tribal Population
Tribal population usually stay in remote areas with limited means of communi-cation and in difficult geographical conditions marked by the presence of forests, hills, valleys and perennial streams [49] with very low literacy rates [50]. The community prefers to go to spiritual healer for the treatment [51] or to un-trained and unlicensed practitioners rather than a registered medical doctor and they are always at high malarial risk. Sharma et al. [52] analyzed the tribal popu-lation in India and concluded that malaria cases and malarial deaths were high when compared to other populations. Tribal population map was generated by method of interpolation using the census data 2011 (Figure 5(b)).
2.4.3. Child Population
The children population (0 - 6 year) as per data of census 2011 was interpolated for the mapping, which was further classified into five classes and was ranked as 1,2, 3, 4 and 5 with description very low, low, moderate, high, and very high, re-spectively (Figure 5(c)).
2.4.4. Literacy
Literacy enhances awareness towards better malaria control practices and meas-ures towards prevention of the incidences [53]. Censes 2011 data of literacy was used for creating thematic map and the map was further classified into five classes varying from very low to very high (Figure 5(d)).
2.5. Epidemiological Parameters
Malaria distribution is strongly associated with spatial distribution pattern of epidemiological parameter, which provides the unique information on its im-portance for malaria hotspots. Accordingly, Annual Parasite Incidence (API) and P. falciparum cases were chosen with weights and ranks (Table 4).
2.5.1. Annual Parasite Incidence (API)
[image:14.595.208.539.605.735.2]API data for the year 2010 of different districts in and around the study area was used for interpolation [54] and map was developed (Figure 6(a)).
Table 4. Weight matrix for epidemiological parameters.
Epidemiology factors Weight Class interval Ranks Degrees of vulnerability
API 2010 12
<7.7 7.7 - 7.8 7.8 - 7.9 7.9 - 8 >=8
1 2 3 4 5
Very low Low Medium
High Very high
Pf case 2011 8
<2855 2855 - 3596 3596 - 4338 4338 - 5095 >=5095
1 2 3 4 5
Very low Low Medium
[image:15.595.57.540.58.367.2]
(a) (b)
Figure 6. Maps of epidemiology parameters. (a) API 2010 map; (b) Malaria Pf cases map.
2.5.2. Pf Case
The data for total Pf cases for the year 2011 was reported by Ray [55] and it was interpolated to generate Pf 2011 map and classified into five varying from very low to very high based upon number of fatality cases due to Pf (Figure 6(b)).
2.6. Malaria Hotspot Identification
Malaria hotspot identification algorithm was used as it was done by Qayum et al. [28], which is:
MHS = HS se × HS epidemiology × HS env;
where, MHS =Malaria hotspot, HSse is hotspot for socio-economic parameters,
HSepidemiology is hotspot for epidemiology, HSenv is hotspot for environmental
pa-rameters. Malarial hotspot mapping was done using trio of environmental, so-cio-economic and epidemiological parameters with weights as per the schematic diagram (Figure 3).
3. Result and Discussion
“moderate” and “low” category (Figure 7). “Very high” category of the area can be termed as hotspots which may be used to define government policy for the focused intervention towards malaria control measures.
3.1. Malaria Hotspot Analysis
[image:16.595.209.537.323.720.2]The malaria hotspot for environmental parameters was computed using the chosen environmental variables such as topographic factors (elevation, aspect, slope, wetness and buffer distance to stream), forest cover, rainfall and breeding sites (buffer distance from water bodies) was developed and weighted using ERDAS Imagine and ArcGIS tool. Similarly, for socio-economic parameter, it was computed and weighted using socio-economic variables such as population, child population, literacy and tribal population. The malaria hotspot for epide-miological parameter (API and P. falciparum cases) shows strong correlation of spatial distribution pattern of it over the study area which was generated using spatial analyst module which provides valuable inputs for malaria hotspot iden-tification. Weights were assigned to these parameters (environmental 60%,
socioeconomic 20% and epidemiological 20%) for integrated mapping. These weights were in consonance with Qayum et al. [28] for the malaria hotspot iden-tification.
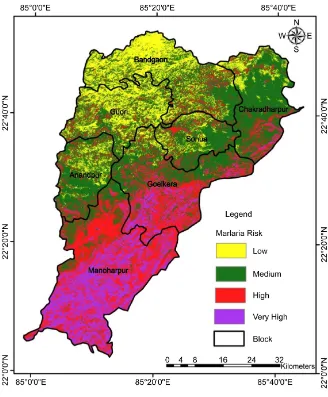
The final output raster layer was reclassified according to the risk level in to four sub groups as very high, high, moderate and low hotspot areas (Figure 7). The results of the study showed 16.8%, 42.3%, 27.6% and13.3% area were sub-jected to very high, high, medium and low malaria hotspot rating, respectively (Table 5).
Various environmental and socioeconomic parameters are interrelated and influence the possibility of malaria outbreak. All such environmental parameters were incorporated in the present study to delineate areas suitable for mosquito growth. The result obtained was classified into four malaria hotspot rating:
Very high: These areas were found to be in southern part of the study area highly dominated by tribal population, covered with dense forest, high wetness, high rainfall with lot of perennial streams with gentle slope and moderate to low elevation provide most conducive environment for grow of malaria parasite. It surrounds 16.8% of total area amounting to 59,795.19 Hectares.
High: The high priority areas were found from north to southern part (very low concentration in north west part) of the study area, dominated with tribal population covered with dense to medium forest, moderate wetness, medium rainfall with streams with moderate to gentle slope and high to low elevation provides moderate favorable conditions for the parasite growth and accounted for 42.3% of total area (1,50,182.1 Hectares).
Medium: These areas were found in north (high concentration) to south part (low concentration) with moderate population in general and sparse to medium tribal population, covered with medium to open forest, moderate wetness, low to moderate rainfall with less streams, high to moderate slope and moderate to high elevation provides less moderate favorable condition for the parasite growth. This category accounts for 27.6% of total area (98,089.29 Hectares).
[image:17.595.207.541.630.728.2]Low: Low priority areas were found to be more in north to central part of the study area (concentration is more in the north-west) with low population in general and low to sparse tribal population, covered with open forest to non- forest, low wetness, low rainfall, high slope and high elevation which provides less favorable condition for the malaria parasite to grow. It accounts for 13.3% of total area (47,069.55 Hectares).
Table 5. Malaria hotspot rating of study area with area statistics.
Malaria hotspot rating Area in hectares Percentage
Very high 59795.19 16.8
High 150182.1 42.3
Medium 98089.29 27.6
The identified hotspots ranking (block-wise) of the study area was presented through a bar diagram (Figure 8). Administrative Blocks such as Manoharpur, Goelkera, Chakadharpur, Anadpur, Sonua, Bandgaon and Gudricomprised of-more than fifty percent area under medium to very high hotspot ranking. How-ever, Manoharpur, Goelkera Blocks consisted more than fifty percent of its area under high to very high hotspot ranking and Manoharpur block comprised of 89 percent of its area under high to very high malaria hotspot ranking which must be prioritized first for malaria control measures by the government agencies. And, from microscopic point of view the villages such as Holonguli, Thalkobad, Tinilposi, Baliba, Ankuwa and Chiria of Manohpur Block should be prioritized for an urgent policy intervention.
3.2. Geospatial Technology and Disease Management
The triangular relationship of climate change, the environment, and disease outbreaks is attaining importance and a need to address such issues through GIS based decision support system is increasingly gaining momentum. It could be-come an indispensable tool for disease management as it has inherent ability to manage spatial, non-spatial and temporal data [56]. GIS is intricately inter- connected with several interfaces of human, data, server and tools and comprises a set of strategies and tools capable of integrating, storing, editing, analyzing and displaying geographically referenced information from various sources [29].
[image:18.595.60.538.430.716.2]Malaria is a local and focal disease. Besides ecological parameters which influ-ence the disease there are some important local factors such as socio-economic,
socio-cultural and behaviour patterns of the community which play a major role in disease transmission. If these parameters are to be used for decision-making, they must be well organized and managed. It can be accomplished by introduc-ing a GIS for analysis and management. GIS mappintroduc-ing would make it easy to up-date information instantly and to identify the trouble spots at the village level, which is the lowest unit equipped with computer facilities and the information can reach instantly to state and the policy makers to formulate focused and cost effective malaria control strategy. Malaria is a complex disease and its distribu-tion and intensity vary from place to place. Stratificadistribu-tion of the potential disease causing factors has become an essential feature for the planning and develop-ment of a sound control strategy to maximize the utilization of available re-sources. It can also provide guidelines as to which strategy could be most suited and economical under the existing conditions. It is largely accepted that the cur-rent technology is becoming mandatory for economic and environmental plan-ning especially for developing nations [57].
The present study utilized remote sensing data and multi-criteria analysis in GIS domain to achieve Malaria hotspot mapping. This area is reported to have meso-endemic to hyper-endemic conditions for malaria occurrence. A tribal dominated society, inaccessible forested areas, lack of infrastructure and in addi-tion to these lack of suitable database creates an alarming situaaddi-tion towards an epidemic outbreak. A good database about malaria hotspot will guide the au-thorities to concentrate their limited relief measures and will guide for strategic use of resources. Thus, such databases can be used to control a priori-mosquito breeding sites and post outbreak, damaging the mosquito breeding sites. Geos-patial technology has the capability to study sGeos-patially, in less time and with greater accuracy. Maps produced give adequate information for concerned au-thorities. Further, such epidemics can be monitored regularly at various time pe-riods and data updating becomes much easy.
4. Conclusions
The results of the study illustrated that malaria is heavily influenced by major environmental parameters and socio-economic factors and these factors play a vital role either directly or indirectly in the occurrence of this vector-borne dis-ease. The support of satellite data and integration of various parameters in GIS helps in delineating areas which needs priority in policy formulations and sig-nificant steps shall be taken to prevent the spread of disease in such priority areas. The developed database in this work will greatly assist the health depart-ment in fighting the malaria epidemic. The potential of geospatial data cannot be ignored, it is cost effective, accurate and less time consuming.
decide on how the resources should be allocated to tackle malaria. This data provides guidelines to assess the progress of control and indicates which geo-graphic area should be prioritized. The present study has made an attempt to develop a hotspot map of malaria that would support malaria related decision making process Chakardharpur subdivision of west Singhbhum District. Geos-patial technology can be used in the field of vector-borne diseases including ma-laria. The malaria risk maps enable easy update of information and effortless ac-cessibility of georeferenced data to policy makers to produce cost-effective measures for malaria control in the endemic regions. Computerized spatial da-tabase and GIS mapping software provide powerful tools for the management and analysis of malaria control programs.
Ethics Approval and Consent to Participate
Not applicable.Consent for Publication
Not applicable.Availability of Data and Materials
The datasets used and/or analysed during the current study available from the corresponding author on reasonable request. And, most of the data generated or analysed during this study are included in this published article.
Competing Interests
The authors declare that they have no competing interests.
Funding
No funding in any form has been received by any of the author for current work.
Authors’ Contributions
FA proposed the idea and analyzed the satellite and ancillary data in GIS do-main, LG supervised the analysis and drafted the manuscript. AQ made critical evaluation towards malarial suitability of geospatial technology and provided continuous feedbacks. All authors read and approved the final manuscript.
Acknowledgement
The authors are grateful to the USGS portal for free downloading of Landsat da-ta used for analysis and also to NVBDCP, New Delhi for downloading of Malaria API data for year 2010. This research did not receive any grant from funding agencies in the public, commercial, or not-for-profit sectors.
References
Mapping of Antimalarial Plants: Spatial Distribution Analysis. Journal of Geo-graphic Information System, 6, 478-491. https://doi.org/10.4236/jgis.2014.65041
[2] Park, K. (2013) Textbook of Preventive and Social Medicine. 22nd Edition, Banar-sidas Bhanot, Jabalpur, 234-235, 248.
[3] Carlton, J., Silva, J. and Neil, H. (2005) The Genome of Model Malaria Parasites, and Comparative Genomics. Current Issues in Molecular Biology, 7, 23-37.
[4] WHO Report. http://www.who.int/mediacentre/factsheets/fs094/en/
[5] Nath, M.J., et al. (2013) Prioritizing Areas for Malaria Control Using Geographical Information System in Sonitpur District, Assam, India. Public Health, 127, 572-578.
https://doi.org/10.1016/j.puhe.2013.02.007
[6] CDC. Centers for Disease Control and Prevention. Department of Health and Hu-man Services. Schema of the Life Cycle of Malaria.
http://www.cdc.gov/malaria/biology/life_cycle.htm
[7] Scott, F.L. Anti-Protozoals. Department of Pharmaceutical Sciences, College of Pharmacy, Oklahoma State University, Weatherford, OK.
http://faculty.swosu.edu/scott.long/phcl/antiprot.htm.2007
[8] WHO (2012) World Malaria Report. World Health Organization, Geneva. [9] Hamar, D.H., et al. (2009) Burden of Malaria in Pregnancy in Jharkhand State,
In-dia. Malaria Journal, 8, 210. https://doi.org/10.1186/1475-2875-8-210
[10] Malaria Atlas Project. www.map.ox.ac.uk
[11] Hay, S., Rogers, D.J., Toomer, J.F. and Snow, R.W. (2000) Annual Plasmodium Fal-ciparum Entomological Inoculation Rates (EIR) across Africa: Literature Survey In-ternet Access and Review. Transactions of The Royal Society of Tropical Medicine and Hygiene, 94, 113-127. https://doi.org/10.1016/S0035-9203(00)90246-3
[12] Dongus, S., et al. (2009) Urban Agriculture and Anopheles Habitats in Dar es Sa-laam, Tanzania. Geospatial Health, 3, 189-210. https://doi.org/10.4081/gh.2009.220
[13] Delgado, L., Camardiel, A., Aguilar, V., Martinez, N., Codova, K. and Ramos, S. (2011) Geospatial Tools for the Identification of a Malaria Corridor in Estado Sucre, a Venezuelan North Eastern State. Geospatial Health, 5, 169-176.
https://doi.org/10.4081/gh.2011.168
[14] Palaniyandi, M. and Mariappan, T. (2012) Containing the Spread of Malaria with Geospatial Technology—A Case Study with Vizag City, India. Geospatial World, 8, 1-9.
[15] Palaniyandi, M. (2004) The Impact of National River Water Projects on Regional Climatic Changes and Vector Borne Disease Outbreaks in India. Paper presented at the National Conference on Climate Change and Its Impact on Water Resources in India, School of Earth and Atmospheric Sciences, Madurai Kamaraj University, Madurai, Tamil Nadu, India.
[16] Sharma, V.P., et al. (1996) Study on Feasibility of Delivering Mosquitogenic Condi-tions in and Around Delhi Using IRS Data. Indian Journal of Malariology, 33, 107- 125.
[17] Palaniyandi, M. (2013) GIS Mapping of Vector Breeding Habitats. Geospatial World Weekly, 9, 1-4.
[18] Robert, V., Macintyre, K., Keating, J., Trape, J.F., Duchemin, J.B. and Warren, M. (2003) Malaria Transmission in Urban Sub-Saharan Africa. The American Journal of Tropical Medicine and Hygieneg, 68, 169-176.
Tropical Medicine and International Health, 10, 251-262.
https://doi.org/10.1111/j.1365-3156.2004.01378.x
[20] Walker, M., et al. (2013) Temporal and Micro Spatial Heterogeneity in the Distribu-tion of Anopheles Vectors of Malaria along the Kenyan Coast. Parasites and Vec-tors, 6, 311. https://doi.org/10.1186/1756-3305-6-311
[21] Alias, H., et al. (2014) Spatial Distribution of Malaria in Peninsular Malaysia from 2000 to 2009. Parasite and Vectors, 7, 186. https://doi.org/10.1186/1756-3305-7-186
[22] Rattanarithikul, R., et al. (1995) Larval Habitats of Malaria Vectors and Other Anopheles Mosquitoes around a Transmission Focus in Northwestern Thailand.
Journal of the American Mosquito Control Association, 11, 428-433.
[23] Kumar, A., Valecha, N., Jain, T. and Dash, A.P. (2007) Burden of Malaria in India: Retrospective and Prospective View National Institute of Malaria Research, Field Station, Panaji, Goa, India. National Institute of Malaria Research, Delhi.
[24] Ashenafi, M. (2003) Design and Water Management of Irrigation Systems to Con-trol Breeding of Anopheles Mosquitoes. Case Study: Hara Irrigation Project, Arba Minch, Ethiopia. M.Sc. Thesis, Wageningen University, Wageningen, The Nether-lands.
[25] Pope, K.O., Sheffner, E.J. and Linthicum, K.J. (1992) Identification of Central Ke-nyan Rift Valley Fever Virus Vector Habitats with Landsat TM and Evaluation of Their Flooding Status with Airborne Imaging Radar. Remote Sensing of Environ-ment, 40, 185-96.
[26] Wood, B.L., Beck, L.R., Washino, R.K., Hibbard, K.A. and Salute, J.S. (1992) Esti-mating High Mosquito-Producing Rice Fields Using Spectral and Spatial Data. In-ternational Journal of Remote Sensing, 13, 2813-2826.
https://doi.org/10.1080/01431169208904083
[27] Ahmed, A. (2013) GIS and Remote Sensing Integrated for Malaria Risk Mapping, the Case of Kersa District, Ethiopia. 14th ESRI India User Conference.
[28] Qayum, A., Arya, R., Kumar, P. and Lynn, A.M. (2015) Socio-Economic, Epidemi-ological and Geographic Features Based on GIS Integrated Mapping to Identify Malarial Hotspots. Malaria Journal, 14, 192.
https://doi.org/10.1186/s12936-015-0685-4
[29] Daash, A., Srivastava, A., Nagpal, B.N., Saxena, R. and Gupta, S.K. (2009) Geo-graphical Information System (GIS) in Decision Support to Control Malaria—A Case Study of Koraput District in Orissa, India. Journal of Vector Borne Diseases, 46, 72-74.
[30] Srivastava, A., et al. (2004) Malaria Epidemicity of Mewat Region, District Gurgaon, Haryana, India: A GIS-Based Study. Current Science, 86, 1297-1303.
[31] Yadav, K., Nath, M.J., Talukdar, P.K., Saikia, P.K., Baruah, I. and Singh, L. (2012) Malaria Risk Areas of Udalguri District of Assam, India: A GIS-Based Study. Inter-national Journal of Geographical Information Science, 26, 123-131.
https://doi.org/10.1080/13658816.2011.576678
[32] Champion, H.G. and Seth, S.K. (1968) A Revised Survey of the Forest Types of In-dia. Government of India Press.
[33] Ernst, K.C., Lindblade, KA., Koech, D., Sumba, P.O., et al. (2009) Environmental, Socio-Demographic and Behavioural Determinants of Malaria Risk in the Western Kenyan Highlands: A Case-Control Study. Tropical Medicine & International Health, 14, 1258-1265. https://doi.org/10.1111/j.1365-3156.2009.02370.x
https://doi.org/10.1038/415710a
[35] Cohen, J.M., Ernst, K.C., Lindblade, K.A., Vulule, J.M., et al. (2008) Topogra-phy-Derived Wetness Indices Are Associated with Household-Level Malaria Risk in Two Communities in the Western Kenyan Highlands. Malaria Journal, 7, 40.
https://doi.org/10.1186/1475-2875-7-40
[36] Baig, M.H.A., Zhang, L., Shuai, T. and Tong, Q. (2014) Derivation of a Tasselled Cap Transformation Based on Landsat 8 at-Satellite Reflectance. Remote Sensing Letters, 5, 423-431. https://doi.org/10.1080/2150704X.2014.915434
[37] Narayani, P.K., Kumar, A., Singh, O.P., Carlton, J.M. and Nanda, N. (2014) A Re-view of Malaria Transmission Dynamics in Forest Ecosystems. Parasite and Vec-tors, 7, 265. https://doi.org/10.1186/1756-3305-7-265
[38] Kumar Ra, P., Singh Nathawat, M. and Onagh, M. (2012) Application of Multiple Linear Regression Model through GIS and Remote Sensing for Malaria Mapping in Varanasi District, India. Health Science Journal, 6, 731.
[39] Indian Water Portal. http://www.indiawaterportal.org/met_data/
[40] Atieli, H., et al. (2011) Topography as a Modifier of Breeding Habitats and Concur-rent Vulnerability to Malaria Risk in the Western Kenya Highlands. Parasites and Vectors, 4, 241. https://doi.org/10.1186/1756-3305-4-241
[41] Jin, X.M., et al. (2008) Impact of Elevation and Aspect on the Spatial Distribution of Vegetation in the Qilian Mountain Area with Remote Sensing Data. The Interna-tional Archives of the Photogrammetry, Remote Sensing and Spatial Information Sciences, XXXVII, 1385-1390.
[42] Rattanarithikul, R., Harrison, B.A., Panthusiri, P. and Coleman, R.E. (2005) Illu-strated Keys to the Mosquitoes of Thailand. I. Background; Geographic Distribu-tion; Lists of Genera, Subgenera, and Species; and a Key to the Genera. The South-east Asian Journal of Tropical Medicine and Public Health, 36, 1-80.
[43] Minakawa, N., Omukunda, E., Zhou, G., Githeko, A. and Yan, G. (2006) Malaria Vector Productivity in Relation to the Highland Environment in Kenya. The Amer-ican Journal of Tropical Medicine and Hygiene, 75, 448-453.
[44] Munga, S. (2006) Landscape Determinants and Remote Sensing of Mosquito Larva Habitats in the Islands of Kenya. Malaria Journal, 16, 5-13.
[45] Arega, D. (2009) Vulnerability Analysis and Malaria Risk Mapping in Awassa and Wondogenet Woredas. Thesis submitted to the school of Graduate studies of Addis Ababa University in Partial fulfillment of the requirements for the degree of Master of Science (M.Sc.) in Remote sensing and GIS.
[46] Ahmed, A. (2014) GIS and Remote Sensing for Malaria Risk Mapping, Ethiopia.
International Archives of the Photogrammetry, Remote Sensing and Spatial Infor-mation Sciences, XL-8, 155-161.
[47] Kreuels, B., et al. (2008) Spatial Variation of Malaria Incidences in Young Children from a Geographically Homogeneous Area with High Endemicity. The Journal of Infectious Diseases, 197, 85-93. https://doi.org/10.1086/524066
[48] Census 2011. http://www.censusindia.gov.in/2011-common/census_2011.html [49] Sundararajan, R., Kalkonde, Y., Gokhale, C., Greenough, P.G. and Bang, A. (2013)
Barriers to Malaria Control among Marginalized Tribal Communities: A Qualitative Study. PLoS ONE, 8, e81966. https://doi.org/10.1371/journal.pone.0081966
[51] Singh, N., Singh, O.P. and Sharma, V.P. (1996) Dynamics of Malaria Transmission in Forested and Deforested Region of Mandla District, Central India, Madhya Pra-desh. Journal of the American Mosquito Control Association, 12, 225-234. [52] Sharma, R.K., Thakor, H.G., Saha, K.B., Sonal, G.S., Dhariwa, A.C. and Singh, N.
(2015) Malaria Situation in India with Special Reference to Tribal Areas. Indian Journal of Medical Research, 141, 537-545.
[53] Rasania, S.K., Bhanot, A. and Sachdev, T.R. (2002) Awareness and Practices Re-garding Malaria of Catchment Population of a Primary Health Centre in Delhi. The Journal of Communicable Diseases, 34, 78-84.
[54] National Vector Borne Disease Control Programme, NVBDCP. Malaria Situation in India. Ministry of Health and Family Welfare, Government of India, Delhi.
http://nvbdcp.gov.in/maps.html
[55] Ray, A. (2015) Malaria Situational Analysis in India: The Case of Jharkhand State. Technical Report, Jhpiego, India.
[56] Agarwal, S.A., Sikarwar, S.S. and Sukumaran, D. (2012) Application of RS & GIS in Risk Area Assessment for Mosquito-Borne Diseases—A Case Study in a Part of Gwalior City (M.P.). International Journal of Advanced Technology & Engineering Research, 2, 1-4.
[57] Tripathi, N. and Bhattarya, S. (2004) Integrating Indigenous Knowledge and GIS for Participatory Natural Resource Management: State-of-the-Practice. The Electronic Journal of Information Systems in Developing Countries, 17, 1-13.
Submit or recommend next manuscript to SCIRP and we will provide best service for you:
Accepting pre-submission inquiries through Email, Facebook, LinkedIn, Twitter, etc. A wide selection of journals (inclusive of 9 subjects, more than 200 journals)
Providing 24-hour high-quality service User-friendly online submission system Fair and swift peer-review system
Efficient typesetting and proofreading procedure
Display of the result of downloads and visits, as well as the number of cited articles Maximum dissemination of your research work