Study of Human Serum Albumin Adsorption and
Conformational Change on DLC and Silicon Doped
DLC
Using XPS and FTIR Spectroscopy
Mukhtar H. Ahmed1*, John A. Byrne1, James McLaughlin1, Waqar Ahmed2
1Nanotechnology Integrated Bio-Engineering Centre, University of Ulster, Belfast, UK; 2Institute of Nanotechnology and Bioengi-
neering, University of Central Lancashire, Preston, UK. Email: *ahmed-m@email.ulster.ac.uk
Received January 20th, 2013; revised March 10th, 2013; accepted April 14th, 2013
Copyright © 2013 Mukhtar H. Ahmed et al. This is an open access article distributed under the Creative Commons Attribution Li- cense, which permits unrestricted use, distribution, and reproduction in any medium, provided the original work is properly cited.
ABSTRACT
Diamond-like carbon (DLC) coatings are extremely useful for creating biocompatible surfaces on medical implants. DLC and silicon doped DLC synthesised on silicon wafer substrate by using plasma enhanced chemical vapour deposi- tion (PECVD). The effects of surface morphology on the interaction of HSA with doped and undoped DLC films have been investigated. The chemical composition of the surface before and after adsorption was analysed using X-ray pho- toelectron spectroscopy (XPS) and Fourier transform infrared (FTIR). Results showed that silicon incorporation DLC tends to increase of sp3/sp2 hybridization ratio by decreasing sp2 hybridized carbon bonding configurations. Following
exposure to solutions containing (0.250 µg/ml) HSA, the results indicated that significant changes in the C, N and O levels on the surfaces with reducing of the Si2p band at 100 eV. From FTIR spectrum, the peaks occur the following functional groups were assigned as amide I and II groups at 1650 cm−1 and 1580 cm−1. Both XPS and FTIR spectros- copy confirm that HSA was bound onto the surfaces of the DLC and Si-DLC films via interaction of ionized carboxyl groups and the amino group did not play a significant role in the adsorption of protein. These results from peak intensity show that an adsorbed layer of HSA is higher at high level (19%) silicon doping. Therefore doping of DLC may provide an approach to controlling the protein adsorption.
Keywords: Diamond Like Carbon; Si-DLC; HAS; Adsorption; XPS; FTIR
1. Introduction
Analysing the interaction of proteins with the surfaces of materials intended for biomedical applications is funda- mental for understanding cellular events and the overall host response. Furthermore, the importance of a variety of molecules in the biomedical field is known for several applications, including drug delivery, biomaterials, extra- corporeal therapy and solid-phase diagnostics [1]
Both the nature of the biomaterial and the protein has effects on the adsorption process. The most significant surface properties of biomaterials, including the elemen- tal composition, functional groups and surface energy are very important. All of these parameters play a role in en- hancing or decreasing the adsorption of proteins or bio- logical compounds during the implant.
Diamond like carbon (DLC) is an ideal candidate for
use as biocompatible coatings on biomedical implants [2] such as coronary artery stents [3], artificial hearts, me- chanical heart valves [4], hip and knee replacements [5] and rotary blood pumps [6]. Furthermore DLC possess a unique combination of desirable properties including chemical inertness, high density, heamocompatibility and poor coefficient of friction [7].
Comparative studies improved doped DLC possesses better surface biocompatibility than the undoped counter- part [8]. Thus, to enhance the biocompatibility of DLC, the incorporation of third element dopants like nitrogen [9], fluorine [10], silicon [11] and titanium [12], may be necessary.
Silicon modification has been greatly applied in medi- cal devices and many investigations reported the chemi- cal stability of silicon doped DLC [13]. Silicon incorpo- ration into DLC has been proven to overcome some of the stated drawbacks, including low intrinsic compres-
sive stress, good adhesion, and mechanical resistance which are beneficial for biomedical applications [14,15]. Investigators have found an improvement in blood com- patibility with silicon doped DLC film where a decrease of inflammatory reactions was observed as compared to undoped DLC [16].
To improve the understanding of the fundamentals of protein adsorption, many protein adsorption-modelling approaches have been successfully used.
In this contribution, we explore the coating of silicon wafer substrate with DLC and silicon doped DLC thin films using plasma enhanced chemical vapour deposition (PECVD). The adsorption of human serum albumin (HSA) on these films is investigated, since its adsorption onto surgical instruments and medical devices is likely to do- minate in vivo due to its abundance in human serum. The physico-chemical properties of adsorption process were evaluated by different techniques using X-ray photoelec- tron spectroscopy (XPS) and Fourier Transform Infrared (FTIR).
The aim of this study is to illustrate the conformational changes in HSA upon attachment to DLC and Si-DLC surfaces, in order to improve our understanding of the dynamic phenomena in protein adsorption.
2. Experimental and Methods
2.1. Preparation and Modification of DLC
Before deposition of the films, silicon wafers 1.5 × 1.5 cm2 were cleaned gently and sonicated for 5 min in ace-
tone and isopropanol (1:1) followed by washing with dis- tilled water and then dried using nitrogen gas. Doped and undoped diamond like carbon (DLC) were deposited on cleaned substrates by the radio frequency (RF) 13.56 MHz Plasma Enhanced Chemical Vapour Deposition (PECVD) using a Diavac model 320PA (ACM Ltd.), with negative electrode self-bias voltages set at 400 Volt. The experi- mental equipment had been described previously in de- tails [17]. The clean substrates are placed in the deposi- tion chamber on top of a water-cooled electrode driven by an RF power supply.
When the chamber pressure reached ~5 × 10⁻⁶ Torr an
Argon gas flow rate of 60 mL/min was used for substrate surface cleaning. The films were prepared under the fol- lowing conditions: C2H2 was used as source gas; Argon
(Ar) and tetramethylsilane (TMS) (Si(CH3)4 [%99.8 Sigma-
Aldrech]) were used as dopant source. The argonacety- lene flow ratio (Ar to C2H2) was fixed at (10:20) standard
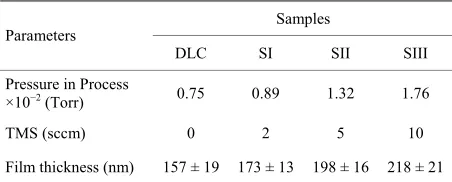
[image:2.595.310.536.122.213.2]cubic centimetre (sccm), and the deposition time was fixed for (5) minutes. To prepare the Si-DLC samples, the various doping concentrations of silicon were achieved using TMS, and a detail of the parameters is given in Ta- ble 1.
Table 1. The deposition conditions of DLC and Si-DLC sam- ples using rf-PECVD system.
Samples Parameters
DLC SI SII SIII
Pressure in Process
×10−2 (Torr) 0.75 0.89 1.32 1.76
TMS (sccm) 0 2 5 10
Film thickness (nm) 157 ± 19 173 ± 13 198 ± 16 218 ± 21
Bias voltage: 400 volt, deposition time: 5 minute, (TMS): Tetramethylsilane,
(sccm): standard centimetre cube per minute, Ar: C2H2 ratio: 10:20 (sccm),
(nm): nanometre, Initial chamber pressure: ~5 × 10⁻⁶
Torr, (±) is SD for n =
7 samples.
2.2. Adsorption of Human Serum Albumin (HSA) on DLC and Si-DLC Samples
Human serum albumin (HSA) [from Sigma Aldrich] was prepared in phosphate buffer saline (PBS) [from Sigma- Aldrich] to give solution having concentration of 250 µg/ml and the pH was adjusted at 7.4.
The prepared samples were immersed in the 10 ml of HSA solution (250 µg/ml) separately in sealed jars and incubated for 60 minute at 37˚C ± 1˚C using thermostatic shaker bath. After the period time, the samples were then washed twice with distilled water and dried using nitro- gen gas.
2.3. Surface Characterisation
XPS measurements were obtained using a KRATOS XSAM 800 equipped with an energy analyser. The X-ray source employed was Al Kα X-ray source (hv1486 eV) generated from aluminium anode operating at the emis- sion voltage at 15 keV and 5 mA. The base pressure wi- thin the spectrometer during examination was ~8 × 10⁻¹⁰
bar. All spectra were referenced by setting the hydrocar- bon C1s peak to 285.0 eV to compensate for residual charging effects.
The film thickness of the prepared samples was ob- tained using a stylus profilometer (Dektak 8 Advanced Stylus Profiler Veeco Instruments Inc., USA). Automatic levelling was selected and system based software per- formed average step height calculations.
The chemical bonding configurations were character- ized by Fourier transform infrared spectroscopy FTIR at room temperature using BIORAD Excalibur (FTS 3000 MX series) instrument, to investigate the various chemi- cal vibrational modes the spectrum was recorded in the region of 4000 - 400 cm−1 and 60 scans were accumu-
lated at a resolution of 4 cm−1. In all of the FTIR experi-
this signature was subsequently removed from the sam- ple scan. The subsequent analysis of the attached HSA on the DLC and Si-DLC samples was performed.
3. Results and Discussion
3.1. Surface Characterisation of Prepared Samples
The film thicknesses of DLC and Si-DLC samples have been obtained and the values were arranged from ~(157 - 218) nm, the growth rate of film deposition was around (38 ± 6) nm·min−1 (
[image:3.595.148.444.468.718.2]Table 1).
Figure 1 shows the survey scan of XPS spectra of
doped and undoped DLC. The main peaks were observed at ~285.1 eV, and ~531.4 eV, corresponding to C1s and O1s, bands, respectively. The addition peak was revealed at 100.7 eV [in case of silicon doped DLC] which attrib- uted to Si2p.
C1s spectrum of DLC has been deconvoluted in to three different peaks. The first band located at 284.7 eV, is related to the sp2 hybridized carbon (C=C). A band at
285.3 eV, is corresponded to a sp3 carbon (C-C), and last
peak was obtained at 287.4 eV, can be related to the (CO) bonds (Figure 2). The carbon atom percentage in the
DLC is determined as 86.70% (Table 2).
It has been observed that the presence of silicon in the film affected the binding energy by causing a slight low- ering in the energy accompanied by a broadening of the C1s peaks with FWHM of 2.5 eV, which increased with increasing silicon concentration in the films. The C1s
spectrum of Si-DLC yielded four deconvoluted peaks; at 283.9 eV [Si-C], 284.7 eV [C=C], 285.3 eV [C-C], 287.3 eV [CO] [18]. On the other hand, the intensity of both Si-C and C-C increased with increasing the silicon con- centration in the films, the results agree with those ob- tained by Zhao et al. [19].
The properties of the DLC thin films depend mainly on its structure resulting from combination of sp3 bond-
ing (Diamond form) and sp2 (graphite form). The sp3 to
sp2 ratio is dependent on the deposition process and its
parameters. The incorporation of silicon into DLC leads to the decrease of C=C (Sp2) bonded with increase of
C-Si contribution, while the amount of the C-C bonding (sp3) remained relatively unaltered. The results show that
silicon atoms preferentially substitute the sp2 hybridized
carbon atoms during film formation. Then one may con- clude that silicon content can increase the sp3/sp2 ratio in
the film (Figure 3). This tends to improve the compati-
bility of the implant with blood components [20].
The XPS O1s spectra of DLC and Si-DLC samples were located at ~531 eV (Figure 4). Deconvolution of
the O1s band gave two sub peaks around 531 eV and 532 eV, which are attributed to (C=O) and (C-O) bond in the film structure, respectively.
The results of the XPS analysis of the O1s region of the Si-DLC samples showed that the oxygen concentra- tion in the films increases with increasing silicon flow rate, (Table 2). The obtained results are in good agree-
ment with those provided previously determined values [11].
700 600 500 400 300 200 100 0
DLC
SI
SIII
SII
Binding energy (eV)
C1s
O1
s
Inte
ns
ity
(a
/u)
Si
2
p
282 284
286 288
290 292
Binding energy (eV)
C=C
C-C
CO C1s of DLC
Intensity
(c
ps
)
292 290 288 286 284 282
Inte
nsity (cps)
Binding Energy (eV)
SI SII SIII
[image:4.595.61.537.96.287.2]C-Si C=C C-C CO
[image:4.595.58.540.326.616.2]Figure 2. XPS C1s spectra deconvolution of DLC and Si-DLC samples.
Table 2. XPS survey data (atomic percentage) for the elements on to surface of samples before and after adsorption of HAS.
Before adsorption of HSA After adsorption of HSA
Samples Peak designation
Band (eV) At. % Conc. FWHM (eV) Band (eV) At. % Conc. FWHM (eV)
C1s 285.1 86.7 1.5 284.9 62.5 2.0
O1s 531.4 13.3 2.4 532.1 32.6 2.2
DLC
N1s 399.7 4.9 1.9
C1s 284.9 81.9 1.8 285.0 62.7 2.1
O 1s 532.1 13.7 2.3 532.0 31.9 2.1
Si2p 100.7 4.4 1.6
SI
N1s 399.5 5.4 2.2
C1s 284.9 76.3 2.1 284.9 62.1 2.3
O1s 532.4 14.1 2.2 531.9 32.7 2.0
Si2p 100.3 9.6 2.2
SII
N1s 399.8 5.2 2.1
C1s 284.7 68.5 2.5 284.7 62.0 2.3
O1s 531.7 14.7 2.1 532.0 32.5 2.1
Si2p 100.4 16.8 3.0
SIII
N1s 399.8 5.5 2.2
On the other hand, the band related to silicon atom (Si2p) appeared at around 101 eV. The fitted band of Si2p gives two sub-peaks centred at 100.6 eV and 102.3 eV can be assigned to Si-C and Si-O bonds, respectively. The quantitative analysis of atomic percentage of silicon content DLC gives 4.4, 9.6 and 16.8 for SI, SII and SIII, respectively (Table 2).
Figure 5 shows the FTIR spectrum of doped and un-
doped DLC samples. Bands located at around 1450 cm−1
and 896 cm−1 are assigned to the stretching and bending
of C-C sp3 hybridization respectively, and a medium
band at 1210 cm−1 can also be assigned to the sp3 bond of
carbon hybridisation [21]. This indicates the formation of tetrahedral carbon structures in the DLC films and the inclusion of hydrogen. The peak at ~727 cm−1 belongs to
the out of plane bending configuration of the graphite like carbon [22]. A weak peak at 1624 cm−1 is assigned
0 3 6 9 12 15 18
0.55 0.60 0.65 0.70 0.75 0.80
SP
3 /S
P
2
[image:5.595.161.438.96.310.2]Atomic % of Silicon content DLC sp3/sp2
Figure 3. sp3/sp2 ratio in relation to atomic present of silicon content DLC.
528 530
532 534
536
Inte
ns
ity(c
ount/s
ec
ond)
Binding Energy(eV)
DLC SI SII SIII
C=O C-O
O 1s
97.5 100.0
102.5 105.0
107.5
In
ten
sit
y (
cps)
Binding energy (eV) SI
SII SIII
Si-O Si-C
[image:5.595.77.517.335.717.2]Si 2p
Figure 4. The XPS O1s and Si2p spectra of deposited samples.
500 750 1000 1250 1500 1750 2000 0.04
0.08 0.12 0.16
C-C
C=
C
Ab
so
rb
an
ce (a.
u)
wavenumber (cm-1)
C-C
C=C
C=
O
(A)
───DLC
500 750 1000 1250 1500 1750 2000
0.0 0.2 0.4
Si
-C
Ab
so
rb
ance (
a.u
)
Wavenumber (cm-1)
Si
-C
Si
-CH
2
-S
i
C=C
C-C
(B)
bands at 905 cm−1 and 1192 cm−1 which is return to the
C-C bonds, too. For Si- DLC samples, the bands have been detected at 880 cm−1, attributed to the Si-CH bond
[23]. in addition, the deformation vibration of Si-CH3
bond was observed at 1263 cm−1 and a band appeared at
around 1359 cm−1 suggested the presence of stretching
vibration of Si-CH2- Si bonds. The results are agree with
those achieved by Finer et al. [24].
3.2. Characteriztion of Surfaces after HSA Adsorption
XPS was used to investigate the chemical surface com- position during the HSA adsorption. The survey scan XPS spectrum of adsorbed HSA on the DLC and Si-DLC surfaces is presented in Figure 6. The results showed
that a new signal at 400 eV has observed is assigned to N1s band, and the C1s band intensity was significantly changed, along with a reduction in the Si2p intensity (in case of Si-DLC). Furthermore, a weak band was detected at 164.1 eV in the high-resolution analysis of the S2p which can be attributed to sulphur atoms in cysteine amino acid [25]. These data indicate the presence of the protein on the surfaces [26].
High resolution analysis of the C1s peak after adsorp- tion of protein was quite different from the samples prior to protein adsorption. The deconvolution of the C1s peak gave four different bands. The first component located at ~285.2 eV which assigned to saturated and unsaturated hydrocarbon groups. A peak at 286.7 eV is related to C-NH amine groups and the last peak detected at around 288.4 eV is for the peptide bond HN-C=O, (Figure 7).
After peak fitting of the N1s core-level spectrum, three
deconvoluted peaks were observed at 399.7 eV (73%), is attributed to (C-N), a peak showed at 401.7 eV (19%) as- signed to N-C=O and N-H bonded [27], and the third band was appeared at 402.8 eV (8%) is returned to posi- tively charged amines (NH3
). The
3 component of
N1s spectrum of Si-DLC samples shifts to a higher bind- ing energy with a slight increase in band area, compared to the same band in undoped DLC. This might evidence that the HSA was adsorbed on to surfaces via carboxylic acid group [17].
NH
The O1s band after protein adsorption is similar to that without protein, suggesting that the most of the signal is attributable to carbon oxides and surface OH groups (Fig- ure 7). The amount of protein adsorbed onto a surface,
can be related to the intensity of C1s peak. Hence, based on the C1s intensity, the relative amount of adsorbed HSA increases with increasing silicon doped DLC. There- fore, doping of DLC may allow control of protein ad- sorption to the surface.
Fourier Transform Infrared (FTIR)
FTIR spectroscopy can be used for identification of the functional group and showing different vibrational modes of various bonds which are present in the film.
Figure 8 shows the FTIR spectrum of free and bounded
HSA on to surface of coated DLC. The bands centred at around 1650 cm−1 and 1550 cm−1, which correspond to
amide I and amide II, respectively. The location of both the Amide bond orientation are sensitive to the secondary structure of a protein, because both groups of C=O and the N-H bonds are involved in the hydrogen bonding that takes place between the different elements of secondary
700 600 500 400 300 200 100 0
(A)
(B)
(D)
(C)
Binding energy (eV)
C1
s
O1s
Int
ensit
y (a
/u
)
Si2
p
N1s
S2p
[image:6.595.158.437.498.717.2]294 292 290 288 286 284 282 C 1s HSA on Si-DLC
In
tensity (
cps)
Binding energy (eV)
E
C-C C=C
C-NH
O=
C-NH
(A)
410 408 406 404 402 400 398 396
Int
e
nsi
ty (cps)
Binding energy (eV)
N1s of HSA on SIII
C-N
HN-CO N-H NH3+
(B)
536 534 532 530 528 526
Inten
s
ity
(c
ps)
Binding energy (eV)
B
C=O C-O
[image:7.595.62.521.88.500.2](C)
Figure 7. The XPS C1s (A), N1s (B) and O1s (C) spectra for adsorbed HSA onto DLC and Si-DLC.
structure [28]. The Amide I band of free HSA, is located at 1650 cm−1, whilst in case of adsorbed HSA onto doped
DLC, the same band observed at around 1641 cm−1. A
quantitative analysis of the amide I region can be esti- mated by curve fitting confirms the gradual evolution in the secondary structure content.
To investigate changes in the secondary structure of HSA after it is conjugated to the coated DLC surface, the deconvulation and second derivative of amide I band has been applied. Spectral deconvolution resolved four peaks for the amide I band for the free HSA, (Figure 9). A
band located at 1612 cm−1 which is correlated to aroma-
tic rings. The second component was seen at 1629 cm−1
and can be attributed to β-sheet structure [29]. Band at around 1663 cm−1 is related to α-helix [30], and the last
fitted peak detected at 1675 cm−1 which is return to anti-
parallel β-sheets components [31]. The quantitative ana-
lysis of the amide I spectra of free HSA peptide indicates that there is more than 57% of α-helix and ~17% of β- sheet conformation (Table 3). The obtained results are in
good agreement with the data reported by Bouhekka et al.
[32].
Whilst the deconvulated of the same band after ad- sorption of HSA on to surface of samples, gives five sec- ondary peaks at ~1611 cm−1 (aromatic ring), ~1630 cm−1
(β-sheet), 1644 cm−1 (random coil), 1664 cm−1 (α-helix)
and ~1679 cm−1 (β-sheet anti parallel). The β-sheet is
slightly increased from (17% to ~25%). Furthermore, a decrease in α-helical contribution is observed from (57% to 45%) (Figure 9). These could be attributable to the en-
hancing of HSA aggregation on to surfaces. The results are similar to those obtained by Khan et al. [33].
1000 1200 1400 1600 1800 2000
Abs
o
rban
ce
(a.u)
Wavenomber (cm-1)
(E)
amide I
I
(A) (B) (C) (D)
amid
[image:8.595.66.279.98.348.2]e I
Figure 8. FTIR Spectra of HSA before (A) and after ad- sorbed on DLC (B), SI (C), SII (D) and SIII (E) surfaces.
the potential energy emerges from the C-N(20 - 40)% and C-C about 10% stretching vibrations [34]. In case of free HSA, the amide II shows a maximum of absorbance that shifts from 1559 cm−1 to lower wavenumbers (1553
cm−1) upon HSA adsorption onto DLC-coated surfaces.
This shift can be correlated to the change of protein con- formation during the adsorption [35]. In all these proc- esses a hydrogen bond plays a dominant role in deciding the structure of the aggregate [36].
4. Conclusions
The results indicated that DLC films are established to consist of a mixture of tetrahedral (sp3) and trigonal (sp2)
bonding. XPS data showed that the sp3/sp2 ratio increases
with increasing silicon concentration in the DLC film. Furthermore, FTIR analysis showed that silicon incorpo- ration DLC gives rise to the formation of Si-C bond, which tends to increase in the fraction of sp3 bonded
carbon in DLC film.
Followed by exposure to protein, a new band of nitro- gen (N1s) appeared at the XPS spectra of the doped and undoped DLC surfaces. As well as a specific broad peak was observed at ~288.4 eV could be assigned to peptide
1600 1620 1640 1660 1680 1700 1720 1740
0.00 0.02 0.04 0.06 0.08
Abs
orpt
ion (a
.u)
Wavelength (cm-1)
data4 C
-h
elix
sh
eet
ar
omat
ic r
ing
an
tipa
ral
le
l
sh
eet
(A)
1600 1620 1640 1660 1680 1700 1720
0.00 0.02 0.04
Abs
o
rba
n
ce
(a.u)
Wavelength (cm-1)
amide I of HSA after adsorption on to Si-DLC surfaces
-shee
t
randum c
oil
-he
li
x
anti
pa
ra
lle
l
-s
heet
ar
om
at
ic r
in
g
[image:8.595.62.536.392.583.2](B)
Figure 9. Curve-fitting analysis of the amide I in FTIR; for free HSA (A) and adsorbed on SIII (B).
Table 3. FTIR analysis of the amide I band of free and adsorbed HSA onto DLC and Si-DLC samples.
Free HSA HSA adsorbed on DLC HSA adsorbed on SIII
Amide I bands
(cm−1) Band % (cm−1) Band % (cm−1) Band %
Aromatic 1612 13.74 1611 12.42 1609 11.83
β-sheet 1629 17.86 1631 25.82 1633 26.91
Random coil 1644 7.1 1645 8.3
α-helix 1663 57.86 1664 45.52 1662 44. 3
β-sheet anti parallel 1675 10.54 1679 9.14 1681 8.66
[image:8.595.58.541.628.734.2]bond. In addition of, the presence of protonated amino groups ( 3) at 402.6 eV, this might suggesting that
HSA bounded on the surfaces through the carboxyl group and the amino group has not interact strongly with the surface.
NH
FTIR spectra revealed the presence of amide I and II at 1650 cm−1 and 1559 cm−1 belonging to protein. The re-
sults also suggested that relatively the adsorbed amount of HSA increased with increasing of silicon content on the DLC film. The presence studies have revealed that modifying the surface of DLC by incorporation of silicon can improve its biocompatibility of the implant; however, further studies are required to obtain a better understand- ing of protein adsorption in vivo.
5. Acknowledgements
The authors would like to thank all of the staff at North- ern Ireland Bio-Engineering Centre (NIBEC), University of Ulster for their support, and also thanks to Sandra Adamson at LG, for her technical assistance.
REFERENCES
[1] C. M. Alves, R. L. Reis and J. A. Hunt, “The Competitive Adsorption of Human Proteins onto Natural-Based Bio- materials,” Journal of the Royal Society Interface, Vol.7, No. 50, 2010, pp. 1367-1377. doi:10.1098/rsif.2010.0022 [2] T. Hasebe, A. Hotta, H. Kodama, A. Kamijo, K. Takaha-
shi and T. Suzuki, “Recent Advances in Diamond-Like Carbon Films in the Medical and Food Packing Fields,”
New Diamond and Fornier Carbon Technology, Vol. 17, No. 6, 2007, pp. 263-279.
[3] H. W. Choi, R. H. Dauskardt, S. C. Lee, K. R. Lee and K. H. Oh, “Characteristic of Silver Doped DLC Films on Surface Properties and Protein Adsorption,” Diamond & Related Materials, Vol. 17, No. 3, 2008, pp. 252-257. doi:10.1016/j.diamond.2007.12.034
[4] D. Grimanelis, S. Yang, O. Bohme, E. Roman, A. Alberdi, D. G. Teer and J. M. Albella, “Carbon Based Coating for High Temperature Cutting Tools,” Applications, Diamond and Related Materials, Vol. 11, No. 2, 2002, pp. 176-184. doi:10.1016/S0925-9635(01)00566-0
[5] J. I. Onate, M. Comin, I. Braceras, A. Garcia, J. L. Vivi- ente, M. Brizuela, N. Garagorri, J. L. Perisb and J. I. Alava, “Wear Reduction Effect on Ultra-High-Molecular- Weight Polyethylene by Application of Hard Coatings and Ion Implantation on Cobalt Chromium Alloy, as Mea- sured in a Knee Wear Simulation Machine,” Surface Coatings Technology, Vol. 142-144, 2001, pp. 1056-1062. doi:10.1016/S0257-8972(01)01074-X
[6] A. Alanazi, C. Nojiri, T. Kido, T. Noguchi, Y. Ohgoe, T. Matsuda, K. Hirakuri, A. Funakubo, K. Sakai and Y. Fu- kui, “Engineering Analysis of Diamond-Like Carbon Coated Polymeric Materials for Biomedical Applications,” Arti- ficial Organs, Vol.24, No. 8, 2000, pp. 624-627. doi:10.1046/j.1525-1594.2000.06576.x
[7] R. K. Roy, H. W. Choi, J. W. Yi, M. W. Moon, K. R. Lee, D. K. Han, J. H. Shin, A. Kamijo and T. Hasebe, “Hemo- compatibility of Surface-Modified, Silicon-Incorporated, Diamond-Like Carbon Films,” Acta Biomaterialia, Vol. 5, No. 1, 2009, Article ID: 249256.
doi:10.1016/j.actbio.2008.07.031
[8] S. C. H. Kwok, W. Zhang, G. J. Wan, D. R. McKenzie,
M. M. M. Bilek and P. K. Chu, “Hemocompatibility and Anti-Bacterial Properties of Silver Doped Diamond-Like Carbon Prepared by Pulsed Filtered Cathodic Vacuum Arc Deposition,” Diamond & Related Materials, Vol. 16, No. 4-7, 2007, pp. 1353-1360.
doi:10.1016/j.diamond.2006.11.001
[9] M. H. Ahmed and J. A. Byrne, “Effect of Surface Struc- ture and Wettability of DLC and N-DLC Thin Films on Adsorption of Glycine,” Applied Surface Science, Vol. 258, No. 12, 2012, pp. 5166-5174.
doi:10.1016/j.apsusc.2012.01.162
[10] M. H. Ahmed, J. A. Byrne and J. McLaughlin, “Evalua- tion of Glycine Adsorption on Diamond Like Carbon (DLC) and Fluorinated DLC Deposited by Plasma-En- hanced Chemical Vapour Deposition (PECVD),” Surface & Coatings Technology, Vol. 209, 2012, pp. 8-14. doi:10.1016/j.surfcoat.2012.07.011
[11] M. Ahmed, A. J. Byrne, J. McLaughlin, A. Elhissi, D. A. Phoenix and W. Ahmed, “Vibrational and AFM Studies of Adsorption of Glycine on DLC and Silicon-Doped DLC,” Journal of Materials Science, Vol. 47, No. 4, 2012, pp. 1729-1736. doi:10.1007/s10853-011-5952-3
[12] C. Liu, G. Q. Li, W. X. Chen, Z. X. Mu, C. W. Zhang and L. Wang, “The Study of Doped DLC Films by Ti Ion Im- plantation,” Thin Solid Films, Vol. 475, No. 1-2, 2005, pp. 279-282. doi:10.1016/j.tsf.2004.08.051
[13] G. H. Hsiue, S. D. Lee, P. C. T. Chang and C. Y. Kao, “Surface Characterization and Biological Properties Study of Silicone Rubber Membrane Grafted with Phospholipid as Biomaterial via Plasma Induced Graft Copolymeriza- tion,” Journal of Biomedical Materials Research, Vol. 42, No. 1, 1998, pp. 134-147.
doi:10.1002/(SICI)1097-4636(199810)42:1<134::AID-JB M17>3.0.CO;2-L
[14] J. C. Damasceno, S. S. Camargo Jr., F. L. Freire Jr. and R. Carius, “Deposition of Si-DLC Films with High Hardness, Low Stress and High Deposition Rates,” Surface and Coatings Technology, Vol. 133-134, 2000, pp. 247-252. doi:10.1016/S0257-8972(00)00932-4
[15] N. Moolsradoo, S. Abe and S. Watanabe, “Thermal Stbil-ity and Tribological Performance of DLC-SiO Films,”
Advances in Materials Science and Engineering, Vol. 2011, 2011, ArticleID: 483437.
[16] S. Kelly, E. M. Regan, J. B. Uney, A. D. Dick, J. P. McGeehan, E. J. Mayer and F. Claeyssens, “Patterned Growth of Neuronal Cells on Modified Diamond-Like Carbon Substrates,” Biomaterials, Vol. 29, No. 24-25, 2008, pp. 2573-2580.
doi:10.1016/j.biomaterials.2008.03.001
Studied by XPS and AFM,” e-Journal of Surface Science and Nanotechnology, Vol. 7, 2009, pp. 217-224. doi:10.1380/ejssnt.2009.217
[18] A. Bendavid, P. J. Martin, C. Comte, E. W. Preston, A. J. Haq, F. S. M. Ismail and R. K. Singh, “The Mechanical And Biocompatibility Properties of DLC-Si Films Pre- pared by Pulsed DC Plasma Activated Chemical Vapor Deposition,” Diamond & Related Materials, Vol. 16, No. 8, 2007, pp. 1616-1622.
doi:10.1016/j.diamond.2007.02.006
[19] Q. Zhao, Y. Liu, C. Wang and S. Wang, “Bacterial Adhe- sion on Silicon-Doped Diamond-Like Carbon Films,” Dia- mond and Related Materials, Vol. 16, No. 8, 2007, pp. 1682-1687. doi:10.1016/j.diamond.2007.03.002
[20] R. K. Roy, S. J. Park, H. W. Choi1, K. R. Lee, J. H. Kim, D. K. Han, J. H. Shin, H. G. Kim, S. H. Ahn, J. G. Kim, S. J. Park and K. R. Lee, “Hemocompatibility of Surface Mo- dified Si Incorporated Diamond-Like Carbon Films,” Thin Solid Films, Vol. 482, 2005, pp. 299-304.
[21] R. Paul, S. N. Das, S. Dalui, R. N. Gayen, R. K. Roy, R. Bhar and A. K. Pal, “Synthesis of DLC Films with Dif- ferent sp2/sp3 Ratios and Their Hydrophobic Behaviour,” Journal of Physics D: Applied Physics, Vol. 41, No. 5, 2008, Article ID: 055309.
doi:10.1088/0022-3727/41/5/055309
[22] W. J. Hsieh, P. S. Shih, C. C. Lin, C. Y. Wang and H. C. Shi, “Structure and Optical Property of the a-C:N Films Synthesized by Filtered Cathode Vacuum Arc,” Surface and Coatings Technology, Vol. 200, No. 10, 2006, pp. 3175-3178. doi:10.1016/j.surfcoat.2005.07.038
[23] M. N. Huda, Y. Yan and M. M. Al-Jassim, “On the Exis- tence of Si-C Double Bonded Graphene-Like Layers,”
Chemical Physics Letters, Vol. 479, No. 4-6, 2009, pp. 255-258. doi:10.1016/j.cplett.2009.08.028
[24] N. Fainer, Y. Rumyantsev, M. Kosinova, E. Maximovski, V. Kesler, V. Kirienko and F. Kuznetsov, “Low-k Dielec- trics on Base of Silicon Carbon Nitride Films,” Surface and Coatings Technology, Vol. 201, No. 22, 2007, pp. 9269-9274. doi:10.1016/j.surfcoat.2007.04.046
[25] H. Yoneyama and T. Torimoto, “Titanium Dioxide/Ad- sorbent Hybrid Photocatalysts for Photodestruction of Or- ganic Substances of Dilute Concentrations,” Catalysis Today, Vol. 58, No. 2-3, 2000, pp. 133-140.
[26] T. Kesvatera, B. Jonsson, A. Telling, V. Tougu, H. V. E. Thulin and S. Linse, “A Protein Optimized for Calcium Binding at Neutral pH,” Biochemistry, Vol. 40, No. 50, 2001, pp. 15334-15340.
[27] H. J. Kim, I.-S. Bae, S.-J. Cho, J.-H. Boo, B.-C. Lee, J. Heo, I. Chung and B. Hong, “Synthesis and Characteris- tics of NH2-Functionalized Polymer Films to Align and
Immobilize DNA Molecules N-Containing Moieties Could Be Useful,” Nanoscale Research Letters, Vol. 7, 2012, pp. 30-37. doi:10.1186/1556-276X-7-30
[28] M. Bouchard, J. Zurdo, E. J. Nettleton, C. M. Dobson, and C. V. Robinson, “Formation of Insulin Amyloid Fi- brils Followed by FTIR Simultaneously with CD and Electron Microscopy,” Protein Science, Vol. 9, No. 10, 2000, pp. 1960-1967. doi:10.1110/ps.9.10.1960
[29] M. Jackson and H. H. Mantsch, “The Use and Misuse of FTIR Spectroscopy in the Determination of Protein Struc- ture,” Critical Reviews in Biochemistry and Molecular Biology, Vol. 30, No. 2, 1995, pp. 95-120.
doi:10.3109/10409239509085140
[30] K. L. Munro, K. R. Bambery, E. A. Carter, L. Puskar, M. J. Tobin, B. R. Wood and C. T. Dillon, “ Synchrotron Ra- diation Infrared Microspectroscopy of Arsenic-Induced Changes to Intracellular Biomolecules in Live Leukaemia Cells,” Vibrational Spectroscopy, Vol. 53, No. 1, 2010, pp. 39-44 . doi:10.1016/j.vibspec.2010.02.004
[31] C. Chadefaux, A.-S. L. Ho, L. Bellot-Gurlet and I. Reiche, “Curve-Fitting Micro-ATR-FTIR Studies of the Amide I and II Bands of Type I Collagen Archaeological Bone Materials,” e-Preservation Science, Vol. 6, 2009, pp. 129-137.
[32] A. Bouhekka and T. Burgi, “In Situ ATR-IR Spectros- copy Study of Adsorbed Protein: Visible Light Denatura- tion of Bovine Serum Albumin on TiO2,” Applied Surface Science, Vol. 261, 2012, pp. 369-374.
doi:10.1016/j.apsusc.2012.08.017
[33] M. W. Khan, Z. Rasheed, W. A. Khan and R. Ali, “Bio- chemical, Biophysical, and Thermodynamic Analysis of
in Vitro Glycated Human Serum Albumin,” Biochemistry
(Moscow),Vol. 72, No. 2, 2007, pp. 146-152. doi:10.1134/S0006297907020034
[34] M. L. Gulrajani, K. P. Brahma, P. S. Kumar and R. Pur- war, “Application of Silk Sericin to Polyester Fabric,”
Journal of Applied Polymer Science, Vol. 109, No. 1, 2008, pp. 314-321. doi:10.1002/app.28061
[35] M. Dumitrascu, V. Meltzer, E. Sima, M. Virgolici, M. G. Albu, A. Ficai, V. Moise, R. Minea, C. Vancea, A. Scari- soreanu and F. Scarlat, “Characterization of Electron Beam Irradiated Collagen-Polyprolidone (PVP) and Collagen- Dexran (DEX) Blends,” Digest Journal of Nanomaterials and Biostructures, Vol. 6, 2011, pp. 1793-1803.