A Closed Model of the Universe
Fadel A. Bukhari
Department of Astronomy, Faculty of Science, King Abdulaziz University, Jeddah, Saudi Arabia Email: flbukhari@hotmail.com
Received January 3, 2013; revised February 5, 2013; accepted February 13, 2013
Copyright © 2013 Fadel A. Bukhari. This is an open access article distributed under the Creative Commons Attribution License, which permits unrestricted use, distribution, and reproduction in any medium, provided the original work is properly cited.
ABSTRACT
A closed model of the universe was constructed according to the assumption that very minor fraction of the dark energy transfers so slowly to matter and radiation. The cosmological parameter is no longer fixed but represents so slowly decreasing function with time. In this model the universe expands to maximum limit at tme = 26.81253Gyr, then it will
contract to a big crunch at tbc = 53.6251 Gyr. Observational tests to the closed cosmic model were illustrated.
Distributions of the universe expansion and contraction speed were established in this model which indicated that the expansion speed in the early universe is appreciably high, then it will decrease rapidly until it vanishes at tme. However, the contraction speed of the universe increases continuously until the time just before tbc. Distributions of the universe expansion and contraction acceleration were performed empirically which confirmed the previous result. In the closed cosmic model the universe history can be categorized into six main stages, these are the first radiation epoch, the first matter epoch, the first dark energy epoch, the last dark energy epoch, the last matter epoch and the last radiation epoch. Distributions of the density parameters of the radiation, matter, dark energy and the total density as well as the distributions of temperature of the radiation and non-relativistic matter were all investigated in this model at all epochs of the universe.
Keywords: Cosmological Parameter; Cosmology; Cosmic Dynamics
1. Introduction
In pervious two articles [1,2] the cosmological parameter
was assumed constant in five general cosmic models.
However, in some cosmological studies is not ac-
tually perfectly constant but exhibits slow variation, so
is often described as quintessence [3-6]. In other words,
the dark energy density
4
8π
c G
does not remain
constant with time.
This point of view is in a good agreement with the Heisenberg’s Uncertainty Principle that there is an uncertainty in the amount of energy which can exist. This
small uncertainty allows non-zero energy E to exist
for short intervals of time t h 2π ,
E
where h is
Planck’s constant
6.626 10 14 m Kg s2 1
.As a result of the equivalence between matter and energy, these small energy fluctuations can produce vir- tual pairs of matter particles (particles and their anti- particles must be produced simultaneously) which come into existence for a short time and then disappear to pro- duce photons.
In the present study is assumed to be very slowly
decreasing function of the cosmic time t such that any
decrease in 2
c
say ,
2 t
c
should be compensated
by increasing each of the matter density m t, and radi-
ation density ,
2
r t c
by 1 2, .
2 t
c
The importance of this study is to know under what cosmological conditions the universe can be contracting to big crunch rather than expanding for ever as shown in the five general cosmic models investigated in [1].
In Section 2, a detailed description is given for the me- thodology. Determination of tme is explained in Section 3. Observational tests of the closed cosmic model are il- lustrated in Section 4. Results and discussion are presen- ted in Section 5. Finally the conclusion is displaced in Section 6.
2. Methodology
t are given by
, , ,.
m t c tm t
(1)
, , ,.
r t c tr t
ò (2)
,t c t, ,t.
ò (3) where 2 , 3 . 8π c t H G
(4)
2 2
2
, ,
3 .
8π
c t c t
H c
c G
ò (5)
2 ,0 0
, 3 .
m m t H H a
(6)
2 ,0 0
, 4 .
r r t H H a
(7)
2 0
,t ,0.
H H
(8)
0
2
,0 ,0
1 2
,0 2
1
1 1 1
1 1 .
m
r
H
H t a
a a a (9)
Substituting by (4), (6) in (1) we get 2 ,0 0 , 3 3 8π m m t H G a Or, ,0
, ,0 3 .
m
m t c
a
(10)
Similarly we can find
, ,0
,0
2 4 .
r t r
c
c a
(11)
, ,0 ,0 2 constant. t c c
(12)
Now assume a very small decrease in 2,t
c
about
1% per Gyr, so the decrease in 2,t c
in cosmic time
t is expressed as
, ,
2 0.01 2 .
t t t c c (13)
According to the conservation law of mass and energy
the decrease ,
2 t c
in the energy density ,
2
t
c
is
compensated by increase of ,
2 1 2 t c
in each of m t,,
and ,
2 .
r t
c
Therefore at the cosmic time t the new values of
, , 2 , t m t c
and r t2,
c
are given by
, ,
,0 ,0
2 2 .
t t c c c
(14)
,0 ,
, ,0 3 2
1
. 2
m t
m t c
a c
(15)
, ,0 ,
,0
2 4 2
1 .
2
r t r t
c
c a c
(16)
The slowly varying cosmological parameter is
, 4 8π . t G t c (17)
Using Equations (1)-(5) and (14)-(16) the new values of density parameters in the expanding cosmic model at time t are
, , 2 , . t t c t c
(18)
, , , . m t m t c t
(19)
, , 2 , . r t r t c t c
(20)
Let
0
H t s
H
then Equations (6)-(8) can be written as
2 3
,0 ,.
m s a m t
(21)
2 4
,0 ,.
r s a r t
(22)
2
,0 s ,t.
(23)
Substituting by (21)-(23) in (9) and using (18)-(20) we get the Hubble parameter in the closed cosmic model at time t
0 2
2
2 3, ,
1 2 2 4
, 2
1
1 1 1
1 1
t m t
r t
H
H t s a s a
2 2 2 2 3
0
, ,
1 2
2 2 4
,
1 1
.
t m t
r t H
H t s a s a a
a
s a a
(24)
The critical mass density in the closed cosmic model at
time t becomes
2 , 3 . 8π c t H t G (25)
The new density parameters in the closed cosmic mo- del at time t are
, , 2 , . t t c t c
(26)
, , , . m t m t c t
(27)
, , 2 , . r t r t c t c
(28) And the total density parameter in the closed cosmic model at time t is
t r t, m t, ,t.
(29) The speed of the universe dynamics in the closed cos- mic model is obtained from Equation (24) such that
a t H t a
or,
2 2 2 2 3
0 , ,
1 2
2 2 4
,
1 1
.
t m t
r t
a t H s a s a a
s a a
(30)
The acceleration of the universe dynamics in the clo- sed cosmic model is found empirically as
lim0
.t a t a t t
(31)
The time interval between two instants with scale fac- tors a a1, 2 during the universe expansion is given by Equation (16) in [1] as
2 1
2
2 1 ,0 ,0
0
1 2
,0 2
1 1
1 1 1
1 1 d .
a
m a
r
t t a
H a a a
(32)However, during the universe contraction if a2 < a1 then modulus of the right hand side of Equation (32)
should be taken. The redshift lookback time relation in
the closed cosmic model is given by Equation (18) in [1]. In addition, the distributions of temperature at different epochs of the universe depend on relations similar to Equations (33), (34) and (37) in [1].
3. Determination of
t
meThe time of the maximum expansion of the universe in the closed model is evaluated by iterative procedure as follows:
1) Start with a10 at t10, and let
2 2 1 , 1, 2,3, 4,5, ,1000, 10 .
I
a a I D
D
2) Calculate 1000 values of t2, a t
2 and
2 2 2 0 a t H using Equations (32), (30). The value of t2 correspond- ing to the minimum positive value of a t
2 is assumed to be tme1 and
11
2 2
2
2 2 2
0 0
, me .
me
a t
a t
a t a t
H H
3) Select a1a t
me1 at t1tme1, and repeat theprevious two steps where 10 .4
D Now the value of
2
t corresponding to the minimum positive value of
2a t is supposed to be
2
me
t and
22
2 2
2
2 2 2
0 0
, me .
me
a t
a t
a t a t
H H
4) Repeat this method several times using the values
6 8 10
10 ,10 ,10
D and 10 , then estimate the values 11
3, 4, 5
me me me
t t t and
6
me
t and obtain the corresponding
values of a t
me and
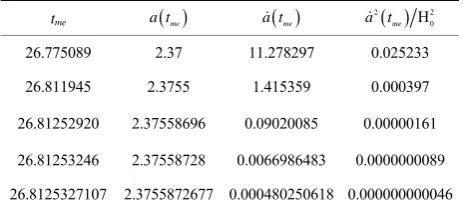
2 2 0 . me a t H 5) Denote these results as presented in Table 1, where
it is noticeable that the values of a t
me and
2 2 0 . me a t H converge and become very close to zero. In other words the universe stops expending at ttme6.
6) From Table 1 one can easily find that the time of maximum expension of the universe in the closed model is tme 26.8125327 Gyr. By similarity the time of big
[image:3.595.308.540.610.714.2]craunch is tbc53.6250654 Gyr.
Table 1. Iterative determination of the maximum expansion time of the universe in the closed cosmic model.
tme a t me a t me
2 2
0
H me
a t
26.775089 2.37 11.278297 0.025233
26.811945 2.3755 1.415359 0.000397
26.81252920 2.37558696 0.09020085 0.00000161
26.81253246 2.37558728 0.0066986483 0.0000000089
26.8125327107 2.3755872677 0.000480250618 0.000000000046
4. Observational Tests to the Closed Cosmic
Model
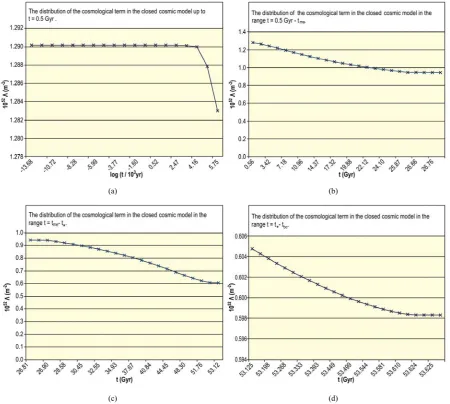
It is convenient to start by investigating the distributions of the cosmological parameter
t in the closed cos- mic model at various epochs according to Equation (17).Figure 1(a) shows no evident change of
t with cosmic time until t14.36 Gyr, then
t decreasesin relatively higher rate towards t0.5 Gyr. On the
other hand
t exhibits a gradual change with time in the time range t0.5 Gyrtme as seen in Figure 1(b),where tme 26.81 Gyr is the time of maximum ex-
pansion of the universe in the closed cosmic model. The slow variation of
t with t is also noticeable in the time ranges ttmet t, t tbc, as displaced in Fig-ures 1(c) and (d) respectively where tbc 53.63 Gyr is
the time of big craunch of the universe in the closed cos- mic model and ttbc0.5 Gyr.
Figure 2(a) shows that the expansion distribution of the universe in the closed cosmic model up to tt0 is found using Equation (32). This distribution is in good agreement with that of the observed general cosmic
model A obtained by Equation (16) in [1]. Moreover,
at t12.97 Gyr, these two distributions become iden-
tical. The redshift look-back time distributions in these two models up to tt0 were established and presented in Figure 2(b). Both distributions are in perfect agree- ment. The obvious agreement between the observed ge-
neral cosmic model A and the closed cosmic model as
seen from Figures 2(a) and (b) strongly argues in favour of reliability of the closed cosmic model.
(a) (b)
(c) (d)
Figure 1. (a) The distribution of the cosmological term in the closed cosmic model up to t = 0.5 Gyr; (b) The distribution of the cosmological term in the closed cosmic model in the range t = 0.5 Gyr −tme; (c) The distribution of the cosmological term
in the closed cosmic model in the range t = tme−t∗; (d) The distribution of the cosmological term in the closed cosmic model in
[image:4.595.74.525.282.686.2](a)
(b)
Figure 2. (a) The expansion of the universe in the general cosmic model A and the closed model up to t = t0; (b) Red- shift look back time relation in the general cosmic model A and the closed cosmic model up to t = t0.
5. Results and Discussion
The expansion of the universe in the closed cosmic mo- del up to ttme is obtained by Equation (32) and pre- sented in Figure 3(a). It is noticeable that the increase of
a t with t is continuous as a linear relation until
about t26.3 Gyr, then a t
increases relatively slow with t. Nevertheless, the contraction of the universe inthe closed model in the time range ttmetbc is
illustrated in Figure 3(b). It is obvious that a t
almost linearly decreases with t. However, a t
reduces re- latively slow with t just before ttbc.The distribution of the universe expansion speed a t
in the closed model in the range t0.5 Gyrtme is per- formed using Equation (30) and displaced in Figure 4(a). The value of a t
is high in the early universe, then itdecreases abruptly up to about t0.26 Gyr. Afterwards
a t fluctuates gradually with t until a t
0 at.
me
tt On the other hand, Figure 4(b) exhibits the
distribution of the universe contraction speed a t
in the closed model in the range ttmet. It is clear thatthe increase of a t
with t is gradual up to t52.4 Gyr then a t
rapidly increases with t until t.
t
The distribution of the universe expansion acceleration
a t in the closed model in the range t0.5 Gyrtme
is deduced from Equation (31) and exhibited in Figure
5(a). Abrupt increase in a t
with t is obvious up to2.0 Gyr
t . Then a t
changes very slightly with tuntil t 25 Gyr, where a t
starts decreasing gradual- ly up to t26.73 Gyr. Afterwards, a t
decreases(a)
(b)
Figure 3. (a) Expansion of the universe in the closed cosmic model up to t = tme; (b) Contraction of the universe in the
[image:5.595.60.288.83.490.2] [image:5.595.311.538.275.700.2](a)
(b)
Figure 4. (a) The distribution of the universe expansion speed in the closed cosmic model in the range t = 0.5 Gyr − tme; (b) The distribution of the universe contraction speed in
the closed cosmic model in the range t = tme−t∗.
rapidly towards the maximum expansion time tme. It is
clear that in the range t20.92 - 20.99 Gyr a t
02 1
pc
Km s M . Furthermore, Figure 5(b) shows the dis-
tribution of the universe contraction acceleration in the closed model in the range ttmet. It is noticeable
that a t
suddenly reduces up to t26.90 Gyr, then
a t
reduces gradually until t39.34 Gyr where
0.446.a t
Afterwards, a t
raises gradually up to52.93 Gyr
t where a t
starts increasing quite ra-pidly towards t. a t
0 Km s 2Mpc1 in the interval43.49 - 43.88 Gyr
t .
It is remarkable to note that the distributions of a t
and a t
in the closed cosmic model in the ranges0.5 Gyr
t , t t tbc will be investigated in details in a separate study, since in these two time ranges the pres- sure of the cosmic fluid is significant and can not be neg- lected.
(a)
(b)
Figure 5. (a) The distribution of the universe expansion acceleration in the closed cosmic model in the range t = 0.5 Gyr −tme; (b) The distribution of the universe contraction
acceleration in the closed cosmic model in the range t = tme −t∗.
The distribution of the density parameters in the closed cosmic model up to t0.5 Gyr is disclosed in Figure
6(a). It is prominent that the distribution of the radiation density parameter r t, coincides on the distribution of the total density parameter t up to t240.2663 yr.
However, the distribution of the matter density parameter ,
m t
coincides on the distribution of t at t6.2656
Myr. It is also obvious that the distributions of the dark energy density parameter ,t and the distribution of
, m t
are increasing while the distribution of r t, re-
mains almost fixed at the value r t, 1 up to
240.2663 yr
t , then it starts decreasing. Nevertheless,
the distribution of t stays almost constant at the value
1
t
in this epoch of the universe. Thus
, , 0.5
r t m t
[image:6.595.312.533.81.484.2] [image:6.595.63.281.86.475.2](a) (b)
(c) (d)
Figure 6. (a) The distribution of the density parameters in the closed cosmic model up to t = 0.5 Gyr; (b). The distribution of the density parameters in the closed cosmic model in the range t = 0.5 Gyr −tme; (c) The distribution of the density pa-
rameters in the closed cosmic model in the range t = tme−t∗; (d) The distribution of the density parameters in the closed
cosmic model in the range t = t∗ −tbc.
, , 0.00296
r t t
at t585.8445 Myr. Figure 6(b)
shows the distribution of the density parameters in the closed cosmic model in the range t0.5 Gyrtme. It is
evident that the distribution of ,t displays rapid in- crease until the time tm110.1022 Gyr where
, , 0.4593,
m t t
then it raises gradually up to
26.7701
t Gyr where it exhibits abrupt increase again.
The distributions of ,t,t become close together from t16.4243 Gyr to ttme. The value of t is almost 1.0 in the time intervals
0.5 - 6.5121 Gyr
t , t10.0882 - 15.1187 Gyr. The
distributions of r t, and m t, change quite slowly up to t26.7701 Gyr where they also raise up suddenly.
They get close together from t23.4536 Gyr to
.
me
tt The distribution of the density parameters in the
closed cosmic model in the range ttmet is pre-
sented in Figure 6(c). All distributions, reveal steep
decrease up to t26.8635 Gyr. Distributions of
,, ,
r t m t
are adjacent to each other until
31.7474 Gyr
t , then they diverge apart and decrease
slowly. In addition, the distributions of ,t and t
are also near each other up to t28.2604 Gyr. After-
wards these two distributions reduce gradually and get away from each other. Nevertheless, after the time
43.3096 Gyr
t the distributions of r t, and ,t reduce quite rapidly and intersect with each other at
52.579 Gyr
t where r t, ,t 0.0037. However,
the distributions of m t, and ,t intersect at 2 40.2712 Gyr
m
t where m t, ,t 0.4181. The
[image:7.595.74.524.84.495.2]from t45.6450 Gyr until tt. Figure 6(d) illus- trates the distribution of density parameters in the closed cosmic model in the range t t tbc. It is clear that the
distributions of m t, and t almost coincide on each
other up to about t53.5818 Gyr, then the distribu-
tion of m t, starts decreasing slightly but still close to that of t until t53.6248 Gyr, while t takes the
values between 0.9,1.0 throughout the interval
. bc
t t t However, the distribution of r t, raises gradually and intersects with the distribution of m t, at
2 53.6250 Gyr
rm
t . In addition the distribution of r t,
gets closer to the distribution of t at ttbc. Finally, the distribution of ,t indicates slow decrease until
about t53.5752 Gyr then it exposes quite rapid de-
crease towards the time of big Crunch.
It is essential to realize that the universe history has six main stages in the closed model, these are
1) The first radiation epoch in the range ttrm1. 2) The first matter epoch in the range trm1 t tm1. 3) The first dark energy epoch in the range
1 .
m me
t t t
4) The last dark energy epoch in the range
2.
me m
t t t
5) The last matter epoch in the range tm2 t trm2. 6) The last radiation epoch in the range trm2 t tbc. These epochs of the universe with their relevant den- sity parameters are all summarized in Table 2. Forther- more, the geometry of space throughout the universe history in the closed cosmic model is presented in details in Table 3.
One can see in Table 3 that the space of the universe
is flat just after the big bang up to t6.5321 Gyr
where the total density parameter lies in the range 0.95 t 1.044. Afterwards, the space of the universe becomes open until t10.0751 Gyr since t 0.95.
Then the universe space returns to flat up to
15.1261 Gyr
t as 0.95 t 1.044. Afterward, the
universe space gets curved then closed until ttme
because 1.5 3.259 10 .6
t
Hence, the universe space remains being closed then curved up to
39.3822 Gyr
t since 1.05 t 1.555 10 . 7
Afterward the universe space evolves into flat until
40.7521 Gyr
t as 0.95 t 1.044. Then the uni-
verse space develops into open up to t53.48 Gyr
owing to t 0.95. Eventuall the space of the universe comes back to flat until the time just before the big cranch by the reason of 0.95 t 1.044.
The distribution of the universe temperature T tu
inthe closed cosmic model in the first radiation epoch is obtained using Equation(34) in [1] and displayed in
Figure 7(a). It is evident that T tu
reduces continu-ously in linear manner during this era. The temperatures of the radiation T tr
and non relativistic matter Tm
tare determined from Equations (33), (37) in [1] respec- tively. The distributions of T tr
and Tm
t in thefirst matter and dark energy eras are presented in Figure
7(b). It is prominent that Tr Tm5609.1493 K at
1, rm
tt then the distributions of T t Tr
, m t decrease sharply up to t = 0.0702 Gyr. However, both distributions [image:8.595.310.538.403.537.2]reduce gradually afterwards. The distribution of T tr
is above that of Tm
t throughout these two epochs. AtTable 2. Epochs of the universe history in the closed cosmic model.
Epoch Time interval of epoch Relevant density parameter
First radiation era ttrm155915 yr rm1 0.5
First matter era trm1 t tm110.1022 Gyr m10.4593
First dark energy rea tm1 t tme26.8125 Gyr
6
2.321 10 me
Last dark energy era tme t tm240.2712 Gyr m20.4181
Last matter era tm2 t trm253.6250 Gyr rm20.4998
[image:8.595.57.536.568.733.2]Last radiation era trm2 t tbc53.6251 Gyr 0.7143 rbc
Table 3. Geometry of space throughout the universe history in the closed cosmic model.
Time interval/Gyr Total density parameter Geometry of space in the universe Relevant epochs
t≤ 6.5321 0.95 t 1.044 Flat space First radiation era and first matter era
6.5321 < t≤ 10.0751 t 0.95 Open space First matter era
10.0751 < t≤ 15.1261 0.95 t 1.044 Flat space First matter era and first dark energy era
15.1261 < t≤ tme
6
1.5 t 3.259 10 Curved then closed space First dark energy era
tme < t≤39.3822
7
1.05 t 1.555 10 Closed then curved space Last dark energy era
39.3822 < t≤40.7521 0.95 t 1.044 Flat space Last dark energy era and last matter era
40.7521 < t≤53.48 t 0.95 Open space Last matter era
(a) (b)
(c) (d)
Figure 7. (a) The distribution of the universe temperature in the closed cosmic model up to t = trm1; (b) The distribution of
temperature of the radiation and non-relativistic matter in the closed cosmic model in the range t = trm1 −tme. (c) The dis-
tribution of temperature of the radiation and non-relativistic matter in the closed cosmic model in the range t = tme−trm2; (d)
The distribution of the universe temperature in the closed cosmic model in the range t = trm2 −tbc.
t = tme Tr = 1.1471 K, Tm = 0.0005 K. The distribution of
r
T t and Tm
t in the last dark energy and last matterepochs are exposed in Figure 7(c). Both distributions
increase slowly up to t = 53.2567 Gyr, then they start
raising rapidly until they join together at trm2 where Tr
= Tm = 7032.5366 K. Eventually, Figure 7(d) indicates
the distribution of the universe temperature in the last radiation epoch. This distribution raises slowly up to
6007.3647 yr
t before tbc, then it increases rapidly
to the value Tu = 2.2593 × 10⁵ K at t = 34.4654 yr before
. bc t
Further interesting physical properties of the universe in the closed cosmic model would be investigated in separate studies in comparison with the corresponding properties of the universe in the five general cosmic models.
6. Conclusion
In this study a closed model of the universe was deve- loped depending on the assumption that very slow trans- fer of the dark energy to mater and radiation is allowed. Thus the cosmological parameter is no longer constant but so slowly decreasing function of time. In the light of this model the universe expands to maximum limit at
26.81253 me
t Gyr, then it will recollape to a big
[image:9.595.80.523.85.482.2]sion and contraction acceleration were carried out empi- rically which supported the previous result. In this model the universe history is classified in to six main eras, these are the first radiation epoch, the first matter epoch, the first dark energy epoch, the last dark energy epoch, the last matter epoch and the last radiation epoch. The dis- tributions of the density parameters of the radiation, mat- ter, dark energy and total density in addition to the dis- tributions of temperatures of the radiation and nonrela- tivistic matter were all determined and discussed in this model in the various eras of the universe.
7. Acknowledgements
This paper was funded by the Deanship of Scientific Re- search (DSR), King Abdulaziz University, Jeddah. The author, therefore, acknowledges with thanks DSR tech- nical and financial support.
REFERENCES
[1] F. A. Bukhari, “Five General Cosmic Models,” Journal of King Abdulaziz University: Science, Vol. 25, No. 1, 2013.
[2] F. A. Bukhari, “Cosmological Distances in Five General Cosmic Models,” International Journal of Astronomy and Astrophysics, 2013.
[3] J. V. Chunha, J. A. S. Lima and N. Pires, “Deflationary ( )t
Cosmology: Observational Expressions,” Astrono- my and Astrophysics, Vol. 390, No. 3, 2002, pp. 809-815. doi:10.1051/0004-6361:20020746
[4] J. A. S. Lima and M. Trodden, Physical Reviews D, Vol. 53, 1996, p. 4280.
[5] S. A. Bludman and M. Roos, “Quintessence Cosmology and the Cosmic Coincidence,” Physical Reviews D, Vol. 65, No. 4, 2002, Article ID: 043503.
doi:10.1103/PhysRevD.65.043503