http://www.scirp.org/journal/ajcc ISSN Online: 2167-9509
ISSN Print: 2167-9495
Projections of Precipitation Changes in Two
Vulnerable Regions of São Paulo State, Brazil
Iracema F. A. Cavalcanti
1, Lucí H. Nunes
2, José A. Marengo
3, Jorge L. Gomes
1, Virginia P. Silveira
1,
Marina S. Castellano
21Center of Weather Forecasting and Climate Studies/National Institute for Space Science (CPTEC/INPE), Cachoeira Paulista, S.P.,
Brazil
2State University of Campinas (UNICAMP), Cachoeira Paulista, S.P., Brazil
3National Center for Monitoring and Early Warning of Natural Disasters (CEMADEN), São José dos Campos, S.P., Brazil
Abstract
Weather and climate extremes are part of the natural variability. However, the frequency and intensity of precipitation extremes have increased in the globe following the global warming. Extreme precipitation impacts such as landslides and flooding with implications to vulnerability and adaptation are discussed for two regions of the state of São Paulo: the Metropolitan Region of Campinas and the Metropolitan Region of the Baixada Santista, located in southeastern South America. Simulations and projections obtained from four integrations of the Regional Eta model are analyzed to investigate the model behavior during the period of 1961-1990 and the projections within the period of 2011-2100. Uncer-tainties are discussed based on the standard deviation among the model spread. The projections show precipitation increase in the Metropolitan Region of Campinas during DJF for the near and distant future, while there are more un-certainties in the other seasons. In the Metropolitan Region of Baixada Santista, the precipitation increase is projected to all seasons, except JJA, when there is higher uncertainty. Daily rainfall indices suggest an increase of precipitation during the rainy days, but a reduction in the number of rainy days in both loca-tions. The projections show a reduction of light rains and an increase of heavy rains at both regions. The model identifies the South Atlantic Convergence Zone and frontal systems as precipitation patterns associated with extremes in the two locations. The results can be useful for adaptation actions, since the re-gions are highly populated and have high vulnerabilities.
Keywords
Climate Change, Precipitation Extremes, Vulnerable Regions, Precipitation Indices, Regional Model
How to cite this paper: Cavalcanti, I.F.A., Nunes, L.H., Marengo, J.A., Gomes, J.L., Silveira, V.P. and Castellano, M.S. (2017) Projections of Precipitation Changes in Two Vulnerable Regions of São Paulo State, Brazil. American Journal of Climate Change, 6, 268-293.
https://doi.org/10.4236/ajcc.2017.62014
Received: May 10, 2016 Accepted: May 9, 2017 Published: May 12, 2017 Copyright © 2017 by authors and Scientific Research Publishing Inc. This work is licensed under the Creative Commons Attribution International License (CC BY 4.0).
269
1. Introduction
World’s fast-growing urban areas, especially in developing countries, will likely suffer from the consequences of climate change, a major issue facing human so-cieties. The projected impacts of climate change are likely to require some adap-tation, which in turn is based on future projections of whether adaptive capacity assets will be drawn upon in times of need [1]. Adaptive response, a component of vulnerability, is dependent on a range of variables that operate at diverse scales [1]; among them, the frequency and intensity of extreme events which are in connection to population vulnerability, may favor natural disasters.
Although part of the natural system, extreme weather and climate events can cause impacts and major disruptions in natural and human systems. The level of impacts depends on the intensity of the change and also upon the capacity of the social groupings to avoid and/or to overcome their negative effects. Therefore, aspects such as poor infrastructure facilities, inexistent or weak institutional me- chanisms to cope with extremes of climate variability and change such as lack of financial resources as well as socio-spatial disparities, are potential contributors to more severe impacts of extreme weather and climate events. Because such ex-treme events can reduce the economic growth and development and obstruct competitiveness; their evaluation must be part of a more complex task of assess-ing extremes to provide knowledge and to inform societal risk relevant to adap-tation [2]. Components of vulnerability include exposure, sensitivity risk and re-silience [3]. Adaptation measures can contribute to reducing risks making a so-ciety less vulnerable and more resilient to extremes.
Precipitation extremes over São Paulo state have been discussed in several stu- dies [4][5] [6][7][8]. Studies on observed precipitation extremes over South- eastern Brazil, where the São Paulo state is located, are numerous [9][10][11], among others. Model simulations of extremes over South America, including São Paulo state were presented in [12] and [13]. Most of these studies have shown that rainfall extremes have been increasing during the last five decades, and fu-ture projections show the similar trend. Uncertainties in fufu-ture of precipitation projections over South America were discussed in [14][15][16]. The main source of uncertainty has been identified as the differences in physical parameteriza-tions among different models and also the possible role of urbanization, something that is not yet well represented in climate models.
In the present study, the analyses are focused on two metropolitan regions of São Paulo state using a regional model and future projections results to provide information that can be useful to adaptation measures in face of the vulnerabili-ties of the sites. The Metropolitan Region of Campinas (MRC) and the Metro-politan Region of Baixada Santista (MRBS) are dynamic economic centers with rich ecosystems, but also low environmental threshold1, aggravated by the
popula-tion increase and occupapopula-tion of more risk-prone locapopula-tions, such as hilly regions,
1Natural systems can withstand disruption only up to a certain threshold (or “tipping point”)
which are affected by landslides or areas at risk of flooding. These actions led to relevant environmental changes during the last decades and made population more vulnerable to the impacts of extreme weather and climate.
São Paulo state is located in southeastern South America, in a region affected by the South Atlantic Convergence Zone (SACZ) [11][17][18][19], a meteoro-logical system that causes heavy and persistent precipitation. Heavy rainfall events over Southeastern Brazil have been associated with the SACZ and cold fronts [9]. In addition, these events can have the contribution of humidity flux from Amazonia, which is one of the sources of moisture to southeastern Brazil [20]. A review of large scale and synoptic systems influence on extreme precipitation over Southeastern Brazil is given in [21], where some cases during the first dec-ade of 21st century were discussed. Positive precipitation trend identified in São
Paulo city, the largest city in Brazil, during the wet season from 1933 to 2010, was attributed in part to natural climate variability and also to the urbanization effects [7]. Besides the heat island effect, the influence of sea breeze intensifica-tion due to warmer nights on the positive precipitaintensifica-tion trend was suggested by [6].
The Eta Regional model has been used in operational weather forecasting at the Center for Weather Forecasting and Climate Studies/National Institute for Space Research (CPTEC/INPE). This model has also been used in climate simu-lations and projections of climate change [6][22] [23][24] [25]. These projec-tions were obtained from the Eta model downscaling of the HadCM3 with four integrations using the A1B scenario, and HadGEM2-ES, MIROC5 and BESM from CMIP5, using the RCPs 4.5 and 8.5 scenarios for 1961-1990, 2010-2040, 2041-2070 and 2071-2100. Precipitation, temperature and atmospheric circula-tion climatology of the base period were validated against observacircula-tions in [22]. The four members simulated the seasonal difference between DJF and JJA, re- presenting the typical SACZ pattern over tropical and subtropical South Ameri-ca.
The model results and observed data information are presented in Section 2. In Section 3, the geographic and socio-economic features of the two metropoli-tan regions are informed. Section 4 indicates the precipitation changes projected by the model in the regions, the member spread and uncertainties. Extreme pre-cipitation indices are shown in Section 5, and prepre-cipitation patterns simulated by the model in cases of extreme monthly precipitation are discussed in Section 6. Conclusions are shown in Section 7.
2. Data and Analyses
climate sensitivity were analyzed. Details of these integrations can be found in [22]. Maps of precipitation difference between two future periods (2011-2040) and (2070-2099) and the base period (1961-1990) are shown in percentages com-pared to the base period for the ensemble, ensemble plus and ensemble minus standard deviation among the members. Results from the four members were analyzed in the two locations, MRC and MRBS. Uncertainties are analyzed from the maps and considering members spread in the graphs.
Daily data from 1961 to 1990 (base period) and for three periods of the 21st
century (2011-2040, 2041-2070 and 2071-2098) were used to calculate the preci-pitation indices shown in Table 1. The climatological monthly observed data and model results were used to obtain the annual cycle during the base period. Daily rain intensity was analyzed regarding class intervals of precipitation <1 mm to >51 mm. Monthly data was used to calculate the Standardized Precipitation Index (SPI). This index identifies extreme wet/dry (SPI ≥ 2.0/SPI ≤ −2.0), severe wet/dry (1.5 ≤ SPI < 2.0)/(−2 < SPI ≤ −1.5) and moderate wet/dry (1.0 ≤ SPI < 1.5)/(−1.5 < SPI ≤ −1.0) conditions. The anomalous precipitation patterns over South America associated with extreme wet monthly precipitation obtained from the 4 members in the 2 locations were analyzed in composites of precipitation anomalies for each season.
The vulnerability of each municipality is presented by means of the Social Vulnerability Index (SVI), developed by [27] which combines several variables of the 2010 Brazil census to indicate the vulnerability of each municipality. The SVI seeks to highlight the social inequality scenario in each metropolitan region, indicative of exclusion and social vulnerability, and was constructed using six-teen indicators grouped into three main dimensions: urban infrastructure, hu-man capital and income and employment. Each dimension corresponds to a set of assets, resources or structures whose access, absence or failure indicate that the pattern of family life is low, suggesting, in extreme cases, the lack of access and non-compliance of social rights. Each variable has a relative weight, reveal-ing their importance for the whole index.
The first dimension, the urban infrastructure vulnerability, reflects the condi-tions of access to basic sanitation and urban mobility and has three variables, each one with a weight in the index: percentage of people in households with inadequate water and sewage (0.3); percentage of population living in households without regular waste collection services (0.3); percentage of people living in households below poverty estimate and who spend more than one hour a day com- muting (0.4). The second dimension, human capital, involves health and education
Table 1. Daily precipitation indices.
SDII Mean Precipitation of rainy days >1 mm mm/day SDII_10 Mean Precipitation of days ≥10 mm mm/day
and has 8 indicators, each one weighted 0.125. The third and last dimension, in-come and employment, is composed of five indicators, each one weighted 0.2. The combination of the variables allows a unique value of exclusion and social vulnerability to the cities of the metropolitan regions. The SVI ranges between 0 and 1, the closer to 1, the greater the social vulnerability of a given municipality. Classes of social vulnerability are: 0 - 0.2 very low; 0.2 - 0.3 low; 0.3 - 0.4 me-dium; 0.4 - 0.5 high; and above 0.5 very high.
3. The Metropolitan Regions-Geographical and
Socio-Economic Features
3.1. The Metropolitan Region of Campinas (MRC)
Created in 19 June 2000, the Metropolitan Region of Campinas (MRC, Figure 1(a)) has 20 municipalities (one aggregated to the region in 2015 only), spread over 3,791 km2, with a population estimated in 3,094,181 inhabitants. The Gross
Domestic Product (GDP) of the MRC is R$98.5 billion and its Human Devel-opment Index (HDI), 0.792 [27]. The MRC is a center for research and devel-opment of science, technology and innovation in Brazil, concentrating more than 50 branches of the 500 largest companies in the world and accounting for 10% of Brazilian industrial production in various sectors, such as automotive, textile, metallurgy, food, pharmaceutical, petrochemical, telecommunications and electronics. Agriculture (fruits, coffee and sugar-cane) and services are also important activities in this region. The International Airport of Viracopos, in Campinas, is one of the most important of the country, especially due to its role in cargo transport. The area has undergone rapid social, economic and envi-ronmental transformations and despite its economic vitality, as in many other fast-growing urban areas, the unplanned growth of the city has led to an creasing inability to house the growing population and to provide adequate in-frastructure. Part of the population lives in areas at great risk to natural disasters, including those expected to worsen with climate change, like floods.
Impacts produced by precipitation excess in Campinas, the main city of the
[image:5.595.60.534.539.702.2](a) (b)
region, have increased in number and types between 1958 and 2007 and have af-fected all social classes [28]. During the same period, changes in the distribution of extreme precipitation events were also verified, especially in the last two dec-ades, with increase in the annual totals and in the frequency of daily events above 50 mm [29]. Notwithstanding, the increase of impacts triggered by preci-pitation shows that the severe impacts were associated not only with the magni-tude of the rain totals, but also with the increased exposure of the population [30]. Precipitation totals are variable within the area (Table 2), higher totals oc-curring during spring and summer periods. In order to evaluate the weight of the largest amounts in the precipitation time series, the Concentration Index [31], which considers the contribution of the days of greatest rainfall to the en-tire series, was applied to the area, for a period spanning from 1958 to 2003 [32]. The authors verified that rainfall was quite concentrated, as a large proportion of the total precipitation during the entire period (70%) was registered on 25% of the days only. Death tolls due to weather events are on decrease after improve-ments on weather forecasting and preventive measures, but losses are still huge and many other challenges remain, like irregular occupation of risk-prone areas and lack of a responsive and efficient flood warning system. Although there are several individual studies related to these issues, there is a need to design and implement, in a coordinated way, a coherent and comprehensive understanding of the problems in the area.
3.2. The Metropolitan Region of Baixada Santista (MRBS)
The Metropolitan Region of Baixada Santista (MRBS), at the eastern edge of the Atlantic Ocean (Figure 1(b)), is the oldest settlement of Brazil, encompassing 9 municipalities spread in an area of 2421 km2, being home of 1,664,136
[image:6.595.54.541.611.732.2]inhabi-tants. The region presents rich ecosystems and extensive climatic and topogra- phic diversity, but the rapid urban expansion rate of the area in the last decades promoted a comprehensive disturb in its ecological dynamics (only 7% of the original vegetation remain), as well as in the energy and water consumption. The Metropolitan Human Development Index (HDI) is 0.777 and the Gross Domes-tic Product (GDP) is R$47.3 billion [27]. The precipitation totals in the MRBS are high but variable spatially, as can be seen in Table 3. Concentration is more
Table 2. Average, maximum and minimum precipitation (1960-1999) to selected rain gauges within the MRC (Source: DAEE; CTH/USP; SIGRH, 2005).
Municipality Alt. (m) Lat. (S) Lon. (W) Avg. 1960-1999 (mm) Annual Max. (mm) Annual Min. (mm) Holambra 600 23˚38' 47˚03' 1323.6 2,172.6 (1983) 878.9 (1968)
Table 3. Average, maximum and minimum precipitation (1960-1999) to selected rain gauges within the MRBS (Source: DAEE; CTH/USP; SIGRH, 2005).
Municipality Alt. (m) Lat. (S) Lon. (W) Avg. 1960-1999 (mm) Annual Max. (mm) Annual Min. (mm) Bertioga 720 23˚45' 46˚08' 4657.4 7391.1 (1947) 1758.2 (2001) Cubatão 5 23˚52' 46˚23' 2520.5 4138.6 (1947) 1754.8 (1963) Guarujá 3 23˚57' 46˚11' 2306.4 5973.1 (1947) 1364.7 (1938) Itanhaém 3 24˚11' 46˚48' 2132.4 3327.8 (1966) 358.1 (2000) Mongaguá 20 24˚05' 46˚37' 2723.5 4129.2 (1995) 1422.5 (2002)
Santos 200 23˚53' 46˚13' 3375.6 5559.3 (1947) 1946.8 (2001) São Vicente 10 23˚57' 46˚27' 2351.9 3176.1 (1973) 1425.5 (2001)
acute during summer, which coincides with an increase of tourism activities and thus, exposes more people to the risk of floods and landslides. Evaluating how concentrated was daily rainfall from 1958 to 2003, [32] found that few events registered very high rainfall amounts. Concentrated amounts of rainfall can largely impact the affected areas, causing flooding, erosion, landslide; in some situations high precipitation can be associated with storm surges, that bring ma-jor loss of property and life, reduce the economic growth and obstruct competi-tiveness.
In some sectors of the MRBS the high deforestation rate associated with the occupation of sites next to rivers or steeply slopes and the intense precipitation episodes have caused major natural disasters, as a large number of people live in areas at risk of mass movements and flooding. This occupational pattern and the pollution generated by the industrial complexes affected the vegetation, which originally protected the slopes and soils, leading to erosion landslides, mudslides and floods. Deforestation also reduced the water retention capacity of the soil, increased continental runoff and contributed to biodiversity losses.
The GDP of the MRBS corresponds to approximately US$21.9 billion and large-scale economic interests include the Port of Santos, the largest and more important of Latin America and the main logistic center of Brazil, as around a quarter of the products value traded in the country in the international market passes by this harbor. In addition, it is part of the largest system of road-rail transport and waterways (Tietê-Paraná) of the country and handles more than 90 million tons per year. The recent oil finds in the ultra-deep Pre-salt layer of Santos Basin is creating new demands for infrastructure, transport and commu-nication, which might continue to exert strong pressure in this coastal sector (Governo do Estado de São Paulo, Secretaria de Desenvolvimento Metropolitano 2011).
3.3. Social Vulnerability in MRC and MRBS
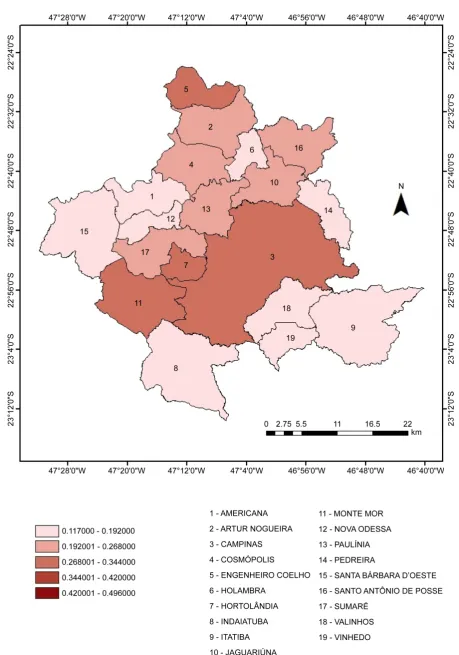
dif-ferences of infrastructure, security and availability of public spaces influence the welfare levels of individuals and families. In Table 4 and Figure 2, that present the SVI for the municipalities of the MRC, one can see that all cities present low to medium social vulnerability. Four of them, including Campinas—the seat of the MR, regional leader on economic development and home of 1,080,999 people present the highest values of SVI for the region. Campinas has expe-rienced fast social, economic and environmental changes and presents deficien-cies in the infrastructure. The urbanization rate is high and partially uncon-trolled and uncoordinated, resulting in disperses clusters over space. Because people are more scattered, the costs of infrastructure and public services tend to be higher [33] and might pose additional problems in a situation of danger. Also in the MRBS all municipalities present low to medium social vulnerability (Table 5, Figure 3). However, five in nine present the highest values of SVI for the region. Santos, the center of the MRBS is the only city that has very low SVI. The differences among the cities of the MRBS expose the fact that although the Metropolitan Region should operate in a combined way to promote an equal and comprehensive development, important internal differences concerning vulnerability remain within the area.
Table 4. Social vulnerability index for each municipality of the MRC.
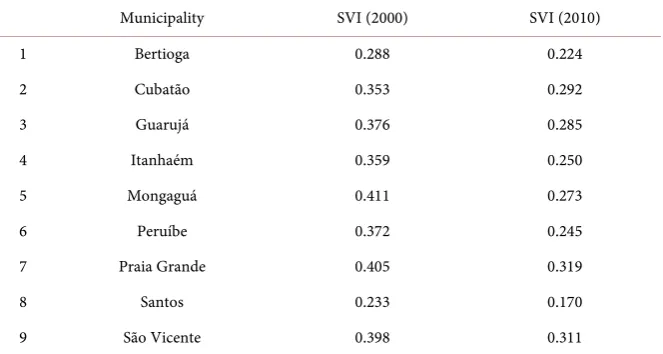
Table 5. Social vulnerability index for each municipality of the MRBS.
Municipality SVI (2000) SVI (2010) 1 Bertioga 0.288 0.224 2 Cubatão 0.353 0.292 3 Guarujá 0.376 0.285 4 Itanhaém 0.359 0.250 5 Mongaguá 0.411 0.273 6 Peruíbe 0.372 0.245 7 Praia Grande 0.405 0.319 8 Santos 0.233 0.170 9 São Vicente 0.398 0.311
Reducing social vulnerability can decrease both human suffering and eco-nomic loss. As the two regions present high vulnerabilities regarding precipita-tion events leading to flooding and landslides, changes due to the global warm-ing need to be assessed to improve adaptation actions. Therefore, in the next sections, future projections of precipitation are analyzed from model results, fo-cusing in the two metropolitan regions.
4. Precipitation Changes Projected by the Regional Eta
Model in the Metropolitan Region of Campinas (MRC) and
Metropolitan Region of Baixada Santista (MRBS)
(a) (b)
Figure 4. Annual cycle of precipitation. Model during Base Period (BP) of 1961-1990 (solid line). Observation during 1961-1990 (dashed line). Columns are the differences between future periods and base period. P1: (2011-2040) - (1961-1990), P2: (2041-2070) - (1961-1990), P3: (2070-2099) - (1961-1990). (a) MRC, (b) MRBS.
MRC. Reduced rainfall is projected from middle winter to middle spring. At MRBS small reductions are projected for August and September. From middle spring to early winter the projections show increased precipitation except in February and July, when there is a very small reduction. Then, in both locations, the rainy season is projected to be wetter and the dry season to be drier than in the base period.
Spatial changes in two future periods: near future (2011-2040) and distant fu-ture (2070-2099) compared to the base period (1961-1990) of MRC and MRBS are shown in Figures 5-8. The uncertainties are discussed in terms of the stan-dard deviation among the members. The ensemble mean, ensemble mean plus or minus one standard deviation indicate large or small uncertainties and the members spread. In DJF (2011-2040) the ensemble mean indicates an increase of precipitation between 5% and 10% at MRC (Figure 5(a)). The increase interval is between 0% and 20%, from the ensemble minus to the ensemble plus. During DJF (2070-2099) the range of increase is between 10% to 20% in the ensemble and between 0% to 30% from the ensemble minus to the ensemble plus (Figure 5(b)). At MRBS the projections also show precipitation increase for the ensem-ble between 0% and 5% in the majority of municipalities (Figure 5(c)). Com-pared to the MRC, the uncertainty is larger at MRBS, since the ensemble minus standard deviation indicates a reduction between 0% and 5% and the ensemble plus standard deviation indicates an increase between 5% and 10% (Figure 5(c)). The uncertainty at MRBS is reduced during DJF (2070-2099) since the ensemble, ensemble minus and ensemble plus indicate increases between 0% and 20% (Figure 5(d)). Figure 9 shows the spread among the four members of precipitation differences between three future periods and the base period. At MRC all members show increased precipitation in the future periods during DJF, indicating a convergence in the model response and then more confidence on the results (Figure 9(a)). At MRBS there is convergence among the members on precipitation increase during the last two future time slices (Figure 9(b)).
Figure 9. Precipitation difference between future projections and base period. (a) MRC, (b) MRBS. P1: (2011-2040) - (1961-1990), P2: (2041-2070) - (1961-1990), P3: (2070-2099) - (1961-1990).
shows precipitation increase in the majority of members in both locations. JJA (2011-2040) and (2070-2099) present the larger uncertainties regarding the standard deviation among the members in both regions (Figure 7). The ensem-ble minus the standard deviation shows reduced precipitation in both locations and the ensemble plus the standard deviation shows increased precipitation. The interval ranges from −40% to 10% in MRC and from −20% to 30% in MRBS during (2011-2040). During (2070-2099) the intervals change from −40% to 20% in MRC and from −10% to 30% in MRBS. The uncertainties are also seen in the spread (Figure 9), although the ensemble shows reduction during two future periods in MRC and increase during three future periods in MRBS. In SON, MRC displays changes between −10% and 5% and MRBS changes between −5% and 20% during (2011-2040) (Figure 8(a), Figure 8(c)). The interval of changes increases in (2070-2099) from −20% to 30% in MRC and between 0% and 40% in MRBS (Figure 8(b), Figure 8(d)). Therefore the uncertainties in SON are larger in MRC than in MRBS, which is also seen in Figure 9 that shows precipi-tation increase in MRBS projected by the ensemble and the majority of mem-bers, while in MRC there is large spread among the members.
5. Precipitation Indices
The indices of Table 1 are shown in Figure 10(a) and Figure 10(b) for MRC and MRBS, respectively. SDII and SDII10 are well represented by the model, while R1 and R10 are overestimated in MRC. In this location, the projections show a gradual increase in the mean precipitation above 1mm (SDII) and 10 mm (SDII10) from the base period (1961-1990) to the last period of 21st century
(2071-2098), with low spread among the members, represented by the minimum and maximum values. The number of rainy days (R1) reduces along the period, while there are small changes in the number of days with heavier precipitation (R10). The concurrent reduction of rainy days and precipitation increase, in the future, indicate more intense rains concentrated in a few days. In MRBS the model underestimates the four indices, but there is also an increase of SDII and SDII10 and reduction of R1.
Figure 11. Frequency distribution of precipitation events in MRC. (a) Precipitation <1 - 27 mm/day, (b) Precipitation between 27 and >51 mm/day.
6. Patterns of Extreme Monthly Precipitation
Figure 12. Frequency distribution of precipitation events in MRBS. (a) Precipitation <1 - 27 mm/day, (b) Precipitation between 27 and >51 mm/day.
Figure 13. Composites of extreme wet monthly precipitation in MRC and MRBS in each season (mm/day) simulated by the Eta model during 1961-1990. The contour lines indicate regions with significance greater than 95%.
Amer-ica Monsoon region [37][38][39], although weaker than in DJF (Figure 13(d)). It is also noted a precipitation dipole over Chile, which indicates the dis-placement of synoptic systems northward of the normal track. Therefore, the re-gional ETA model represents well the patterns associated with extreme monthly precipitation in the two regions of southeastern Brazil. It identifies the pattern of frontal systems, in MAM and JJA, and the influence of the SACZ in DJF and SON. The impact of these systems on observed extreme precipitation over Sou-theastern Brazil have been discussed in several studies, such as [9][11][22]. The ability of the ETA model in identifying seasonal patterns of extreme precipita-tion related to the influence of observed systems can increase the confidence on model results, reducing uncertainties, and also can be useful for seasonal predic-tions.
7. Conclusions
The two metropolitan regions (MRC and MRBS) are vulnerable in face of cli-mate change. The model underesticli-mates precipitation in MRBS, but represents well the annual precipitation cycle in MRC, although with overestimated values. In MRC, the projections in the near and distant future periods show precipita-tion increase during DJF, while there are more uncertainties in the other sea-sons. In MRBS, precipitation increase is projected during DJF, MAM and SON of the last period of the 21st century. The uncertainties are larger in JJA in both
locations. The ensemble mean shows increased precipitation from late spring to middle summer and reduced precipitation from middle winter to early spring months, indicating drier conditions in the dry season and wetter conditions in the rainy season. The increase in the summer season and the decrease in the spring are consistent with [40] which discusses the delay in the South American Monsoon System due to drier conditions in this later season in future projec-tions. In MRBS, the reduction from middle winter to early spring is very small, likely due to the location close to the sea. The projections show a precipitation increase during the rainy days and a reduction of the rainy days’ number in both areas, indicating intensity increase in future projections.
The changes may impact the economy and may increase social problems due to floods and droughts in MRC and floods and landslides in MRBS. The vulne-rabilities and the impacts of climate change need to be considered in adaptation actions in both regions. Even disregarding the effects of climate change, adapta-tion to the existing level of changes in both study areas is already critical. Due to the rapid transformation of these lively metropolitan regions, which place popu-lation at greater risk for natural disasters, including those expected to worsen with climate change, new challenges are posed, among them to understand and respond to the complex interactions between urban development and the cli-mate system in view of building more resilient and adapted cities.
Acknowledgements
51876-0 and FAPESP RCUK PULSE Grant 2011/51843-2. I. F. A. C. and J. A. M. are grateful also to CNPq for research support.
References
[1] Vincent, K. (2007) Uncertainty in Adaptive Capacity and the Importance of Scale. Global Environmental Change,17, 12-24.
[2] IPCC (2012) Managing the Risks of Extreme Events and Disasters to Advance Cli-mate Change Adaptation. In: Field, C.B., Barros, V., Stocker, T.F., Qin, D., Dokken, D.J., Ebi, K.L., Mastrandrea, M.D., Mach, K.J., Plattner, G.-K., Allen, S.K., Tignor, M. and Midgley, P.M., Eds., A Special Report of Working Groups I and II of the In-tergovernmental Panel on Climate Change Field, Cambridge University Press, Cambridge and New York, 582 p.
[3] Turner, B.L., Kaspersonb, R.E., Matsone, P.A., McCarthyf, J.J., Corellg, R.W., Christensene, L., Eckleygh, N., Kasperson, J.X., Luerse, A., Martellog, M.L., Polsky, C., Pulsiphera, A. and Schiller, A. (2003) A Framework for Vulnerability Analysis in Sustainability Science. Proceedings of the National Academy of Sciences of the United States of America, 100, 8074-8079. https://doi.org/10.1073/pnas.1231335100 [4] Liebmann, B., Jones, C. and Carvalho, L.M.V. (2001) Interannual Variability of Dai-
ly Extreme Precipitation Events in the State of São Paulo, Brazil. Journal of Climate, 14, 208-218. https://doi.org/10.1175/1520-0442(2001)014<0208:IVODEP>2.0.CO;2 [5] Carvalho, L.M.V., Jones, C. and Liebmann, B. (2002) Extreme Precipitation Events
in Southeastern South America and Large-Scale Convective Patterns in the South Atlantic Convergence Zone. Journal of Climate, 15, 2377-2394.
https://doi.org/10.1175/1520-0442(2002)015<2377:EPEISS>2.0.CO;2
[6] Marengo, J.A., Valverde, M.C. and Obregón, G.O. (2013) Observed and Projected Changes in Rainfall Extremes in the Metropolitan Area of São Paulo. Climate Re-search, 57, 61-72. https://doi.org/10.3354/cr01160
[7] Silva Dias, M.A.F., Dias, J., Carvalho, L.M.V., Freitas, E.D. and Silva Dias, P.L. (2013) Changes in Extreme Dailyrainfall for São Paulo, Brazil. Climatic Change, 116, 705-722. https://doi.org/10.1007/s10584-012-0504-7
[8] Obregón, G.O., Marengo, J.A. and Nobre, C.A. (2014) Rainfall and Climate Variabi- lity: Long-Term Trends in the Metropolitan Area of São Paulo in the 20th Century. Climate Research, 61, 93-107. https://doi.org/10.3354/cr01241
[9] Lima, K., Satyamurti, P. and Fernandez, J.P.R. (2010) Large-Scale Atmospheric Conditions Associated with Heavy Rainfall Episodes in Southeast Brazil. Theoretical Applied Climatology, 101, 121-135. https://doi.org/10.1007/s00704-009-0207-9 [10] Vasconcellos, F.C. and Cavalcanti, I.F.A. (2010) Extreme Precipitation over South-
eastern Brazil in the Austral Summer and Relations with the Southern Hemisphere Annular Mode. Atmospheric Science Letters, 11, 21-26.
https://doi.org/10.1002/asl.247
[11] Carvalho, L.M.V., Jones, C. and Liebmann, B. (2004) The South Atlantic Conver-gence Zone: Intensity, Form, Persistence, and Relationships with Intraseasonal to Interannual Activity and Extreme Rainfall. Journal of Climate, 17, 88-108.
https://doi.org/10.1175/1520-0442(2004)017<0088:TSACZI>2.0.CO;2
[12] Rusticucci, M., Marengo, J., Penalba, O. and Renom, M. (2010) An Intercomparison of Model-Simulated in Extreme Rainfall and Temperature Events during the Last Half of the XX Century: Part 1: Mean Values and Variability. Climatic Change, 98, 509-529. https://doi.org/10.1007/s10584-009-9742-8
Intercompa-rison of Observed and Simulated Extreme Rainfall and Temperature Events during the Last Half of the Twentieth Century: Part 2: Historical Trends. Climatic Change, 98, 509-529. https://doi.org/10.1007/s10584-009-9743-7
[14] Solman, S.A. and Pessacg, N.L. (2012) Evaluating Uncertainties in Regional Climate Simulations over South America at the Seasonal Scale. Climate Dynamics, 39, 59-76. https://doi.org/10.1007/s00382-011-1219-6
[15] Blazquez, J. and Nunez, M.N. (2013) Analysis of Uncertainties in Future Climate Projections for South America: Comparison of WCRP-CMIP3 and WCRP-CMIP5 Models. Climate Dynamics, 41, 1039-1056.
https://doi.org/10.1007/s00382-012-1489-7
[16] Torres, R.R. and Marengo, J.A. (2013) Uncertainty Assessments of Climate Change Projections over South America. Theoretical Applied Climatology, 112, 253-272. https://doi.org/10.1007/s00704-012-0718-7
[17] Kodama, Y. (1992) Large Scale Common Features of Subtropical Precipitation Zones (The Baiu Frontal Zone, the SPCZ, and the SACZ) Part I: Characteristics of Subtropical Frontal Zones. Journal of Meteorological Society of Japan, 70, 813-836. [18] Liebmann, B., Kiladis, G.N., Marengo, J.A., Ambrizzi, T. and Glick, J.D. (1999) Sub-
monthly Convective Variability over South America and the South Atlantic Conver- gence Zone. Journal of Climate, 12, 1877-1891.
https://doi.org/10.1175/1520-0442(1999)012<1877:SCVOSA>2.0.CO;2
[19] Cunningham, C.A.C. and Cavalcanti, I.F.A. (2006) Intraseasonal Modes of Variabil-ity Affecting the South Atlantic Convergence Zone. International Journal of Clima-tology, 26, 1165-1180. https://doi.org/10.1002/joc.1309
[20] Drumond, A., Marengo, J.A., Ambrizzi, T., Nieto, R., Moreira, L. and Gimeno, L. (2014) The Role of the Amazon Basin Moisture in the Atmospheric Branch of the Hydrological Cycle: A Lagrangian Analysis. Hydrology and Earth System Science, 18, 2577-2598. https://doi.org/10.5194/hess-18-2577-2014
[21] Cavalcanti, I.F.A. (2012) Large Scale and Synoptic Features Associated with Ex-treme Precipitation over South America: A Review and Case Studies for the First Decade of the 21st Century. Atmospheric Research, 118, 27-40.
[22] Chou, S.C., Marengo, J.A., Lyra, A.A., Sueiro, G., Pesquero, J.F., Alves, L.M., Kay, G., Betts, R., Chagas, D.J., Gomes, J.L., Bustamante, J.F. and Tavares, P. (2012) Downscaling of South America Present Climate Driven by 4-Member HadCM3 Runs. Climate Dynamics, 38, 635-653. https://doi.org/10.1007/s00382-011-1002-8 [23] Chou, S.C., Lyra, A., Mourão, C., Dereczynski, C., Pilotto, I., Gomes, J.L., Busta-
mante, J., Tavares, P., Silva, A., Rodrigues, D., Campos, D., Chagas, D., Sueiro, G., Siqueira, G., Nobre, P. and Marengo, J.A. (2014) Evaluation of the Eta Simulations Nested in Three Global ClimateModels. American Journal of Climate Change, 3, 438-454. https://doi.org/10.4236/ajcc.2014.35039
[24] Chou, S.C., Lyra, A., Mourão, C., Dereczynski, C., Pilotto, I., Gomes, J.L., Busta-mante, J., Tavares, P., Silva, A., Rodrigues, D., Campos, D., Chagas, D., Sueiro, G., Siqueira, G. and Marengo, J.A. (2014) Assessment of Climate Change over South America under RCP 4.5 and 8.5 Downscaling Scenarios. American Journal of Cli-mate Change, 3, 512-527. https://doi.org/10.4236/ajcc.2014.35043
https://doi.org/10.1007/s00382-011-1155-5
[26] Collins, M., Tett, S.F.B. and Cooper, C. (2001) The Internal Climate Variability of a HadCM3, a Version of the Hadley Centre Coupled Model without Flux Adjust-ments. Climate Dynamics, 17, 61-81. https://doi.org/10.1007/s003820000094 [27] IPEA (2015) Atlas da Vulnerabilidade Social nos municípios brasileiros.
http://ivs.ipea.gov.br/ivs/
[28] Castellano, M.S. and Nunes, L.H. (2011) Extreme Precipitation Events and Their Socio-Spatial Impacts on a Brazilian Urban Center: Campinas-SP. 6th European Conference on Severe Storms, 3-7 October 2011, Palma de Mallorca.
[29] Vicente, A.K. and Nunes, L.H. (2004) Extreme Precipitation Events in Campinas, Brazil. Terræ Geosciences Geography and the Environment, 1, 60-63.
[30] Nunes, L.H. and Fernandes, S.F. (2013) Impacts of Precipitation Episodes in Cam-pinas, Brazil. UNISDR Scientific, Technical and Advisory Group Case Studies.
http://www.preventionweb.net/files/workspace/7935_nunesandfernandes.pdf
[31] Martín-Vide, J. (2004) Spatial Distribution of Daily Precipitation Concentration Index in Peninsular Spain. International Journal of Climatology, 24, 959-971. https://doi.org/10.1002/joc.1030
[32] Nunes, L.H., Martín-Vide, J. and Gabriel, G.H. (2013) Intense Precipitation Pattern by Means of Concentration Index (CI)-Examples of Two Brazilian Sites. European Conference on Severe Storms, Helsinki, 3-7 June 2013, 7.
[33] Bhatta, B. (2010) Causes and Consequences of Urban Growth and Sprawl. In: Bhat-ta, B., Ed., Analysis of Urban Growth and Sprawl from Remote Sensing Data, Sprin- ger-Verlag, Berlin Heidelberg, 17-36. https://doi.org/10.1007/978-3-642-05299-6_2 [34] Kitoh, A., Endo, H., Kumar, K., Cavalcanti, I.F.A., Goswami, P. and Zhou, T. (2013)
Monsoons in a Changing World: A Regional Perspective in a Global Context. Jour-nal of Geophysical Research Atmospheres, 118, 3053-3065.
https://doi.org/10.1002/jgrd.50258
[35] Nogués-Paegle, J. and Mo, K. (1997) Alternating Wet and Dry Conditions over South America during Summer. Monthly Weather Review, 125, 279-291.
https://doi.org/10.1175/1520-0493(1997)125<0279:AWADCO>2.0.CO;2
[36] Herdies, D., da Silva, A. and Silva Dias, M.A.F. (2002) The Bi-Modal Pattern of the Summertime Circulation over South America. Journal of Geophysical Research Atmospheres, 107, 42-10. https://doi.org/10.1029/2001JD000997
[37] Silva, A.E. and Carvalho, L.M.V. (2007) Large-Scale Index for South American Monsoon (LISAM). Atmospheric Science Letters, 8, 51-57.
https://doi.org/10.1002/asl.150
[38] Gan, M.A., Rao, V.B. and Moscati, M.C. (2006) South American Monsoon Indices. Atmospheric Science Letters, 6, 219-223. https://doi.org/10.1002/asl.119
[39] Raia, A. and Cavalcanti, I.F.A. (2008) The Life Cycle of the South American Mon-soon System. Journal of Climate, 21, 6227-6246.
https://doi.org/10.1175/2008JCLI2249.1
Submit or recommend next manuscript to SCIRP and we will provide best service for you:
Accepting pre-submission inquiries through Email, Facebook, LinkedIn, Twitter, etc. A wide selection of journals (inclusive of 9 subjects, more than 200 journals)
Providing 24-hour high-quality service User-friendly online submission system Fair and swift peer-review system
Efficient typesetting and proofreading procedure
Display of the result of downloads and visits, as well as the number of cited articles Maximum dissemination of your research work