Modeling and Analysis of Ladder-Network Transmission
Lines with Capacitive and Inductive Lumped Elements
Ana Flávia G. Greco, Joaquim J. Barroso, José O. Rossi
Associated Plasma Laboratory, National Institute for Space Research (INPE), São José dos Campos, Brazil. Email: [email protected]
Received March 2nd,2013; revised April 5th, 2013; accepted April 17th, 2013
Copyright © 2013 Ana Flávia G. Greco et al. This is an open access article distributed under the Creative Commons Attribution Li-cense, which permits unrestricted use, distribution, and reproduction in any medium, provided the original work is properly cited.
ABSTRACT
This paper examines the properties of wave propagation in transmission lines with periodic LC and CL cells, taking into account ohmic losses in resistors connected in series to lumped capacitors and inductors. First order time differential equations are derived for current and charge, thus allowing analysis of transient regimes of the lines being excited by a pulse of arbitrary shape. In particular we examine the propagation characteristics of periodic lines in which identical unit cells are repeated periodically and also discuss the interpretation of positive and negative phase velocities associ-ated with the LC and CL topologies. Loss effects on the propagation bandwidths of both lines are also discussed, and it is shown that in the left-handed transmission line (CL configuration) the phase advance of the crest of the transmitted signal with respect to the source signal is due to the intrinsic dispersive nature of the CL line which, in contrast to the LC line, is highly dispersive at low propagation factors.
Keywords: Transmission Lines; Right-Handed (RH); Left-Handed (LH); Backward Wave; Metamaterials
1. Introduction
Characterized by negative constitutive parameters (elec-tric permittivity and magnetic permeability) metamaterial [1-3] is an artificially produced material which exhibits properties not found in nature. Such materials are often referred to as LH (left-handed) media to express the fact that they permit propagation of electromagnetic waves with the electric field, the magnetic field and the propa-gation vector forming a left-handed triad, in contrast to conventional materials in which the triad of these three vectors follows the right-hand rule. However, showing losses and having operation limited to narrow frequency bands, it was soon found that such resonant structures, such as split-ring resonators, become difficult to imple- ment for microwave applications [4,5]. But as early as 2002, there has been proposed [6-9] the use of transmis- sion lines—structures that are not resonant, low-lossy and allows wide frequency range of operation—to im- plement and put into practice the concept of metamateri- als [10-12].
From the above, this paper examines the properties of wave propagation in transmission lines with periodic CL cells (C and L denoting the series capacitance and shunt inductance in each cell). As will be discussed, such a CL
line exhibits a characteristic of left-handed (LH) medium in that the phase velocity is negative, namely, with direc- tion opposite to the group velocity. In a comparative study, an analysis is made of its dual line LC (L and C denoting the shunt capacitance and series inductance in each cell). To this end, by assigning the charge in the capacitor and the current flowing in the inductor as state variables, first order time differential equations are de- rived for a general CL line and its dual configuration LC. The equations so derived allow the transient analysis of the lines being excited by a pulse of arbitrary shape. We also investigate the properties of propagation in the steady state sinusoidal regime and examine the disper- sion characteristics of lossy lines by identifying the fre- quency bands and group delay in the frequency range 100 kHz to 1 MHz.
2. Circuit Equations
2.1. Line LC
Figure 1(a) shows a generalized LC line, where the as-signed state variables are the loop current Ik in a generic
section k and the corresponding charge Qk stored in the
equations are all first order. The line is further assumed to be lossy, where each inductor has an associated resis-tance rL,k, each capacitor has a resistance rC,k and the
generator has a resistor rs.
On the basis of Kirchhoff’s laws of voltage and current, we then arrive at a generalized transmission-line equation that applies for any number N of sections k. For the LC line, the circuit equations are written for three categories of sections: starting, intermediate, and ending sections.
Starting section:
, 1 , 1 1 d d d d L kk s s
k k
k k k
C k k k
k k
k k
k k
r
I V r
I I
t L L L
r Q Q
I I L L Q I t k
C (1)
where k = 1 and Vs is the input voltage, which may be a
sinusoidal signal or a pulse of arbitrary shape (trapezoi-dal, triangular, etc.).
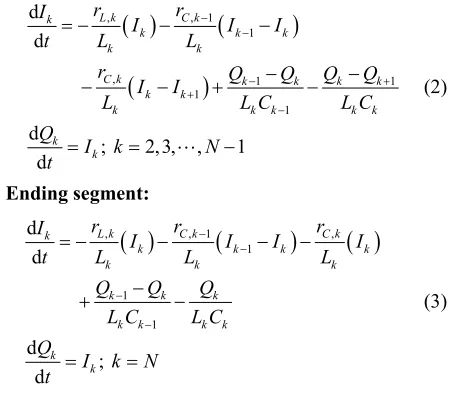
Intermediate segment:
, , 1
1
, 1 1
1
1
d d
d
; 2,3, , 1 d
L k C k
k
k k k
k k
C k k k k k
k k
k k k
k k
r r
I
I I I
t L L
r Q Q Q Q
I I
L L C L
Q
I k N
t
kCk
(2)
Ending segment:
, , 1 ,
1 1 1 d d d ; d
L k C k C k
k
k k k
k k k
k k k
k k k k
k k
r r r
I
k
I I I I
t L L L
Q Q Q
L C L C
Q
I k N t (3)
2.2. Line CL
Unlike the previous case, in the CL topology (Figure 1(b)) the state-variable current flows in the shunt branch L-rL of each section, so that that the CL line is described
by a pair of equations:
1 d d d d Nk s s L
k k k
j
k k k
k k
I V r r
k
I I Is Qs
t L L L
Q I t
(4)where Isk and Qsk are recursive functions defined as
1 mult , with 0 0
N
k k j
j k
Is Is k I Is
(5)
1 , with 0 0
den N j j k k k Q
Qs Qs Qs
k
in which mult
k is the k-th element of the array
rc j, Lk,j1,N
and the denominator term den
k is the k-th element of
L C jk j, 1,N
as detailed in the Appendix.3. Dispersion Relations
3.1. Line LC
To analyze the steady-state sinusoidal regime of a
peri-odic line with elements , , and
k
, ,
C k C L k L k
r r r r C C L L, we consider the spatial and temporal variations in the form expi
t n
, where n x p , with x denoting the position of a node with respect to the source at x = 0, p representing the hypothetical length of the unit cell; is the propagation factor, a complex quantity which quantifies the attenuation and phase shift across each cell. Then the voltage and current equations for the LC line (Figure 1(a)) are
i
1 1 1
1 e
k k
k k k k C k k C
k k k
k k k L k
CU Q
U V I I r V I r
Q I I
V V LI r I
(6)
where Uk is the voltage across the shunt capacitor of the
k-th section. Noting that the time derivate of the currents Ik is Ik iIk, from the assumption of time-harmonic
variation, and i
1 e
k k
I I
, from the periodic boundary
conditions, Equation (6) takes the form
i i
1 e 1 i i
e 1 i
k C
k k L
k
I r C CV
V I r L
(7)
(a)
[image:2.595.64.294.355.561.2](b)
which leads to the dispersion relation
2
2
i
4sin 2 1 i
a b
(8)with 0, 0 1 LC a r Z b r Z, L 0, C 0,and
0
Z L C.
For a lossless LC line (a = 0, b = 0), Equation (8) re-duces to
2 4sin2 2
(9) where the propagation factor β is real for 20 and becomes complex, when 20 as illustrated by the blue curves in Figure 2. In this plot, both the attenuation and phase shift per section are normalized to π; for ex-ample at 01, the phase shift per section is read as 0.331π. Having no cutoff frequency, the RH periodic line exhibits the behavior of a low-pass filter. Propagation starts from zero frequency until the critical frequency
0
2
c
with no attenuation, as demonstrated by verti-cal branch of the dashed blue line ranging from ω = 0 to
ωc. But for lossy lines, attention coexists at all frequen-
cies since the attention curves bend rightwards. In addi- tion for frequencies up to c0 the RH line behaves as nondispersive medium, in which the propagation fac-tor Re
is a linear function of frequency.3.2. Line CL
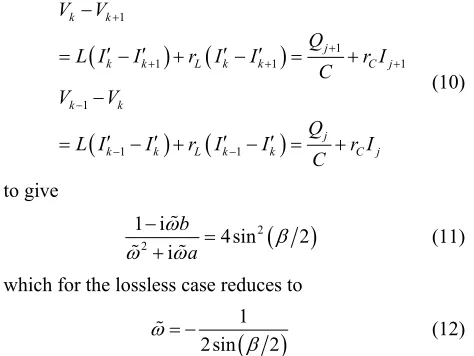
Analogously to the previous case, the voltage and current equations for the CL line (Figure 1(b)) are written as
1
1
1 1
1
1 1
k k
j
k k L k k C j
k k
j
k k L k k C j
V V
Q
L I I r I I r I
C
V V
Q
L I I r I I r I
C
1
(10)
to give
2 21 i
4sin 2
i b
a
(11) which for the lossless case reduces to
1 2sin 2
(12)
The presence of the negative signal (coming from the ambiguity of ± square root sign) is justified by examining Equation (12) in the limit 1, which leads us to
1 LC
[image:3.595.308.537.85.263.2] [image:3.595.309.537.351.536.2] , where p
Figure 2. Dispersion/attenuation diagram for the LC line. In lossy lines
a b, 0 , propagation and attenuation coexist at
all frequencies. In the horizontal axis, the attenuation Im
(dashed curves), and phase shift per section Re
(solid curves) are both normalized to π.Figure 3. Dispersion/attenuation diagram for the CL line.
gives i i i 1
C L LC
in the limit 1.
is the propagation con-stant of this CL line of concentrated elements. But from the theory of transmission lines [13], we know that iβ, relates to the line immittances by i ZY. The pre-sent case, in which Z 1
iC
and Y 1
iL
, [image:3.595.55.292.450.628.2]at gigahertz frequencies [14].
4. Results
The following results refer to signals which propagate in the periodic LC and CL lines driven by a purely sinusoi-dal signal with 1-V amplitude.
Figure 4 shows the time variation of signals
propa-gating in a low loss CL line
of twenty sections with L = 1 H, C = 1 F and being excited by a signal of 250 kHz. Black, red, green and blue curves correspond to the nodes #0, #1, #3 and #5, where the signals are calculated. Note that the blue signal (node #5) reaches the positive peak
before the other signals at the preceding positions {0, 1 and 3} closer to the exciting source. This is the phenomenon of phase advance in a CL line, and clearly apparent by the peak position at 3 s in the blue curve, before the other signals, which only reach their respective peaks after 3.5 s. Similar situation is displayed in Figure 5 showing the time variation of signals propagating in a lossy line CLs LC CL and excited by a signal of 200
kHz. We note that the signals distort themselves early in time (t < 2 s) so as to occur a pulse sequence of de-creasing order {5, 3, 1, 0} at a time later to 8 s, when all signals turn out to follow sinusoidal variation. In Figure 5, the time difference between the crests of signals #5 and #0, t0 = 11.21 µs and t5 = 7.94 µs, namely, ∆t = −3.27 µs, relates to the phase factor through
rs rLC rCL 0.001 3 μs
t
r r r 0.05
t n
,
where n is the number of sections between two given nodes. From Figure 3, at 0200 159 1.26 one reads π 0.26; then substituting n = 5 and f = 200 kHz (driving signal frequency) into t
π
2f n gives 3.25 µs, in excellent agreement with the time dif-ference ∆t = −3.27 µs directly measured from Figure 5.Figure 4. Voltage signals at nodes 0, 1, 3, and 5 in a low-loss, twenty-section CL line (rs = rLC = rCL = 0.001 , L = 1 H, C = 1 F, resonance frequency f0 = 159.0 kHz) driven by a
sinusoidal signal of 250 kHz.
Figure 6 shows the time variation of signals propa-gating in a low-loss
rs rLC rCL 0.001
0.05
s LC CL
r r r
LC line with twenty sections, with immittances L = 1 H, C = 1 F and excited by a sinusoidal signal of 50 kHz. Black, red, green and blue curves correspond to the nodes #0, #1, #3 and #5. It appears that the phase velocity is positive, and the phase delay in the low-loss LC line is clearly indicated by the relative position of the peaks, where the blue signal, for example, reaches a peak in the first 10 s after the signals 0, 1 and 3 have reached their respective
peaks. In a lossy LC line
ex-cited by a 20 kHz signal (Figure 7) it is noted that the same blue pulse (node #5) has the smallest amplitude in the sequence of pulses {0, 1, 3, 5}.
5. Conclusions
A system of time-varying ordinary differential equations
Figure 5. Voltage signals at nodes 0, 1, 3, and 5 in a lossy CL line of twenty sections (rs = rL = rC = 0.05 , L = 1 H, C = 1 F, f0 = 159.0) driven by a 200 kHz sinusoidal signal.
Figure 7. Voltage signals at nodes 0, 1, 3, and 5 in a LC lossy line excited by a sinusoidal signal of 20 kHz.
for lumped-element transmission lines has been derived and solved with given initial conditions for the distributions of charge of the capacitors and the fluxes through the in-ductors.
We have investigated propagation phenomena in trans- mission lines consisting of LC and CL cells. By taking the inductor current and the charge stored in the capacitor as state variables, a system of first order equations has been derived for each topology of time (LC and CL) and nu-merically solved using the Mathematica software [15]. Considering both low-loss and lossy lines, in which iden-tical inductors and capacitors are repeated periodically in each section, we have examined the transient and satura-tion processes which occur in the signals when excited by a sinusoidal source, thus clearly demonstrating the phase advance of signals that propagate in the CL line.
Arising from the periodicity of the lumped elements, a lossless CL line exhibits a sharp cutoff frequency at
which originates a low-frequency band gap. Loss effects, however, make the gap disappear, such that the propagation curve turns out to be continuous and the bandwidth is enlarged, but at the expenses of high losses. On a complementary way, loss effects on LC lines decrease the passband, as demonstrated by the propaga-tion/attenuation diagram in which energy dissipation starts to become significant for frequencies below the critical frequency
Re π
0
2
c
of the lossless LC line. Finally we note that certain application of transmission lines demand a large number of cells, such as soliton excitation in nonlinear transmission lines typically re-quiring 500 cells, which may constitute a cumbersome task the drawing and wiring of 500 LC sections in SPICE-type circuit simulators [16]. On the other hand, a very large number of LC cells and their variant topolo-gies are easily dealt with the mathematical formulation embodied in the system of differential equations.
6. Acknowledgements
Ana Flávia G. Greco thanks the Coordination for the Improvement of Higher Level Personnel (CAPES/Brazil) for financial support.
REFERENCES
[1] The News and Editorial Staffs, “Breakthrough of the Year: The Runners-Up,” Science, Vol. 302, No. 5653, 2003, pp. 2039-2045. doi:10.1126/science.302.5653.2039
[2] V. Veselago, “The Electrodynamics of Substances with Simultaneously Negative Values of ε and µ,” Soviet Phys- ics Uspekhi, Vol. 10, No. 4, 1968, pp. 509-514.
doi:10.1070/PU1968v010n04ABEH003699
[3] R. A. Shelby, D. R. Smith and S. Schultz, “Experimental Verification of a Negative Index of Refraction,” Science, Vol. 292, No. 5514, 2001, pp. 77-79.
doi:10.1126/science.1058847
[4] C. R. Simovski, P. A. Belov and H. Sailing, “Backward Wave Region and Negative Material Parameters of a Structure Formed by Lattices of Wires and Split-Ring Resonators,” IEEE Transactions on Antennas and Pro- pagation, Vol. 51, No. 10, 2003, pp. 2582-2591.
doi:10.1109/TAP.2003.817554
[5] E. Ozbay, K. Aydin, E. Cubukcu and M. Bayindir, “Transmission and Reflection Properties of Composite Double Negative Metamaterials in Free Space,” IEEE Transactions on Antennas and Propagation, Vol. 51, No. 10, 2003, pp. 2592-2595. doi:10.1109/TAP.2003.817570 [6] C. Caloz and T. Itoh, “Transmission Line Approach of
Left-Handed (LH) Materials and Microstrip Implementa- tion of an Artificial LH Transmission Line,” IEEE Transactions on Antennas and propagation, Vol. 52, No. 4,2004, pp. 1159-1166. doi:10.1109/TAP.2004.827249 [7] C. Caloz and T. Itoh, “Electromagnetic Metamaterials:
Transmission Line Theory and Microwave Applications,” Wiley, New York, 2004.
[8] G. V. Eleftheriades, A. K. Iyer and P. C. Kremer, “Planar Negative Refractive Index Media Using Periodically L-C Loaded Transmission Lines,” IEEE Transactions on Mi- crowave Theory and Techniques, Vol. 50, No. 12, 2002, pp. 2702-2712. doi:10.1109/TMTT.2002.805197
[9] G. V. Eleftheriades and K. G Balmain, “Negative-Re- fraction Metamaterials,” IEEE Press-Wiley, New York, 2005.
[10] C. Caloz and T. Itoh, “Lossy Transmission Line Metama- terials,” Microwave and Optical Technology Letters, Vol. 43, No. 2, 2004, pp. 112-114. doi:10.1002/mop.20392 [11] A. Alù, F. Bilotti and L. Vegni, “Analysis of L-L
Trans-mission Line Metamaterials with Coupled Inductances,” Microwave and Optical Technology Letters, Vol. 49, No. 1, 2007, pp. 94-97. doi:10.1002/mop.22028
[12] S. Sheng, P. Wang and C. K. Ong, “Compact Tunable Periodically LC Loaded Phase Shifter Using Left-Handed Transmission Line,” Microwave and Optical Technology Letters, Vol. 51, No. 9, 2009, pp. 2127-2129.
[15] Wolfram Research, “Mathematica v. 5.0.” http://www.wolfram.com
[13] S. Ramo, J. R. Whinnery and T. Van Duzer, “Fields and Waves in Communication Electronics,” Wiley, New York,
1965, p. 45. [16] Altinum Limited, “Circuit Maker 2000.” http://altinum.com
[14] H. Yoon, K. Y. M. Yeung, V. Umansky and D. Hm, “A Newtonian Approach to Extraordinarily Strong Negative Refraction,” Nature, Vol. 488, No. 7409, 2012, pp. 65-69. doi:10.1038/nature11297
LC line: equation for the ending section
Appendix
We present in this appendix the equations implemented in the Mathematica software to the solution of differential equations that describe the temporal behavior and propa- gation of voltage and current signals in the LC (right- handed) and CL (left-handed) periodic lines.
LC line: equation for the starting section
Table i i
i i 1
1 i , i , ,1,1 eqi
Vs t Rs
k t k t
Ls k Ls k
Rc k
k t k t
Ls k
q k t q k t
fN
Ls k Cs k
Rl k
k t q k t
Ls k k t k fN
1Table i i 1 i
1 1 i i , i , , , eqf Rc k
k t k t k t
Ls k
q k t q k t fN
Ls k Cs k
Rc k q k t
k t fN
Ls k Ls k Cs k
Rl k
k t q k t Ls k
k t
k NN NN fN
CL line: recursive functions for current and charge
LC line: equation for the intermediate section
1Table i i 1 i
1
1
i i 1
1
i ,
i
, , 2, 1 ;
eqs
Rc k
k t k t k t
Ls k
q k t q k t fN
Ls k Cs k Rc k
k t k t
Ls k
q k t q k t fN
Ls k Cs k Rl k
k t q k t Ls k k t k NN fN
denq Table , ,1, ;
multi Table , ,1, ;
_ : 1
denq _ : 1 multi
NN j k
NN j k
Ls k Cs j j NN
Rc j
j NN
Ls k
q j t
Qs k Qs k fN
k
Is k Is k k i j t
CL line: general equations for currents and charges
1 Table i , i ,1, NN j eqsVs t Rs
k t i j t
Ls k Ls k
Rl k
i k t Is k Qs k q k t
Ls k k t k NN fN
The initial conditions used are Ik
0 0 and
0 0k