Effect of Metabolic Reactions on Thermoregulation in
Human Males and Females Body
Saraswati Acharya1*, D. B. Gurung1, V. P. Saxena2
1Department of Natural Sciences (Mathematics), School of Science, Kathmandu University, Kathmandu, Nepal 2Sagar Institute of Research and Technology, Bhopal, India
Email: *saraswati_acharya2000@yahoo.com
Received January 21, 2013; revised April 23, 2013; accepted April 30, 2013
Copyright © 2013 Saraswati Acharya et al. This is an open access article distributed under the Creative Commons Attribution Li-cense, which permits unrestricted use, distribution, and reproduction in any medium, provided the original work is properly cited.
ABSTRACT
The paper describes the study of metabolic effect relying on dermal thicknesses of males and females for temperature distribution of the layers of dermal part at various atmospheric temperatures. The study has been carried out for one dimensional steady and unsteady cases using finite element method. Lower percentage of muscle mass and higher per-centage of adipose tissue in subcutaneous part of females result lower metabolic rate compared to males. Metabolism is considered as a heat source within the body tissue. The appropriate physical and physiological parameters together with suitable boundary conditions that affect the heat regulations have been incorporated in the model.
Keywords: Finite Element Method; Pennes Bio-Heat Equation; Dermal Parts
1. Introduction
The human thermoregulatory is more complicated and incorporates more control principles than any actual technical control system. It behaves mathematically in a high nonlinear manner and contains multiple sensors, multiple feedback loops and multiple outputs.
Human are homeotherms as well as endotherms. In hot or cold regions thermoregulation is an evident in the form of sweating and shivering. The principles of heat transfer can be applied to the human body in order to determine how the body transfers heat. Heat is produced in the body by the continuous metabolism of nutrients which provides energy for the systems of the body and exchange heat with the environment (mainly by radiation and convection) and loses heat by evaporation of body fluids. The human body must maintain a consistent in-ternal temperature in order to maintain healthy bodily functions. Therefore, excess heat must be dissipated from the body to keep it from overheating. When a person engages in elevated levels of physical activity, the body requires additional fuel which increases the metabolic rate and the rate of heat production. The body must then use additional methods to remove the additional heat produced in order to keep the internal temperature at a healthy level.
Thermal sensations are different among people even in
the same environment. Even though the sensors render the same result regardless to the geographical position where the measurement being taken. This is not the case for persons. Indeed persons staying in very similar spaces subjected to the same climate and belonging to the com-mon culture, issue very different opinions on thermal behavior due to the combination of large number of fac-tors that affect the perception of human beings. Subject’s diagnosis is therefore an indispensable tool to achieve an overall evaluation of the study parameters. There is really no absolute standard for temperature in human body. In general temperature occurs within narrow ranges. Tem-perature also depends on behavioral action such as alter-ing clothalter-ing, alteralter-ing activities posture or location, chang- ing the thermostatic setting, opening windows, com- plaining or leaving a space.
When measuring metabolic rates, many factors have to be taken into account. Each person has a different meta-bolic rate, and these rates can fluctuate when a person is performing certain activities or under certain environ- mental conditions. Even people who are in the same room can feel significant temperature differences due to their metabolic rates, which makes it very hard to find an optimal temperature for everyone in a given location. Food and drink habits may have an influence on meta-bolic rates, which indirectly influences thermal prefer-ences. These effects may change depending on food and
drink intake. Body shape is another factor that affects thermal preference. Heat dissipation depends on body surface area. A tall and skinny person has a larger sur-face-to-volume ratio, can dissipate heat more easily and can tolerate higher temperatures than a more rounded body shape [1,2].
Females differ from males in thermal responses to ex-genous heat load and heat loss as well as to endoex-genous heat load during exercise because they usually have a large ratio of body surface to body mass, a greater sub-cutaneous fat content and lower exercise capacity. Also females’ sweating response to heat load is smaller than that of males but they are able to maintain their core body temperature on a similar level to that of males as a result of greater evaporative efficiency of sweating. Also the changing rate of sex hormone release during the menstrual cycle and ovulation periods modifies thermo-regulation in females. So there are differences in body temperature and thermal responses to positive or negative heat loads depending on the phase of cycle and pre and post ovulation period [3].
The male sex hormone testosterone can increase the metabolic rate about 10% - 15%. But the female sex hor- mone estrogen may increase the metabolic rate a small amount but usually not enough to be significant. Males usually have higher metabolic rate than that of females of the same age because males tend to have a higher pro-portional of lean body mass than female of the same age. Conversely, females tend to have a higher proportional of fat cells and fat cells have a lower metabolic rate than lean muscle cells. But metabolic rate increases during pregnancy and lactation due to high energy requirement of producing fetal tissues than breast milk [4].
Metabolism is the total of all the chemical processes that occur in the cells of a body. It consists of anabolism in which molecules are built-up and catabolism in which enzymes break down the food consumed through hy-drolysis and at the cellular level involves the process of phosphorolysis. Metabolism involves the chemical proc-esses in the body in which energy is transferred between various chemical compounds and in which thermal en-ergy is generated. If the rate of metabolic reactions in-creases, then the rate of energy generation also increases. In general females have a metabolic rate about 5% - 10% lower than males. The relationships for metabolic rate between human males and females dermal parts for two metabolic levels are shown in Figure 1.
Heat transfer problems are related in various discipline including biomedical sciences and have a role both in treatment and diagnosis. They can aid in predicting the time in the course of treatment or giving information on the temperature where thermometry is lacking. Though heat transfer in biological involves metabolic heat gen-eration, conduction, convection, radiation, evaporation
58 52 744
707
0 100 200 300 400 500 600 700 800
Males Females
Low level
[image:2.595.337.510.83.252.2]Average level
Figure 1. Two metabolic levels (w/m3) of human males and females [1,5].
and blood perfusion in human tissue but all physiological function generates heat by means of metabolic reaction in biological systems. The balance between the heat gen-eration and loss from the body to the environment is very important to maintain body core temperature. Any phy- siological abnormality will disturb the homeostatic con- ditions for the temperature. Therefore the study of heat transfer under normal and abnormal conditions will be useful for various clinical conditions.
In this paper, we have developed a model with effect of metabolic reactions on thermoregulation in human males and females. For this we have assumed linear shape function for the temperature in each layer depend-ing on the thickness of layers of dermal part. The thick-nesses of layers have been measured perpendicularly from the outer surface towards the body core. Pennes bioheat equation is used considering the suitable physical and physiological parameters that affect the heat regula-tion in the layers. Computer simularegula-tion has been used for numerical results and graph of the temperatures profiles.
2. Mathematical Model
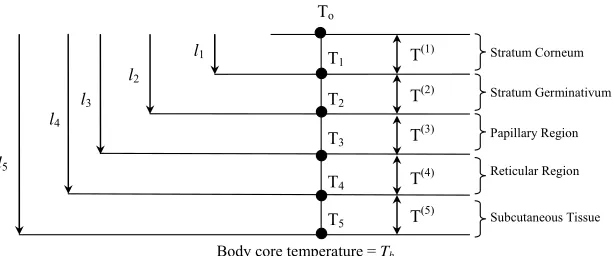
Skin membrane can be examined at various levels of complexity. In mathematical treatments of temperature distribution in dermal layers, the membrane can be re-garded as a physical and physiological barrier with com-plex structure. Schematic diagram of temperature distri-bution model in the layers of dermal parts of human body is as shown in Figure 2.
The thickness of stratum corneum, stratum germinati-vum, papillary region, reticular region and subcutaneous tissue have been considered as
5 4
1, 2 1, 3 2, 4 3,
l l l l l l l l l respectively and T T T0, ,1 2, ,T T3 4 and T5 Tb are
the nodal temperatures at a distances x0,xl x1, l2,
3, 4
xl xl and xl5. be the
tem-perature function in the layer stratum corneum, stratum
i ,
T i1, 2,3, 4,5
l1
l2
l3
l4
l5
T1
T2
T3
T4
T5
To
T(1) T(2)
T(3)
T(4)
T(5)
Stratum Corneum
Stratum Germinativum
Papillary Region
Reticular Region
[image:3.595.145.452.84.212.2]Subcutaneous Tissue Body core temperature = Tb
Figure 2. Schematic diagram of five layers of dermal part.
where, S is the metabolic heat generation rate per unit
volume. germinativum, papillary region, reticular region and sub-
cutaneous tissue respectively.
Now combining the Equations (1.3), (1.4) and (1.5) in the right of Equation (1.1), we get
Heat regulation in human body is characterized by blood flow in the blood vessels, metabolism and the con- duction in tissue. The processes that govern the heat transfer in in-vivo tissue of human body at rest are
perfu-sion, diffusion and metabolic heat generation. Thus the rate of change in total heat (Q) in a tissue element with
respect to time t can be symbolically expressed as [6].
b b b
a
T
c K T w c T T
t
S
(1.6)
where, and c are tissue density and tissue specific
heat respectively.
The Equation (1.6) is the bio-heat equation suggested by Pennes’ in 1948.
perfusion diffusion metabolic
Q Q Q Q
t t t t
(1.1) If the body is exposed to the environment then the transfer of heat between the skin surface and environ- ment is due to conduction, convection, radiation and eva- poration. So the mixed boundary condition under study is given by
The rate of heat exchange in tissue element due to per-fusion is based on Fick’s law of perper-fusion and it is given by
perfusionb b b a v
Q
c T T
t
(1.2)
skin surface
T
K h T T
x
LE (1.7)
where, and Tv are blood density, blood
specific heat, blood flow per unit volume of tissue per second (blood perfusion rate), arteriole blood tempera-ture, venular blood temperature respectively. We take
, and then Equation (1.2) can be written as
, , , ,
b c w Tb b a
v
T T
where are combined heat transfer coefficient due to convection and radiation, atmospheric temperature, latent heat of evaporation, rate of sweat evaporation and
, , ,
h T L E T
x
is the partial derivative of T along the normal to the
perfusion
b b b a
Q
c T T
t
(1.3) skin surface. Also the human body maintains its core temperature at a uniform temperature at 37˚C. Therefore, the boundary condition at the inner boundary is generally taken asThe rate of heat exchange in tissue element due to dif-fusion is based on Fourier’s law of conduction and it is
given by
5 b 37 C
T l T (1.8)
diffusionQ
K T t
(1.4) where, Tb is the body core temperature and l5 is the total thickness of skin and subcutaneous tissue.where, K is the thermal conductivity of local tissue.
3. Solution of the Problem
The rate of heat exchange in tissue element due tometabolic heat generation is given by
Using Euler-Lagrange formula in Equations (1.6) and (1.7), we get, following variational integral form of bio- heat Equation [7,8]
metabolic
Q
S t
(1.5)
2 2
2 2
0
1 1
2 d
2 2
l
a
T T
2
I K M T T ST c x h T T L
x t
where, is the thickness of the skin and subcutaneous tissue and
l
b b b
M c .
The anatomical structure of human dermal part makes it reasonable to consider M and S zero in stratum
corneum. In the model, the thermal conductivity in the layers of dermal part is considered as constant. All the assumptions for parameters in the layers of dermal part can be summed up as:
Quantity I T Ta K M S
Outer Boundary T0
Stratum Corneum 0 x l1 I1
1 1 0
1 0
T T T x
l T
1 0
a
T 1
K M 1 0 S 10
Stratum Germinativum l1 x l2 I2
2 2 1 1 2 2 1
2 1 2 1
l T l T T T
T x
l l l l
Ta 2 0
2
K M 2 0 2 1
4 1 x l S s l l
Papillary Region l2 x l3 I3
3 3 2 2 3 3 2
3 2 3 2
l T l T T T
T x
l l l l
3
a b
T T 3
K 3 2
4 2 x l M m l l
3 1
4 1 x l S s l l
Reticular Region l3 x l4 I4
4 4 3 3 4 4 3
4 3 4 3
l T l T T T
T x
l l l l
4
a b
T T 4
K 4 2
4 2 x l M m l l
4 1
4 1 x l S s l l
Subcutaneous Tissue l4 x l5 I5
5 5 4 4 5 5 4
5 4 5 4
l T l T T T
T x
l l l l
5
a b
T T 5
K M 5m S 5 s
We write I separately for the five layers: I1 for stratum corneum, I2 for stratum germinativum, I3 for papillary region, I4 for reticular region and I5 for subcutaneous tissue as 5 1 i i I I
(1.10) Evaluating the integral with the help of layers wise assumptions, we get the following system of equations given below, 1, 2, ,
i
I i 5
2 2
1 1 1 0 1 0 1 1 1 0 1 2 2
0 1 0 1
d d
I A B T D T E T F T T
T T T T
t
2 22 2 2 1 2 2 2 1 2 2 2 1 2 2 2
1 2 1 2
d d
I A B T C T D T E T F T T
T T T T
t
2 23 3 3 2 3 3 3 2 3 3 3 2 3 2 2
2 3 2 3
d d
I A B T C T D T E T F T T
T T T T
t
2 24 4 4 3 4 4 4 3 4 4 4 3 4
2 2 3 4 3 4 d
d
I A B T C T D T E T F T T
T T T T
t
2 25 5 5 4 5 5 5 4 5 5 5 4 5
2 2 4 5 4 5 d
d
I A B T C T D T E T F T T
T T T T
t
where A B D E Fi, , , , ,1i i i i i 5 and are
all constants depending upon the value of physical and physiological parameters of dermal layers.
, 2 5
j
C j
We differentiate systems of linear equations with re-gard to the nodal temperatures T T T T T0, , , ,1 2 3 4 and T5 and set d 0, 0,1, 2, , .
d j j 3
I
T 4 Since T5Tb (the body
core temperature), we get the system of equations in ma-trix form:
C TPT W (1.11)
where,
0 1 2 3 42 0 0 0
2 0 0
0 2 0 ,
0 0 2
0 0 0 2
1 1
1 1 2 2
2 2 3 3
3 3 4 4
4 4
2 0 0
2 0
0 2
0 0 2
0 0 0 2
D F
F E D F
P F E D F
F E D F
F E
5
0 0 0
D
T ve the system of ordinary differential Equation
1 2 2 3 3 4 4 5 5 5 0
1 2
3 4
d d d
d
d ,
d d
d d
d
B B
W C B
T t T t T T
t T t T
C B
B F T
t
C
4. Numerical Results and Discussion
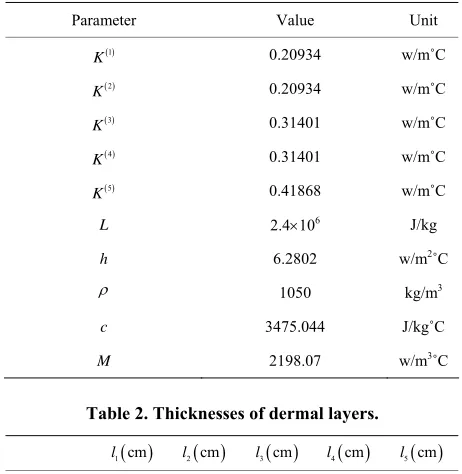
The following values of physical and physiological pa-rameters have been used as prescribed by [1,4,5,9-11] to compute the numerical results. They are tabulated as Ta- bles 1 and 2.
And, for nodal temperatures at , we are taking the equation
0
t
,
,0T x t T x px with initial skin
surface temperature 22˚C because at normal atmospheric temperatures skin surface temperature is considered 22˚C.
Table 1. Parameter values used in model.
Parameter Value Unit
1
K 0.20934 w/m˚C
2
K 0.20934 w/m˚C
3
K 0.31401 w/m˚C
4
K 0.31401 w/m˚C
5
K 0.41868 w/m˚C
L 2.4106 J/kg
h 6.2802 w/m2˚C
1050 kg/m3
c 3475.044 J/kg˚C
[image:5.595.56.287.466.703.2]M 2198.07 w/m3˚C
Table 2. Thicknesses of dermal layers.
1 cm
l l2 cm l3 cm l4 cm l5 cm
For male 0.05 0.10 0.20 0.35 0.90
For female 0.05 0.10 0.20 0.35 0.99
o sol
(1.11) we use Crank-Nicolson method. According to the method, the system of Equation (1.11) can be written as [12].
1
2 2
i i
t t
C P T C P T t
W (1.12)
where, is the time interval and 0 is
T t
the 5 1
matrix for initial nodal temperatures.
The results of the analysis for temperature distribution are presented through the graphs in the Figures 3-8 for steady state case and Figures 9-16 for unsteady state case.
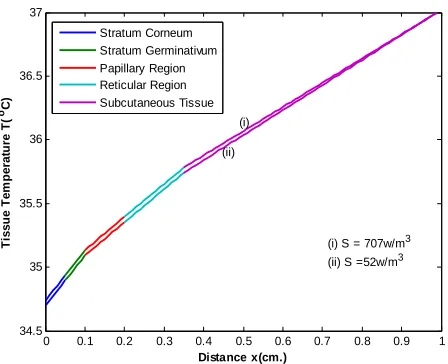
The various temperature profiles have been studied. From Figures 3 and 4 we observe that males have slightly higher tissue temperature than females at each metabolic level at T∞ = 25˚C and E = 0 kg/m2/sec. This is because
males have higher metabolic rate in comparison to fe-males. The results also suggest that there is less metabolic effect between temperature profiles (i) and (ii) at two metabolic levels in case of males due to relatively low percentage of subcutaneous fat than females. Same results we observe from Figures 5 and 6 at two metabolic levels at T∞ = 37˚C, E = 0.00004 kg/m2/sec and Figures 7 and 8
at two metabolic levels at T∞ = 45˚C, E = 0.00008
kg/m2/sec in human males and females body.
Moreover, we observe that in case of higher atmos-pheric temperatures, the effect of metabolic rate in tem-perature distribution is less in comparison to low
0 0.1 0.2 0.3 0.4 0.5 0.6 0.7 0.8 0.9 35.2
35.4 35.6 35.8 36 36.2 36.4 36.6 36.8 37
Distance x(cm.)
T
iss
u
e
T
e
m
p
erat
u
re T
(
oC)
Stratum Corneum Stratum Germinativum Papillary Region Reticular Region Subcutaneous Tissue
(i)
(ii)
[image:5.595.309.536.534.709.2](i) S = 744w/m3 (ii) S = 58w/m3
0 0.1 0.2 0.3 0.4 0.5 0.6 0.7 0.8 0.9 1 35.2
35.4 35.6 35.8 36 36.2 36.4 36.6 36.8 37 37.2
Distance x(cm.)
T
issu
e T
em
p
er
at
u
re T
(
oC)
Stratum Corneum Stratum Germinativum Papillary Region Reticular Region Subcutaneous Tissue
(i)
(ii)
[image:6.595.61.286.80.265.2](i) S = 707w/m3 (ii) S = 52w/m3
Figure 4. Temperature distribution of females at two meta-bolic level at T = 25˚C & E = 0 kg/m2/sec.
∞
0 0.1 0.2 0.3 0.4 0.5 0.6 0.7 0.8 0.9
34.5 35 35.5 36 36.5 37
Distance x(cm.)
T
issu
e T
em
p
er
at
u
re T
(
oC)
Stratum Corneum Stratum Germinativum Papillary Region Reticular Region
Subcutaneous Tissue (i)
(ii)
[image:6.595.309.534.83.267.2](i) S = 744w/m3 (ii) S = 58w/m3
Figure 5. Temperature distribution of males at two meta-bolic level at T = 37˚C & E = 0.00004 kg/m2/sec.
∞
0 0.1 0.2 0.3 0.4 0.5 0.6 0.7 0.8 0.9 1
34.5 35 35.5 36 36.5 37
Distance x(cm.)
Ti
s
s
ue
Te
m
pe
ra
tur
e
T(
oC)
Stratum Corneum Stratum Germinativum Papillary Region Reticular Region Subcutaneous Tissue
(i)
(ii)
(i) S = 707w/m3 (ii) S =52w/m3
Figure 6. Temperature distribution of females at two
meta-0 0.1 0.2 0.3 0.4 0.5 0.6 0.7 0.8 0.9
33.5 34 34.5 35 35.5 36 36.5 37
bolic level at T∞= 37˚C & E = 0.00004 kg/m2/sec.
Distance x(cm.)
T
issu
e T
em
p
erat
u
re
T
(
oC)
Stratum Corneum Stratum Germinativum Papillary Region Reticular Region Subcutaneous Tissue
(i)
(ii)
[image:6.595.61.286.302.484.2](i) S = 744w/m3 (ii) S = 58w/m3
Figure 7. Temperature distribution of males at two meta-bolic level at T = 45˚C & E = 0.00008 kg/m2/sec.
∞
0 0.1 0.2 0.3 0.4 0.5 0.6 0.7 0.8 0.9 1
33.5 34 34.5 35 35.5 36 36.5 37 37.5
Distance x(cm.)
T
issu
e T
em
p
er
at
u
re T
(
oC)
Stratum Corneum Stratum Germinativum Papillary Region Reticular Region Subcutaneous Tissue
(i)
(ii)
[image:6.595.310.536.306.486.2](i) S = 707w/m3 (ii) S = 52w/m3
Figure 8. Temperature distribution of females at two meta-bolic level at T = 45∞ ˚C & E = 0.00008 kg/m2/sec.
0 5 10 15 20 25 30
22 24 26 28 30 32 34
Time t (sec)
N
o
d
a
l t
em
p
er
at
u
re
s (
oC)
T0 T1
T2 T3
T 4
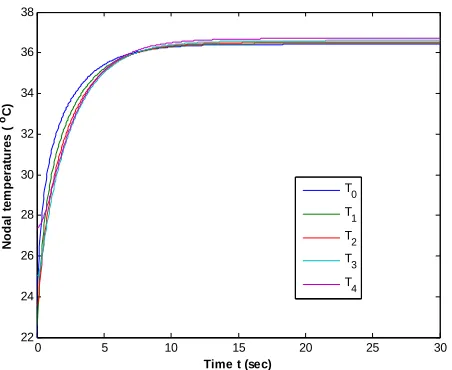
[image:6.595.62.286.521.703.2] [image:6.595.310.536.524.703.2]0 5 10 15 20 25 30 22
24 26 28 30 32 34
Time t (sec)
N
o
d
a
l t
e
m
p
er
atu
re
s
(
oC)
T 0
T 1
T2 T3
[image:7.595.62.285.84.265.2]T4
Figure 10. Nodal Temperature of females at low metabolic rate at T = 25˚C & E = 0 kg/m2/sec.
∞
0 5 10 15 20 25 30
22 24 26 28 30 32 34
Time t (sec)
N
o
d
al
t
em
p
er
at
u
res
(
oC)
T0 T1
T2 T3
[image:7.595.310.535.85.263.2]T4
Figure 11. Nodal Temperature of males at average meta-bolic rate at T = 25˚C & E = 0 kg/m2/sec.
∞
0 5 10 15 20 25 30
22 24 26 28 30 32 34
Time t (sec)
N
oda
l t
e
m
pe
ra
tur
e
s
(
oC)
T0 T1
T 2
T3 T
4
Figure 12. Nodal Temperature of females at average
meta-0 5 10 15 20 25 30
22 24 26 28 30 32 34 36 38
Time t (sec)
N
o
da
l t
e
m
p
e
ra
tur
e
s
(
oC)
T 0 T1
T 2 T
[image:7.595.60.283.306.487.2]3 T4
Figure 13. Nodal Temperature of males at low metabolic rate at T∞ = 37˚C & E = 0.00004 kg/m2/sec.
0 5 10 15 20 25 30
22 24 26 28 30 32 34 36 38
Time t (sec)
N
o
d
a
l t
em
p
er
a
tu
res (
oC)
T0
T 1 T2
T3
T 4
Figure 14. Nodal Temperature of females at low metabolic rate at T = 37˚C & E = 0.00004 kg/m2/sec.
∞
0 5 10 15 20 25 30
22 24 26 28 30 32 34 36 38
Time t (sec)
N
o
d
al
t
em
p
er
at
u
re
s
(
oC)
T 0 T1
T2
T3
T 4
[image:7.595.312.536.307.486.2] [image:7.595.312.537.528.703.2] [image:7.595.60.284.528.705.2]0 5 10 15 20 25 30 22
24 26 28 30 32 34 36
38 mis and subcutaneous tissue. The differences in the
re-sults whatsoever may be due to the extension up to five layers of dermal part having various thicknesses in males and females. The other reason may be the consideration of different metabolic rates at subcutaneous part of males and females.
Our model gives better profiles for temperature distri-bution in der
Time t (sec)
N
o
da
l t
e
m
p
e
ra
tur
e
s
(
oC)
mal layers. This is because the model has in
ibution in human der-m
[1] K. Brm, F. A he Thermoneutral
Zone: Implica dies,” Frontiers in
f a
Heterother-T0
T1
T2
T3
[image:8.595.62.288.83.268.2]T4
Figure 16. Nodal Temperature of females at average meta bolic rate at T = 37˚C & E = 0.00004 kg/m2/sec.
source of
-∞
atmospheric temperature. Shivering is the main
internal heat production when T∞ falls below 37˚C. An
increase in oxygen consumption is usually indicative of a rise in metabolic rate. Since shivering is a rapid involun-tary contraction of muscle, oxygen consumption is used as an indicator for shivering. As well we observe that at T= 25˚C, E = 0 kg/m2/sec the tissue temperature is higher than at T= 37˚C, E = 0.00004 kg/m2/sec and T
∞
= 45˚, E = 0.00008 kg/m2/sec due to excessive sweating in the body.
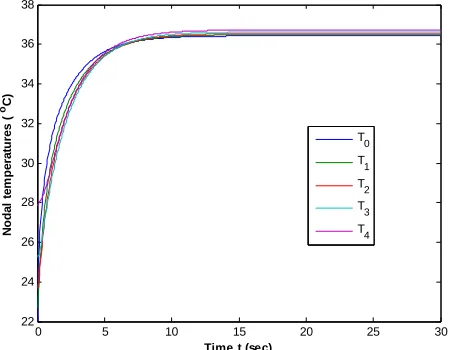
Figures 9 and 10 reveal that temperature distribution profiles for nodal temperatures Ti (i = 0, 1, 2, 3, 4) of males are higher than that of females at metabolic rates S = 58 w/m3 and 52w/m3 at T
∞ = 25˚C, E = 0 kg/m2/sec.
This is due to the fact that low percentage of subcutane-ous fat of males result high metabolic rate. Same results are exhibited from Figures 11 and 12 at average meta-bolic rates at T∞ = 25˚C and E = 0 kg/m2/sec. Figures 13
and 14, 15 and 16 at each metabolic levels at T∞ = 37˚C
and E = 0.00004 kg/m2/sec represent the same behaviors. The significance effects of metabolism are observed at low atmospheric temperatures. At low temperature the blood vessels constrict, which in turn decrease heat car-ried by the blood to the surface, causing increase the metabolic heat effect to keep the body core temperature constant These figures show that the tissue tempera-tures at high atmospheric temperatempera-tures are higher as compared to lower atmospheric temperatures. This is because the heat gain is more from the surrounding at high atmospheric temperature due to increase in tem-perature gradient in skin surface.
5. Conclusions
The results are comparable with those obtained in [10,11] who considered onl
corporated more feasible layers and has taken signifi-cant biophysical parameters in case of human males and females. After considering differences in metabolic heat production between sexes, males and females would dif-fer in their physiological responses in temperature dis-tribution. Furthermore, we observed that the thicknesses play significant role for temperatures distribution in hu-man males and females body. The thinner layers lead to higher values of skin temperature than thicker layer. Also the significant effect in temperature distribution in males and females due to metabolism is seen being thicker skin layer of females. The subcutaneous fat in females con-tribute thicker skin layers than males. But in case of same thickness of skin layers in males and females, the meta-bolic effect does not alter significantly in temperature distribution in males and females body. So the purpose of the study is to determine heat responses in body tissue due to metabolic heat production according to gender differences. The results of the above figures clearly es-tablish that such difference exists.
All of the previous developed models have not studied the gender wise temperature distr
al part. So it is still necessary for micro level study for temperature distribution model on the dermal layers of males and females. This study will help for further inves-tigation in thermal disturbances recurring in the layers of dermal part due to external thermal loads to obtain a more accurate model for further applications. The study is important for the conceptual development for thermal behaviors of skin layers practically used in bio-thermo mechanic. The work will be useful to the researcher to study the gender wise thermoregulation.
REFERENCES
jh and V. M. L. Wd, “T tions for Metabolic Stu Bioscience, Vol. 4, 2012, pp. 1975-1985.
[2] P. M Cryan and B. O. Wolf, “Sex Differences in Thermo- regulation and Evaporative Water Loss o
mic Bat, Lasiuruscinereus, during Its Spring Migration,”
Experimental Biology,Vol. 206,2003, pp.3381-3390.
doi:10.1242/jeb.00574
[3] H. Kaciuba-Uscilko and R. Grucza, “Gender Differenc in Thermoregulation,”
es Medical Research Center, Polish Academy of Sciences, Warsaw, 2001, pp. 553-556. [4] C. Guyton and E. Hall, “Text Book of Medical Physiol-
der-S. R. DiNardi, Ed., Control
Human Foream,” Journal o
al (P) Limited, New Delhi,
P. Saxena and P. R. Adhikary, “FEM
perature ogy,” Elsevier, Noida, 2009.
[5] L. W. Weber and J. T. Pierce, “The Occupational Envi-ronment: Its Evaluation,” In:
and Management, American Industrial Hygiene Associa- tion (AIHA), Fairfax, 2003.
[6] H. H. Pennes, “Analysis of Tissue and Arterial Blood
Temperature in the Resting f
App
Applied Physiology, Vol. 85, No. 1, 1948, pp. 35-41. [7] S. S. Rao, “The Finite Element Method in Engineering,”
Elsevier, Burlington, 2009.
[8] Y. V. C. Rao, “Theory and Problems of Thermodynam- ics,” New Age Internation
Meth 2000.
[9] V. P. Saxena, “Mathematics of Thermal Abnormalities in
Outer Human Body,” Anamaya Publishers, New Delhi 2005, pp. 1-26.
[10] D. B. Gurung, V.
roach to One Dimensional Unsteady State Tempera- ture Distribution in the Dermal Parts with Quadratic Shape Function,” Journal of Applied Mathematics & In-
formatics, Vol. 27, No. 1-2, 2009, pp. 301-313.
[11] D. B. Gurung, and V. P. Saxena, “Transient Tem Distribution in Human Dermal Part with Protective Lay- ers at Low Atmospheric Temperature,” International Jour- nal of Biomathematics, Vol. 3, No. 4, 2010, pp. 439-451. [12] J. N. Reddy, “An Introduction to the Finite Element
Appendix 1
1 2
1 1
1 ,
A hT B 1 1 1
2
1 1
1 1 1
2 1 2 1 2 2 2 1
1 1
2 2 2
3 3 2 3 2 1 3 2 3 2 1 3 1 2
2 2 2 2
3 2 2 3 2 3 2
1 2 3 2 3 2
3 2 4 2
, ;
1 ;
2 2
1 1
0; ; 2 ; ;
2
; ;
2 2
2 3 3 ;
4 2 2 2
4
3 ;
b
LE hT D E F
A B P C P D E F R
R R
A B P l l N l l l l l l l l
C P l l l l N l
K K K
h
l l l
T m l l
l l
l l l l
1 2 1 3
3 2 2 3
3 2 1 3 2 3 2 3 2
3 3
3 2 1 3 2 3 2 1 3 2
2
2 2
4 4 3 2 4 2 3
4 2
2 2 2 2
4 2 4 3 4 3 2 4 2 3 1 4 3 4 3 1 4 1 2 2 2
4 2 3 4 3 4 2
3 ;
1 1 3 3 ;
2 24
1 1 1
; ;
2 8 12
2 2 ;
4
2 3 3 2 3 3 ;
2 3
b
l l l
D R Q l l l l l l
E R Q l l F R Q l l
T m
A l l l l l l
l l
B P l l l l l l l l N l l l l l l l l
C P l l l l l l
2 2
3 2 4 1 3 4 3 4 1 3 1 4
3 2 2 3 2 2
4 3 2 4 3 4 3 4 3 2 4 2 3 2 3 4
2 3 2 3 2 2
4 3 2 3 4 3 3 4 4 2 4 2 3 2 3 4
2 2 3 3 2
4 3 2 3 4 3 4 4 3 2 3 4 2 4 2
3 2 3 3 ;
1 1
5 3 4 4 8 ;
2 24
1 1
5 3 4 8 ;
2 24
1
4 2 2
12
l l N l l l l l l l l
D R Q l l l l l l l l l l l l l
E R Q l l l l l l l l l l l l l
F R Q l l l l l l l l l l l l l
2
3 ;
2
5 5 4 5 3 5 4 5 3 4 5
5 4 3 5 4 3 5 4 3
2 2 3 4
2 1
1 2 3 1 2 3
4 1 4 2 2 1 3 2 4 3
5
5 4
4 1 2 3 1
5 4 3 2 4 2 4 3 4 2
1 ; ; ;
2
1 ; 1 ; .
2 2
1
; ; , ; ;
6 6 2
; ; ; ;
6 6
b
b
b
A mT l l B P l l C P l l
D R Q E R Q F R Q
s l l T m K K K
P P P T m s R R R
l l l l l l l l l l
m l l
K m m
R Q Q Q N
l l l l l l l l l l
s
2 1
3 2
4 3
5 4
14 1
; ; ; ;
2 6 6 6 6
c l l c l l c l l
c l l cl
l l
![Figure 1. Two metabolic levels (w/m3females [1,5]. ) of human males and](https://thumb-us.123doks.com/thumbv2/123dok_us/7766931.715321/2.595.337.510.83.252/figure-metabolic-levels-w-m-females-human-males.webp)