An Adaptive Battery Monitoring System for an
Electric Vehicle
Paul Sinclair, Richard Duke and Simon Round Department of Electrical Engineering University of Canterbury, Christchurch, New Zealand
s.round@elec.canterbury.ac.nz
Abstract: In electric vehicles it is important to know the state of charge of the batteries in order to prevent vehicle strandings and to ensure that the full range of the vehicle is exploited. It is also useful to know state of health information about the batteries to predict when the batteries need replacing. This paper describes a battery monitoring system that is able to calculate the state of charge and state of health of multiple batteries in a battery bank. It has been designed specifically to monitor lead-acid batteries in an electric car environment using noninvasive measurement techniques. The monitor incorporates an adaptive monitoring method, which is based on coulometric measurements when the batteries are under load and predicted open circuit voltage measurements under no-load conditions.
1. Introduction
In applications where secondary batteries are used as a power source it can be desirable to know the state of charge and the health of the batteries. State of charge information is useful as it takes the guesswork out of knowing how much longer the batteries will last during discharge and tells the user when recharging is necessary. Knowing the state of charge also helps prevent the batteries from being inadvertently over discharged.
State of charge information is particularly important in electric vehicle applications as accurately knowing the state of charge helps avoid vehicle strandings while insuring that the best use is made of the available battery capacity. State of health information is useful in determining when the battery bank has reached the end of its useful life and requires replacement.
A state of charge meter provides the electric vehicle’s equivalent of a fuel gauge in a vehicle powered by conventional fuels. In a conventional vehicle the fuel gauge reading relates directly to a
physical measurement, the level of fuel in the vehicle’s tank. It is not as easy to obtain an equivalent measurement that relates to the state of charge of the batteries in an electric vehicle. Typically several battery parameters are used to calculate the state of charge.
2. Battery Monitoring Techniques
There have been many methods proposed for measuring the state of charge of lead-acid batteries, each with varying degrees of accuracy [1,2,3]. The two main methods are coulometric, measuring the change in current, and open circuit voltage measurement when the batteries are disconnected.
2.1 Coulometric Measurements
2.2 Open Circuit Voltage Measurements
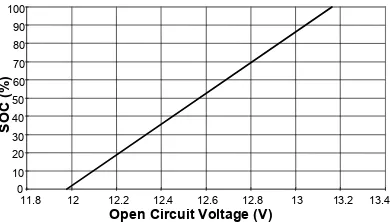
The open circuit voltage of a sealed lead-acid battery also relates directly to the battery’s state of charge as shown by Figure 1. This method of obtaining the state of charge is more suited to automated battery monitoring since it can be measured directly from the battery terminals and does not require the battery to be modified or have sensors implanted in it.
70 80 90 100
11.8 12 12.2 12.4 12.6 12.8 13 13.2 13.4
Open Circuit Voltage (V)
SOC (
%
)60
[image:2.612.314.520.158.281.2]50 40 30 20 10 0
Figure 1: Typical relationship between open circuit voltage and state of charge (A212 Dryfit Battery)
The open circuit voltage must stabilise before a reliable measurement can be made. This can take from half an hour to several hours depending on the type of battery. This drawback combined with the fact that the load must be disconnected for measurements to be made, means that this method cannot make continuous measurements while the load is connected. It does however give a state of charge that relates to the chemical state of the battery rather than battery models and hence will give an accurate estimate of battery state of charge even with an aged battery.
The problem associated with the long stabilisation period of the open circuit voltage can be overcome by making a prediction of the open circuit voltage a short time after the load has been disconnected from the battery. Figure 2 shows a typical open circuit recover characteristic. An initial open circuit voltage VO
is measured and then over a short time the slope of the voltage recovery (M) is calculated. The point (Xp) at which the slope crosses the fully
stabilised open circuit voltage can be experimentally determined. It has been found to be reasonably constant with both the type of battery and the state of charge, although batteries
with gelled electrolytes tend to have larger values of Xp since they typically take longer to reach this
point. The final open circuit voltage can then be predicted using Equation (1).
12.24 12.29 12.34 12.39 12.44 12.49 12.54 12.59 12.64 12.69
-1.0 -0.5 0.0 0.5 1.0 1.5 2.0 2.5 3.0 3.5
Open C
irc
u
it
Vo
ltage
(V)
Voc
Xp
X=log(t) with t in minutes
Figure 2: Approximation of the open circuit recovery characteristic with 80% remaining capacity.
Voc = M X. p +Vo (1)
2.3 Adaptive Monitoring
Of the above methods, the coulometric method is the most useful as it gives a continuous estimate of the state of charge while the load is connected. It is however prone to accumulate errors over time and as the batteries age. These shortcomings can be overcome by correcting these errors using state of charge predictions from open circuit voltage measurements after the load has been disconnected. This is achieved by comparing the open circuit voltage estimate to the last value obtained from the coulometric method. An error correction factor can be generated from the difference between the two values, which can be used to correct the coulometric measurements during the next discharge.
2.4 Distance Prediction
[image:2.612.99.294.228.339.2]value should be frequently updated while the vehicle is in use. The remaining distance can be calculated by multiplying this value by the state of charge. To prevent anomalies occurring in the predictions when the vehicle is first run, the consumption rate should not be updated until the vehicle has travelled a small distance and the state of charge has dropped a few percent. Up to this point the average consumption rate from the last time the car was run can be used.
2.5 State of Health Monitoring
Predicting battery state of health is a more difficult task than measuring battery state of charge information. The adaptive state of charge measuring method described above indicates the state of health as well as the state of charge. This method uses the coulometric method to indicate state of charge while the car is running which is based on battery models that describe the performance of a healthy battery. These measurements are compensated by open circuit voltage based state of charge measurements that give a state of charge, which is an indication of the actual state of the battery. The compensation factor obtained by comparing the two state of charge measuring methods can therefore be used to derive the state of health of the battery. With this method a healthy battery will have a state of charge derived from the two measuring methods which is very similar and hence the state of health will read near 100%. As the battery ages the uncompensated coulometric measurement and the open circuit voltage based measurements will be different and the ratio of the two will give a good indication of the state of health.
3. Implementation
To implement the battery monitoring techniques described above a battery monitor was developed. The battery monitor was designed for use in an experimental electric car owned by the University of Canterbury. The car is powered by twenty series connected 12V lead acid batteries to give a nominal 240V DC bus. The batteries are of the sealed gel type and are each rated at 36Ah. The batteries are split into three battery compartments. Eight of the twenty batteries are located under the bonnet and the remaining
[image:3.612.315.518.325.436.2]twelve are located in two groups of six under the two front seats.
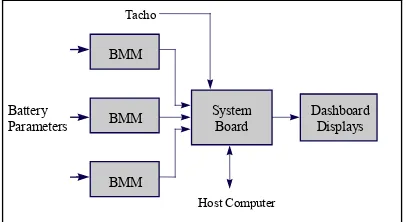
Figure 3 shows a block diagram of the battery monitor. Three Battery Measurement Modules (BMMs) take the various battery measurements and are designed to be mounted in each of the three battery compartments. Eight measurement channels are contained on each BMM, which are used to measure a combination of terminal voltages, temperature and the battery current. In order to calculate the state of health of each individual battery in the car’s bank, the battery monitor allows the open circuit voltage across each battery to be measured. The temperature is measured in each of the three battery compartments to allow the measurements to be compensated for temperature.
System Board BMM
BMM
BMM Battery
Parameters
Dashboard Displays
Host Computer Tacho
Figure 3: Block diagram of the battery monitor hardware.
The voltage of each battery is measured and then converted into a digital measurement. A single multi-channel analogue to digital converter (ADC) is used to measure the voltage of each battery in the BMM compartment. An opto-coupler isolation amplifier is used to transfer each battery voltage to the ADC as shown in Figure 4.
Figure 4: Voltage measurement block diagram.
12 bit ADCs. The measurements are therefore sent back to the monitor system board as digital signals over a serial interface. This minimises the likelihood of noise and interference corrupting the measurements.
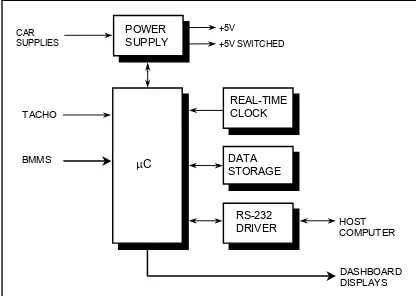
The monitor system board has been designed to perform all the data processing functions of the battery monitor and is based around a PIC16C74 microcontroller This microcontroller was selected because it contains a large ROM for program storage and on-chip UARTs and timer peripherals. Figure 5 shows the main components of this board.
µC
REAL-TIME CLOCK
DATA STORAGE
RS-232
DRIVER HOSTCOMPUTER
DASHBOARD DISPLAYS TACHO
BMMS
POWER SUPPLY CAR
SUPPLIES
[image:4.612.92.300.277.425.2]+5V +5V SWITCHED
Figure 5: Block diagram of the battery monitor system board.
Incoming data from the BMMs is processed by the microcontroller and the resulting information sent to the monitor’s displays. These consist of a four-line LCD display and an LED bargraph state of charge display.
The main system board also receives pulses from the car’s tachometer, which it uses to calculate the distance that the car has travelled. This board also contains a real-time clock and an E2PROM
for non-volatile data storage. An RS-232 interface is also provided to allow the battery monitor to communicate with a PC. Power to all the modules in the battery monitor is provided by the main system board also.
For development purposes the software for the monitor was initially implemented in a high-level language on a host computer connected via the RS-232 port to the battery monitor. A basic set of routines were written in assembly language to run
on the PIC microcontroller. These were written to communicate with the various battery monitor devices and to send and receive information from the host computer. A high-level language was used to speed up the development process by allowing the algorithms to be fully tested and changes to be easily made without having to rewrite the microcontroller code. The battery monitoring algorithms have now been implemented in the microcontroller.
4. Results
Full testing of the monitor has been carried out on the bench. The tests were carried out under a number of different conditions. These included discharge tests over a range of load currents, at low temperatures and also included testing during charging cycles. Figure 6 shows the typical data from a 7.2A discharge test.
0 5 10 15 20 25 30
50 100 150 200 250 300
Time (mins)
Ba
tt
ery
Para
m
et
ers
-20 0 20 40 60 80 100
S
ta
te o
f
C
h
ar
g
e (%
)
Current (A) Voltage (V)
Temperature (C)o
[image:4.612.316.516.349.481.2]SOC (%)
Figure 6: Results logged during a 7.2A discharge
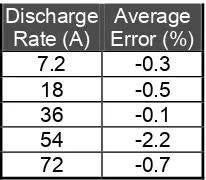
The coulometric and open circuit voltage measurement methods were tested independently of each other. Table 1 summarises the results obtained over a range of constant discharge rates. The battery monitor state of charge calculations were compared against the expected discharge times at each rate. The resulting error was averaged over a number of state of charge readings as given in Table 2. Overall the error was less than 1%. This shows that the battery models used closely matched the performance of the batteries.
Discharge Rate (A)
Average Error (%)
7.2 -0.3 18 -0.5 36 -0.1 54 -2.2 72 -0.7 Table 2: Comparison of time based and coulometric SOC for a 7.2A discharge rate.
Time based
Coulometric
SOC (%) SOC(%) Error (%) 100 100 0
80 79.9 -0.1 60 59.7 -0.3 40 39.4 -0.6 20 19.5 -0.5
0 -0.3 -0.3
Discharge tests were also performed with the battery temperature lowered to 5oC and these
results are given in Table 3. Without temperature compensation the state of charge was over predicted and showed 4.1% at the end of the discharge. With temperature compensation the state of charge was slightly under predicted, showing −0.6% at the end of the discharge. The average error over the entire discharge was 2.1% with no compensation for temperature and was
−0.3% with compensation. This demonstrates
[image:5.612.145.248.97.187.2]that the temperature compensation used improves the battery monitor results at low temperatures.
Table 3: Low battery temperature measurements.
Time based
Coulometric Temp compensation SOC (%) (without)
SOC (%)
(with) SOC (%) 80 80.8 79.9 60 61.7 59.8 40 42.5 39.6 20 23.3 19.5
0 4.1 -0.6
Table 4 and Table 5 give the open circuit prediction state of charge at various charge states during 7.2A and 54A discharge tests respectively.
[image:5.612.121.272.220.336.2]The results obtained from the open circuit voltage prediction algorithms were not quite as accurate and consistent as those obtained from the coulometric method. Overall the open circuit voltage tended to over predict the state of charge with an average error of around 3% which is still within the desired design accuracy of 5% required for the battery monitor. Since this method first makes two voltage measurements, calculates a prediction of the fully recovered open circuit voltage and finally uses this value to calculate the state of charge, there is a greater opportunity for errors to affect the results. Also a more accurate model of the open circuit recovery may be required in order to get more accurate and consistent results.
Table 4: Open circuit voltage results obtained during a 7.2A discharge.
Time based SOC (%)
Coulometric SOC (%)
Predicted SOC (%)
SOH (%)
80 79.5 83.3 120
60 59.3 60.5 117
40 39.2 44.6 129
20 18.6 22.4 129
0 0.0 4.1 -
Table 5: Open circuit voltage results obtained during a 54A discharge.
Time based SOC (%)
Coulometric SOC (%)
Predicted SOC (%)
SOH (%)
80 79.5 81.6 118
60 59.0 65.1 123
40 36.4 43.6 124
20 14.4 22.6 127
0 0 3.2 -
[image:5.612.111.274.522.647.2]calculations will propagate through to the state of health results. Due to the time required to perform conclusive state of health testing over the lifespan of a battery, further state of health testing was not performed.
5. Conclusion
Designing an accurate battery monitoring system for an electric vehicle is by no means an easy task. The use of the coulometric method for calculating state of charge allows the state of charge to be continuously calculated while the vehicle is running. Accumulated coulometric errors can then be corrected a short time after the vehicle has been shut down by making a state of charge prediction from the open circuit voltage of the batteries. By comparing the results from the two methods a coulometric error correction factor can be generated and the state of health can also be predicted. In addition to these measurements, the battery monitor is also able to make a prediction of the remaining distance that the vehicle may travel before requiring recharging.
6. References
[1] Aylor, J.H., A. Thieme, and B.W. Johnson, A Battery State-of-Charge indicator for Electric Wheelchairs, IEEE Transactions on Industrial Electronics, 1992. 39(5): p. 398-409.
[2] Churchill, T.L., J.S. Edmonds, and C.T. Feyk, Comprehensive Noninvasive Battery Monitoring of Lead-Acid Storage Cells in Unattended
Locations, Telecommunications Energy
Conference, INTELEC '94, 1994. Vancouver, Canada: IEEE.
[3] Patil, P.B. Fuel Gauges for Electric Vehicles, 17th IECEC. 1982. New York: IEEE.