ISSN Print: 2165-3917
DOI: 10.4236/ojapps.2019.94022 Apr. 26, 2019 260 Open Journal of Applied Sciences
Research on the Construction Priority Model of
Bus Lanes
Lijing Song
1,2, Xiaoduan Sun
1, Yulong He
11Beijing Key Laboratory of Traffic Engineering, Beijing University of Technology, Beijing, China
2Beijing Transport Institute, Beijing, China
Abstract
Priority of public transport is one of the important means to enhance the at-traction of ground public transportation, and also an important content in the construction of a public transport city. In recent years, Beijing has wit-nessed large-scale construction of Bus Lane. Based on the current situation that the construction of Bus Lane lacks scientific decision-making methods, this study establishes the time sequence evaluation indicator system for the construction of Bus Lane by analyzing the influencing factors, builds a rank-ing model of the importance degree of the construction of Bus Lane, and conducts case verification.
Keywords
Bus Lane, Time Sequence of Construction Model, Importance Degree, Indicator System
1. Introduction
Priority of public transport is one of the important means to enhance the attrac-tion of ground public transportaattrac-tion, and also an important content in the con-struction of a public transport city. After more than 20 years of development, the network for Bus Lane has been basically formed since the first Bus Lane was ar-ranged on Changan Avenue in 1997. The network has covered the main trunk roads of the central city and the sub-center, and initially formed a “one ring, three horizontal and eight radial” rapid commuting system of public transport. The allocation for Bus Lane plays an important role in improving the level and attractiveness of ground public transportation services, enhancing citizens’ travel experience, making efficient use of road resources, and realizing energy conser-vation and emission reduction, as well as guiding urban development, etc. The How to cite this paper: Song, L.J., Sun,
X.D. and He, Y.L. (2019) Research on the Construction Priority Model of Bus Lanes. Open Journal of Applied Sciences, 9, 260- 269.
https://doi.org/10.4236/ojapps.2019.94022
Received: March 18, 2019 Accepted: April 23, 2019 Published: April 26, 2019
Copyright © 2019 by author(s) and Scientific Research Publishing Inc. This work is licensed under the Creative Commons Attribution International License (CC BY 4.0).
DOI: 10.4236/ojapps.2019.94022 261 Open Journal of Applied Sciences average operating speed of Bus Lane is 33% higher than that of non-dedicated lanes. After the opening of the Bus Lane and the fast direct line, the commuting time of Beijing residents, especially the new city residents, to the main employ-ment attractions in the central city has been significantly reduced, effectively improving the travel experience of citizens. Buses on Beijing-Tongzhou fast road and Beijing-Kaifeng Expressway almost have the same speed as that of cars. The passenger flow carried by dedicated lanes is 2.5 times that by other lanes, which plays an important role in saving road resources. Residential and office facilities along the Bus Lane account for 73% of Beijing’s total, and the 500 meters along the Bus Lane can cover 62% of Beijing’s resident population.
Although remarkable achievements have been made in the construction of Bus Lane in Beijing, there are still some problems in setting dedicated lanes, such as mismatch between the supply and demand and discontinuity of intersections. On top of that, Beijing has seen large construction of Bus Lane in recent years, with an average growth of 40 kilometers per year. By the end of 2018, the length of Bus Lane had reached 952 kilometers. Against the background of non-capital function transfer, construction of a sub-center and supply-side structural reform in public transport, Beijing is in urgent need to form a reserve project of Bus Lane allocation and determine the annual plan for Bus Lane allocation according to the actual travel demands for bus, the optimization and adjustment of public transit network and the construction of networks for roads and rails in the fu-ture, which require a scientific method system and reasonable process to support decision-making. Beijing, however, still lacks such a method system. For this reason, this study mainly analyzes the factors influencing construction of Bus Lane, to establish an indicator system and build a ranking model of importance degree, thus providing a reasonable process system to guide the construction of Bus Lane.
2. Theory for Time Sequence of Construction of Bus Lane
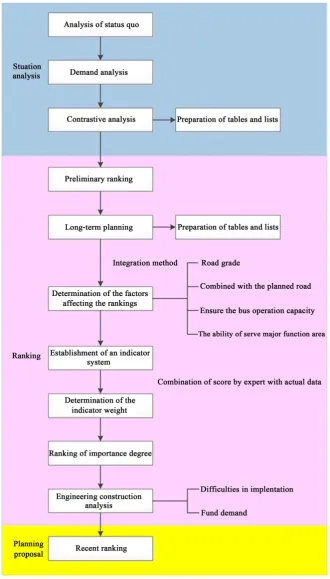
DOI: 10.4236/ojapps.2019.94022 262 Open Journal of Applied Sciences Through the existing studies at home and abroad, there are some studies on the importance ranking of transportation infrastructure. For instance, Qu Dayi et al. applied the systemic analytic hierarchy process (AHP) to the ranking of highway network planning and construction projects, with a consideration of such influencing factors as economy, technology and environment, to obtain the maximum construction benefits on the whole. Zhou Wei et al. used the analytic hierarchy process to determine the weight to calculate the indicator of the im-portance degree of transportation nodes. According to the demand of the road transport station at the transportation node, the indicator of importance degree of the node is revised as the demand indicator of the road transport station at the node. Through the demand indicator of the road transport station, the con-struction sequence of the road transport station is obtained by the circular com-parison method. Luo Jian et al. made a comparative study on the planning scheme for road networks by employing the grey relational analysis method and the variable weighted sorting method. However, at present, no scholar has put forward the theoretical study and method system on the time sequence of con-struction of Bus Lane, and there is a lack of factor analysis and indicator system that affect the time sequence of construction of Bus Lane. Based on the above analysis, this paper solves the problem of the time sequence of construction of Bus Lane by referring to the theory of importance degree ranking of transporta-tion infrastructure, which mainly involves key and difficult problems in 5 as-pects: determination of the factors influencing the priority in construction of Bus Lane, establishment of an indicator system, determination of the indicator weight, and building of the model of priority ranking in construction of Bus Lane, and proposal of suggestions for construction of Bus Lane according to ac-tual conditions of engineering construction and fund demand. The specific technical route is shown in Figure 1 Maintaining the Integrity of the Specifica-tions.
3. Building of Model for Ranking of Importance Degree
3.1. The Establishment of Indicator System for Time Sequence of
Construction of Bus Lane
DOI: 10.4236/ojapps.2019.94022 263 Open Journal of Applied Sciences
Figure 1. Technical route for study on time sequence of construction of bus lane.
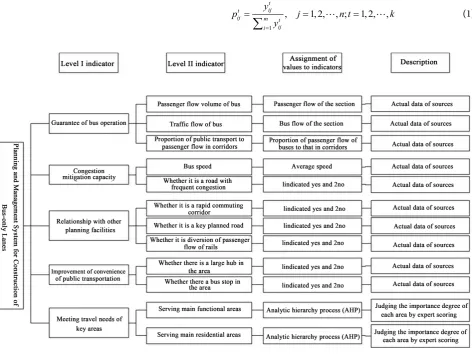
DOI: 10.4236/ojapps.2019.94022 264 Open Journal of Applied Sciences On the basis of determining the influencing factors [5], the indicators related to each influencing factor are taken into account to build a system of 5 major in-dicators and 12 minor inin-dicators, as shown in Figure 2.
3.2. Determination of Indicator Weight
The indicator weight is determined according to the expert investigation method and entropy evaluation method. For the expert investigation method, experts are mainly selected from government departments, scientific research institutions and colleges and universities. Based on the questionnaire survey, experts are asked to fill in the questionnaire and score each indicator according to their un-derstanding of the importance of each indicator. To avoid subjectivity of the ex-pert questionnaire method, the entropy evaluation method is used to determine the weight of the indicator layer, and the target layer (three different types of experts from government departments, scientific research institutions and col-leges and universities) is given different weights. The final weight of each indi-cator is determined by comprehensive statistics of the weight of target layer and that of the indicator layer.
Main steps for the entropy evaluation method are as follows: Step 1: Normalization processing of a standardized decision matrix:
1
, 1,2, , ; 1,2, ,
t ij t
ij m t
ij i
y
p j n t k
y =
= = =
[image:5.595.63.536.359.713.2]∑
(1)DOI: 10.4236/ojapps.2019.94022 265 Open Journal of Applied Sciences Step 2: Calculation of the entropy of the jth indicator:
1 ln , 1,2, , ; 1,2, ,
m
t t t
j i ij ij
E = −k
∑
= p p j= n t= k (2)Step 3: Calculation of the diversity factor of the jth indicator: 1
t t
j j
G = −E (3)
Step 4: Determination of indicator weight:
1
, 1,2, , ; 1,2, ,
t j t
j n t
j j
G
w j n t k
G
=
= = =
∑
(4){
1, , ,2}
t t t t
n
W = w w w indicates the normalized weight vector of an indicator in stage t (t=1, 2, , k).
3.3. The Ideal Solution Method—Grey Relational Degree Theory
Builds the Model of Comprehensive Importance Degree of the
Project
1) The fundamental principles of the theory
The theory was proposed by Hwang and Yoon in 1981. It is a kind of effective multi-attribute decision-making method. The basic idea of this method is to use the idea of ideal solution and negative ideal solution in multi-objective decision problem, to construct the ideal solution and negative ideal solution of the prob-lem, and to evaluate each object by using two benchmarks close to the ideal so-lution and away from the negative ideal soso-lution. It is the basis for judgment.
2) The ranking steps
The calculation of comprehensive importance degree of the project is a core part of the ranking model. The steps of the model can be summarized as follows:
Step 1: Select an evaluation indicator; select an indicator according to the evaluation indicator system of the construction plan.
Step 2: Determine the indicator value and conduct standardized treatment to from a decision matrix.
Step 3: Determine the indicator weight according to the entropy evaluation method.
Step4: Conduct standardized treatment of the decision matrix to determine an ideal scheme and a negative ideal scheme. Assuming that
(
)
{
}
1
max | 1,2, , ; 1,2, ,
t t
j i m ij
p∧ p j n t k
≤ ≤
= = = , then
{
^ ^ ^}
^t 1t , 2t , , nt
P = p p p is taken as the project of dedicated lanes with the highest comprehensive impor-tance degree at t (t=1, 2, , k) under ideal conditions. Assuming that
(
)
{
}
1min | 1,2, , ; 1,2, ,
t t
j i m ij
p∨ p j n t k
≤ ≤
= = = , then P∨t =
{
p p1t∨, t2∨, , pnt∨}
istaken as the project of dedicated lanes with the lowest comprehensive impor-tance degree at t (t=1, 2, , k) under ideal conditions.
Step 5: Use the grey correlation analysis method to respectively build grey re-lational coefficient matrixes of an alternative scheme and ideal and negative ideal scheme, and conduct weighting to determine the grey relational degree.
Assuming that t ij
ξ ∧ and t ij
ξ ∨ indicate the correlation coefficient of
i
DOI: 10.4236/ojapps.2019.94022 266 Open Journal of Applied Sciences
t
P∧ and P∨t at Itj, and the weighted grey relational degree of Pi & P∧t and t
P∨ is
γ
it∧ andγ
it∨ respectively, then:1 , 1,2, , ; 1,2, , n
t t t
j j wj ij i m t k
γ ∧ ξ ∧
=
=
∑
= = (5)1 , 1,2, , ; 1,2, , n
t t t
j j wj ij i m t k
γ ∨ ξ∨
=
=
∑
= = (6), 1,2, , ; 1,2, ,
t
t i
i t t
i i
I γ i m t k
γ γ
∧
∧ ∨
= = =
+ (7)
t i
I indicates the comprehensive importance degree of a dedicated lane project at t (t=1, 2, , k).
Step 6: Rank the schemes according to grey relative similarity degree. Ac-cording to the value of the Ii, the decision maker ranks all construction
projects of Bus Lane to determine construction sequence of each project.
4. Case Analysis
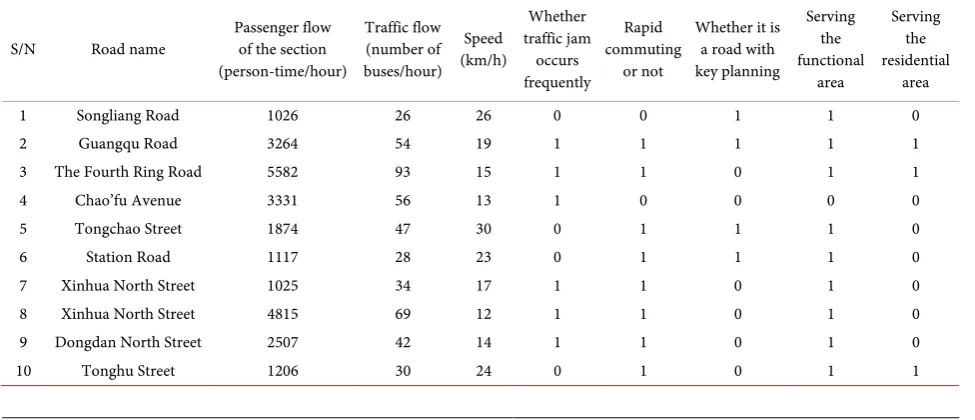
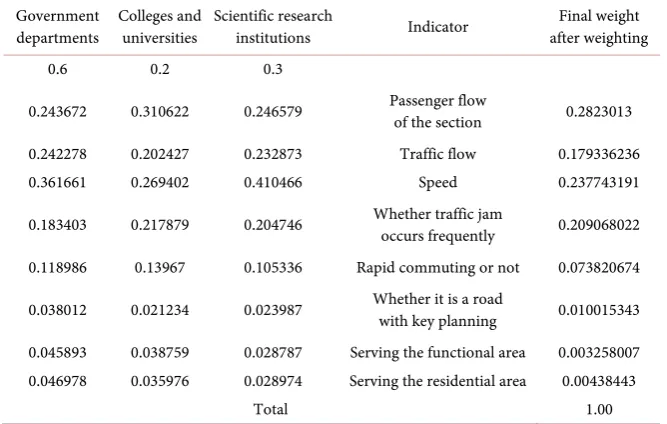
[image:7.595.207.538.75.190.2] [image:7.595.57.545.529.739.2]Take the allocation project of Bus Lane in 2017 as an example: According to the actual data acquisition, 8 indicators are selected from the indicator system estab-lished in Section 3.1 to build an indicator table (specific indicators are shown in Table 1). Based on the IC card data of buses in May 2017, data such as passenger flow of a section, bus flow and speed are obtained to determine whether the road is a commuting corridor and located in a key functional area according to the road layout and relevant planning, and to assign values to each Bus Lane, so as to form an indicator table of Bus Lane, as shown in Table 1. Each indicator is standardized according to the dimensionless treatment method proposed in Sec-tion 3. The weight of each indicator is determined according to the expert inves-tigation method (different experts are given different weights: 0.6 for govern-ment departgovern-ments, 0.2 for colleges and universities, and 0.3 for scientific re-search institutions) and the entropy evaluation method, and the weight of each indicator is calculated, as shown in Table 2.
Table 1. Indicators of bus lane.
S/N Road name Passenger flow of the section (person-time/hour) Traffic flow (number of buses/hour) Speed (km/h) Whether traffic jam occurs frequently Rapid commuting or not
Whether it is a road with key planning Serving the functional area Serving the residential area
1 Songliang Road 1026 26 26 0 0 1 1 0
2 Guangqu Road 3264 54 19 1 1 1 1 1
3 The Fourth Ring Road 5582 93 15 1 1 0 1 1
4 Chao’fu Avenue 3331 56 13 1 0 0 0 0
5 Tongchao Street 1874 47 30 0 1 1 1 0
6 Station Road 1117 28 23 0 1 1 1 0
7 Xinhua North Street 1025 34 17 1 1 0 1 0
8 Xinhua North Street 4815 69 12 1 1 0 1 0
9 Dongdan North Street 2507 42 14 1 1 0 1 0
DOI: 10.4236/ojapps.2019.94022 267 Open Journal of Applied Sciences The comprehensive importance degree of each dedicated lane is calculated according to the model of the comprehensive importance degree, with relevant information is shown in Table 3.
According to Table 3, based on the analysis of allocation difficulties, since there is no station on the main road of the Fourth Ring Road at present, it is ne-cessary to take corresponding engineering measures to increase stations or overpasses, and allocate Bus Lane by coordinating with the optimization of pub-lic transit network, so the Fourth Ring Road will not be considered temporarily. Chao’fu Avenue, Xidan North Street and Dongdan North Street will not be con-sidered temporarily due to limitations of road conditions. Accordingly, the allo-cation plans for Bus Lane in 2017 are formulated according to the comprehen-sive importance. There are a total of 6 Bus Lane, with a length of 49.4 kilometers. The detailed information is shown in Table 4.
[image:8.595.208.542.314.526.2]Figure 3 Status Quo of Bus Lane and Allocation Plans in 2017.
Table 2. Indicator weight.
Government
departments Colleges and universities Scientific research institutions Indicator after weighting Final weight
0.6 0.2 0.3
0.243672 0.310622 0.246579 Passenger flow of the section 0.2823013
0.242278 0.202427 0.232873 Traffic flow 0.179336236
0.361661 0.269402 0.410466 Speed 0.237743191
0.183403 0.217879 0.204746 Whether traffic jam occurs frequently 0.209068022
0.118986 0.13967 0.105336 Rapid commuting or not 0.073820674
0.038012 0.021234 0.023987 Whether it is a road with key planning 0.010015343
0.045893 0.038759 0.028787 Serving the functional area 0.003258007 0.046978 0.035976 0.028974 Serving the residential area 0.00438443
[image:8.595.209.538.557.728.2]Total 1.00
Table 3. Comprehensive importance degree.
S/N Road name Comprehensive importance degree Mileage (km)
1 Songliang Road 0.671560 8
2 Guangqu Road 0.708029 23
3 The Fourth Ring Road 0.567060 120
4 Chao’fu Avenue 0.567062 7.6
5 Tongchao Street 0.708020 5.4
6 Station Road 0.671561 0.4
7 Xinhua North Street 0.671560 3.2
8 Xinhua North Street 0.671562 11
9 Dongdan North Street 0.671563 9
DOI: 10.4236/ojapps.2019.94022 268 Open Journal of Applied Sciences
Figure 3. Status quo of bus lane and allocation plans in 2017.
Table 4. Allocation plans for bus lane in 2017.
S/N Road name Comprehensive importance degree Mileage (km)
1 Songliang Road 0.671560 8
2 Guangqu Road 0.708029 23
3 Tongchao Street 0.708020 5.4
4 Station Road 0.671561 0.4
5 Xinhua North Street 0.671560 3.2
6 Tonghu Street 0.671561 9.4
Total 49.4
Compared with the actual Bus Lane allocated in 2017, allocation of Bus Lane on Tongchao Street has not been implemented yet due to road construction, and other calculation results are all allocated as planned. The conformity between the allocation plan and the actual implementation reaches 90%. It can be seen that the method used in this study is feasible.
5. Conclusion
DOI: 10.4236/ojapps.2019.94022 269 Open Journal of Applied Sciences method provided in this study is feasible and supports the allocation of Bus Lane in Beijing in a reasonable and effective manner.
Conflicts of Interest
The authors declare no conflicts of interest regarding the publication of this pa-per.
References
[1] Ministry of Transport (2013) Notice on Printing and Distributing the Indicator
System for Examination and Evaluation of Transit Metropolis. The Ministry of Transport, Beijing.
[2] Beijing, DB11/T1163-2015, Specifications for Setting of Bus Lane, Beijing, 2015.
[3] Bai, Y., Xue, K. and Yang, X.G. (2004) Discussion on Benefit Evaluation Methods of
Bus Lane. Journal of Highway and Transportation Research and Development, 21,
102-105.
[4] Lin, X.H. (2013) Benefit Evaluation and Simulation of Bus Lane—Tianyuan Road of
Guangzhou Is Taken for Example. Technology & Economy in Areas of
Communi-cations, 15, 32-35.
[5] Yang, J. and Chen, H. (2015) Indicators and Methods for Evaluation of
Compre-hensive Operating Efficiency of Bus Lane. Journal of Chang’an University (Natural