ISSN Online: 2152-7261 ISSN Print: 2152-7245
DOI: 10.4236/me.2019.103051 Mar. 20, 2019 757 Modern Economy
Bank Failure Prediction in Relation to the
Business Life Cycle
Yishu Wang, Jing Yang, Zhenjia Liu
*Department of Accounting, School of Business, Changzhou University, Changzhou, China
Abstract
The results suggest that the capital ratio, loan ratio, non-performing loans, provisions for loan losses, fixed assets, return of equity, ratio of interest in-come to interest expenses, and ratio of non-interest inin-come to non-interest expenses all had different correlations to the financial distress experienced by banks that were at a business life cycle stage. The logistic model employed in this study for predicting bank failure explains most of the banking trends in NIC banks at the declining stage. The accuracy of G8 banks at the growth stage performed well, whereas NIC banks at the declining stage performed poorly.
Keywords
Bank Failure Prediction, Bank, Global
1. Introduction
Banks efficiently manage their capital, loaning the capital received through de-posits to create revenue. This process, which fosters industrial development and economic growth, separates banks from other businesses. When banks collapse because of mismanagement, it affects investors and employees, eliminating the rights of customers, negatively affecting other industries, and potentially leading to international financial distress and destabilized economies (Huang et al., [1]). Consequently, evaluating bank operations and establishing early warning sys-tems became a top priority for global financial authorities.
The corporate life cycle is an essential part of corporate theory that views a corporation from a longitudinal perspective, wherein it moves through a fairly predictable series of developmental stages (Cao et al., [2]). By contrast, the life cycle theory supposes that, like all living creatures, firms and economic agencies
*Corresponding author. How to cite this paper: Wang, Y.S., Yang,
J. and Liu, Z.J. (2019) Bank Failure Predic-tion in RelaPredic-tion to the Business Life Cycle. Modern Economy, 10, 757-777.
https://doi.org/10.4236/me.2019.103051
Received: May 30, 2018 Accepted: March 17, 2019 Published: March 20, 2019
Copyright © 2019 by author(s) and Scientific Research Publishing Inc. This work is licensed under the Creative Commons Attribution International License (CC BY 4.0).
http://creativecommons.org/licenses/by/4.0/
DOI: 10.4236/me.2019.103051 758 Modern Economy
are born, grow, age, and die and, as such, have their own individual life cycles (Adizes, [3]). In addition, various literature has described how an enterprise can experience financial distress at different stages throughout its life cycle (Cao and Chen, [4]), such as at the start-up stage (Mahmood, [5]; Esteve-Perez and Ma-nez-Castillejo, [6]; Xiaohong et al. [7]. Bruderl et al. [8]; Strotmann, [9]; Free-man et al. [10]; Bruderl and Schussler, [11]; Fichman and Levinthal, [12]; Lucas,
[13]; Mata and Portugal, [14]), growth stage (Cooper et al. [15]; Landier and Thesmar, [16]), mature stage (Filatotchev et al. [17]; Jensen, [18]; Jensen, [19]; Claessens et al. [20]; Faccio et al. [21]; Blum, [22]), or declining stage (Adizes,
[23]; Cao et al. [2]). Overall, the relationship between the business life cycle and business failure is considerable. Huang et al. [1] first analyzed regional group early warning systems for bank finances and reviewed results derived from fi-nancial ratios. However, they did not conduct interviews on the business life cycle in bank failure prediction models.
This is crucial because a business life cycle not only affects business strategy but also business bankruptcy. Few previous studies have addressed this area of banking; therefore, we developed a bank failure model according to the standard business life cycle to allow bankers to make appropriate decisions at various life cycle stages to prevent bank failure. We then compared the early warning indi-cators of bank failures in the Organization for Economic Co-operation and De-velopment (OECD), North America Free Trade Area (NAFTA), Association of Southeast Asian Nations (ASEAN), European Union (EU), Newly industrialized country (NIC), G20, G8 based on the logistic model (i.e., the variables that were statistically significant in the model were based on each model).
The purpose of our study is to use the logistic model to investigate the deter-minants of bank failures at different business life cycle stages. The remainder of the paper is organized as follows. Section 2 presents a brief review of the related literature. Section 3 provides details of the research design and sample selection procedure and develops our alternative model. Section 4 presents our empirical findings. Section 5 contains a summary and conclusions.
2. Literature Review
Cao et al. [2] proposed a novel multiple-classifier ensemble model based on the firm life cycle and the Choquet integral for financial distress prediction (named MCELCCH). An empirical study based on the real data of Chinese-listed com-panies was conducted and the results showed that the MCELCCH model demon-strates higher prediction accuracy than single classifiers do. Moreover, to verify the prediction capability of the firm life cycle and the Choquet integral in the financial distress prediction model, a comparative analysis was conducted. The experiment results indicate that the introduction of a firm life cycle and the Choquet integral in financial distress prediction can greatly enhance prediction accuracy.
dif-DOI: 10.4236/me.2019.103051 759 Modern Economy
ferent causes of financial distress at an enterprise’s different life cycle stages, they implemented the simulation model in four specific cases that were at the start-up, growth, mature, and declining life cycle stages, respectively. Because smaller enterprises at the start-up stage commonly lack scale advantages, they employ less capable managers, face greater difficulties in financing, and thus have a higher probability of financial distress. Financial distress is also influ-enced by specific sector factors, such as the industry’s size, growth rate, entering rate, technology regime, and minimum efficient scales, all of which considerably influence on the probability that an enterprise will fall into financial distress. When an enterprise arrives at the growth stage, the risk of financial distress is greatly reduced. Generally, serious financial distress breaking out at the growth stage is quite rare. However, there is a main risk that can cause an enterprise at the growth stage to fall into financial distress, namely overconfidence. These types of enterprises have successively survived the start-up stages. Consequently, a rise in confidence accompanies them at the growth stage. To enhance both the business status of their enterprise and their own individual reputations, ambi-tious entrepreneurs have an impulsive tendency to attempt to expand the enter-prise’s scale and often overestimate the demand for expedited market growth of their products. This occurs despite the limited experience and business capabili-ties of their enterprise. Although the expansions the enterprise undergoes are often inspiring, they present two main faults that lead the enterprise to fall into financial distress. First, most of these expansions are funded by credit financing. According to the MM theorem, the cost of debt financing is less than that of eq-uity financing; hence, a majority of growth stage enterprises tend to rely on debt financing to sustain their expansion. However, these same enterprises common-ly ignore the recessive cost of bankruptcy when adopting this form of financing. Once the external environment changes for the worst, or the market for the product does not develop as well as the managers had expected, the excessive debt may cause the enterprise to fall into financial distress. Second, because the enterprise is expanding rapidly, management may not be able to keep up with and control forces driving the expansion, which may lead to lower quality prod-ucts, high expenses, and more internal conflict. Thus, although the enterprise grows in scale and amount of sales, even achieving a high growth rate, its core competitiveness is reduced, thus affecting the enterprise’s financial situation to such an extent that it may eventually fall into financial distress. Overconfidence is the most critical factor that causes these growth stage enterprises to fall into financial distress.
DOI: 10.4236/me.2019.103051 760 Modern Economy
mergers, diversify in ways unrelated to the business or with products that achieve low profit, or even, in the worst cases, to jeopardize the whole value of the enterprise. Various forms of executive moral hazard and “hollowing out” behavior of controlling shareholders may emerge, including: excessive internal expense; over-investment and blind diversification; capital occupation by major shareholders; over guarantee given to clients; and frequent related-party transac-tions, to name a few. Such behaviors usually result in operational instability and the decline in value of the enterprise. In more serious cases, the enterprise’s fi-nancial situation may worsen to the point where it arrives at a declining stage, thereby exposing itself to the risk of falling into financial distress. In addition, the enterprise may suddenly encounter fierce competition or imitation or subs-titute products may appear on the market. Still larger forces may conspire against an enterprise such as an economic recession or a cyclical downturn in the industry. Because of any one of these forces, an enterprise’s product life cycle in the market may come to an end (Cao and Chen, [4]).
Unfortunately, many enterprises are often unaware of changes that occur in business because of rigid internal mechanisms at work. Only when the enter-prise’s sales figures start to drop to the point where the enterenter-prise’s financial sit-uation is affected does awareness begin to emerge. In response, the enterprise urgently tries to develop new products to gain a new source of profit. Conversely, for the sake of flexibility or innovation, the enterprise may undergo a large-scale organizational restructuring, which typically consumes a large amount of re-sources. At the declining stage of an enterprise, its profitability structure may lack the effective support offered by a follow-up product. As a result, the enter-prise’s financial situation may continue to worsen until the enterprise falls into financial distress (Cao and Chen, [4]).
The causes of financial distress of enterprises at the start-up stage are fre-quently the topics in industrial organization theory and organizational ecology theory (Mahmood, [5]; Esteve-Perez and Manez-Castillejo, [6]; Xiaohong et al.
[7]). Industry organization literature has identified many factors that affect a start-up enterprise’s failure and can be classified into three areas: entrepreneur-ship, the specific nature of the enterprise itself, and internal business factors such as the business cycle or sectorial and regional issues (Bruderl et al. [8]; Strot-mann, [9]). The determinants in entrepreneurial leverage commonly include gender, age, professional background, educational attainment, and other identi-fying characteristics (Abdesselam et al. [24]). Most of these abstract qualities in-dicate the entrepreneur’s experience and ability in related industries and man-agement. Considering determinants of financial distress, some literature has in-vestigated the relationship between an enterprise’s age (i.e., its accumulated ex-periences and resources) and the likelihood of financial distress. (Freeman et al.,
DOI: 10.4236/me.2019.103051 761 Modern Economy
at the growth stage of an enterprise. Among entrepreneurs, the phenomenon of overconfidence is especially common (Cooper et al. [15]; Landier and Thesmar,
[16]). However, as the enterprise matures, problems in corporate governance become the main risks that lead an enterprise into financial distress (Filatotchev
et al. [17]). The free cash flow hypothesis states that, as the organization matures potential conflicts between principals and agents become more serious (Jensen,
[18]; Jensen, [19]). In much of Europe, East Asia, and Southeast Asia, where the enterprise’s equity is highly concentrated, the enterprise’s controlling share-holder may hollow out the company’s assets through “tunnel acts” and greatly injure the interests of medium and small shareholders (Claessens et al. [20]; Fac-cio et al. [21]). At the declining stage, at a point when the enterprise’s organiza-tional structure has become very rigid and the corporate culture has become so conservative that ability or inclination to innovate has greatly diminished, the enterprise may find it difficult, if not impossible, to develop another successful product (Adizes, [23]).
By comparison, Cao et al. [2] present an approach that uses back propagation neural networks and the rough set theory to provide an early warning for enter-prises falling to a declining stage. The approach is based on the data of the T-0, T-1, and T-2 years prior to the firm falling into a decline. For the period T-0 models, the return on equity, management expense ratio, receivables turnover, fixed assets turnover, year-on-year growth rate of the main business income, as-set-liability ratio, and net debt/net assets are selected as potential predictor va-riables. These belong to five aspects of profitability and quality, period expense management ability, asset management ability, growth ability, and solvency. For the period T-1 models, the return on equity, EBITDA/main business income, management expense ratio, current assets turnover, year-on-year growth rate of main business income, year-on-year growth rate of net profit, asset-liability ratio, and fixed assets/total assets are selected as potential predictor variables. They belong to six aspects of profitability and quality, period expense management ability, asset management ability, growth ability, solvency, and asset constitution. For the period T-2 models, the net sales margin, main business profit margins, management expense ratio, total assets turnover, year-on-year growth rate of main business income, year-on-year growth rate of total assets, and fixed as-sets/total assets are selected as potential predictor variables. They belong to five aspects of profitability and quality, period expense management ability, asset man-agement ability, growth ability, and asset constitution. Lin et al. (2013) also studied warning systems that predict when a corporation will fall to a declining stage. The aim of this study is to establish a novel prediction mechanism that combines the sampling technique (i.e., the synthetic minority over sampling technique, or SMOTE), the feature selection ensemble (i.e., original, intersection, and union), the extreme learning machine (ELM) ensemble, and the decision tree (DT).
ade-DOI: 10.4236/me.2019.103051 762 Modern Economy
quacy, asset quality, management expertise, earnings strength, and liquidity). The capital base of a bank is critical because it is the last line of defense against uninsured depositor losses and general creditors. Capital adequacy is a measure of the level and quality of a capital base. Asset quality measures the level of asset risks, which are influenced by the quality and diversity of borrowers and their abilities to repay loans. Management quality measures the quality of the bank of-ficers and the efficiency of the management structure. Earnings ability measures performance and the stability of earning streams. Liquidity measures the ability of a bank to meet urgent, unforeseen deposit outflows. Each of these factors in-fluences bank failure. Asset loss is a direct cause of bank failure; however, other factors indicate the ability of the bank to remain operational despite these losses (Huang et al. [1]). A comprehensive review of bank failure prediction models re-vealed that the financial ratios constructed to measure the CAMEL components (Cole and Gunther [25]; Sarkar and Sriram [26]; Tam and Kiang [27]; Whalen
[28]) predict bank failures based on financial ratios. We proposed financial ratios based on publicly available balance and income data (in the call reports) that commercial banks must report to regulatory authorities. Several characteristics of these data reflect the soundness of a commercial bank. Zhao et al. [29] suggested that financial ratios are effective variables for predicting and explaining bank fail-ures. Several previous studies have investigated various financial ratios: 1) cash flow to loans (Ravi and Pramodh [30]; Chauhan et al. [31]); 2) interest expense to average assets (Canbas et al. [34]; Ravi and Pramodh [30]; Chauhan et al. [31]); 3) net income to equity (Olmeda and Fernandez [33]; Ravi and Pramodh [30]; Chauhan et al. [31]); 4) retained earnings to assets (Cielen et al. [34]; Chauhan et al.
[31]), 5) current assets to assets (Olmeda and Fernandez [33]; Ravi and Pramodh
[32]); and 6) the quick ratio (Cielen et al. [34]; Canbas et al. [32]).
3. Methodology
Financial ratios were used to predict financial distress in the banking industry, incorporating data from 2005-2015 from the COMPUSTAT database. The study comprised 674 banks (OECD, Organization for Economic Co-operation and Development; G8; ASEAN, Association of Southeast Asian Nations; EU, Euro-pean Union); NIC, Newly industrialized country; G20; NAFTA, North America Free Trade Area) and 5506 samples (excluding financial holding companies). A logistic model was adopted to analyze the data. The variables and research model of the current study are presented in the following sections.
3.1. Business Life Cycle
DOI: 10.4236/me.2019.103051 763 Modern Economy
the primary strategy. Thus, in this case, the operating activities result in a cash flow with a negative value. However, the cash flow from operating activities does not cover the demands for funds completely and cash flow from financing activ-ities results in a positive value (because the corporation has external financial demands). The growth stage recovers capital investment from the start-up stage. Thus, cash flow from both operating activities and financing activities attains a positive value and business continues the investment of capital. In addition, at the mature stage, operating activities’ cash flow maintains a positive value even though corporate’s net profit has decreased. Thus, the cash flow from financing activities has decreased to a negative value. Finally, at the declining stage, corpo-rate’s net profit and sales have also decreased, causing cash flow from operating activities to fall to a negative value. We set up the business life cycle as follows:
1) Start-up stage: Cash flow from operating activities has a negative value and cash flow from financing activities has a positive value at t Time.
2) Growth stage: Cash flow from operating activities has a positive value and cash flow from financing activities has a positive value at t Time.
3) Mature stage: Cash flow from operating activities has a positive value and cash flow from financing activities has a negative value at t Time.
4) Declining stage: Cash flow from operating activities has a negative value and net profit and sales have also decreased at t Time.
3.2. Dependent Variables: Failures
The definitions of financial distress are inconclusive, but they are primarily based on financial statements. This study is followed by Cao and Chen [4], who reported that when net profits are negative and cash flows are insufficient to cover the debt (cash flows < debt), the enterprise inevitably falls into financial distress. At the start-up stage, the value of the dummy variable is 1, and 0 is the contrary. By contrast, when the current assets are not great enough to repay the debt (current assets < debt), the enterprise inevitably falls into financial distress. At the growth stage, the value of the dummy variable is 1, and 0 is the contrary. In addition, when sales decline and the free cash flow is insufficient to cover the enterprise’s debt (free cash flow < debt), the enterprise falls into financial dis-tress. At the mature stage, the value of the dummy variable is again 1, and 0 is the contrary. Compared with the above solutions, when the labor costs decrease and cash flows decline, the enterprise falls into financial distress. At the declin-ing stage, the value of the dummy variable is 1, and 0 is the contrary.
3.3. Independent Variables: Financial Ratios
com-DOI: 10.4236/me.2019.103051 764 Modern Economy
pared to loans, and lower provisions for loan losses compared to loans. However, the empirical results of Serrano-Cinca and Gutiérrez-Nieto [38] indicated that healthy banks had higher Tier 1 (core) capital compared to average assets.
3.4. Control Variables: Macroeconomic Factors (from AREMOS
Database)
We incorporated macroeconomic variables into the model, and identified the channels through which macroeconomic shocks contribute to bank failures. Macroeconomic indicators assist in explaining how the environment interacts with bank problems. Regarding macroeconomic developments, a sharp drop in actual GDP growth is an excellent indicator that banking problems might emerge (Hutchison and Mc-Dill [39]). A fall in stock prices is also associated with an in-creased likelihood of banking sector distress (Hutchison and Mc-Dill [39]). However, Männasoo and Mayes [40] showed that increasing inflation is a crucial factor accompanying bank distress.
3.5. Empirical Model
The study used the logistic method. The proxy variables are as follows: CAPITALj t,
is Tier 1 (core) capital compared to average assets in year t; LOANj t, represents
loans compared to assets in year t; NPLj t, is non-performing loans compared
to all loans in year t; PLj t, is the provision for loan losses compared to all loans
in year t; FAj t, is fixed assets compared to long liabilities in year t; ROEj t, is
net profit compared to average equity in year t; IIIEj t, is interest income
com-pared to interest expenses in year t; NIINIEj t, is non-interest income compared
to non-interest expenses in year t; variable RGDPj t, represents the change in
gross domestic product divided by the consumer price index in year t; STOCKj t,
denotes the average deviation of the stock index over five years in year t; and
, j t
CPI denotes the consumer price index in year t.
3.6. Performance Measures
A more detailed performance analysis was conducted regarding the proposed logistic methods, and their accuracy was obtained using Equation 1. Classifica-tion performance is typically presented using a confusion matrix as shown in
Table 1, where TP is true positive, TN is true negative, FP is false positive, and FN is false negative. If a bankrupt firm is classified as bankrupt, then it is consi-dered TP. By contrast, if a non-bankrupt firm is classified as non bankrupt, then it is considered TN. Any non-bankrupt firm that is classified as bankrupt duces a FP and any bankrupt firm that is classified as a non-bankrupt firm pro-duces an FN (Divsalar et al. [41]).
4. Results
4.1. Descriptive Statistics
DOI: 10.4236/me.2019.103051 765 Modern Economy
Table 1. Confusion matrix
Predicted class
Bankrupt Non-bankrupt
Actual Class Bankrupt TP FN
Non-bankrupt FP TN
( ) TP TN 100
TP FP Accuracy %
FN TN
+ ×
+ + +
= (1)
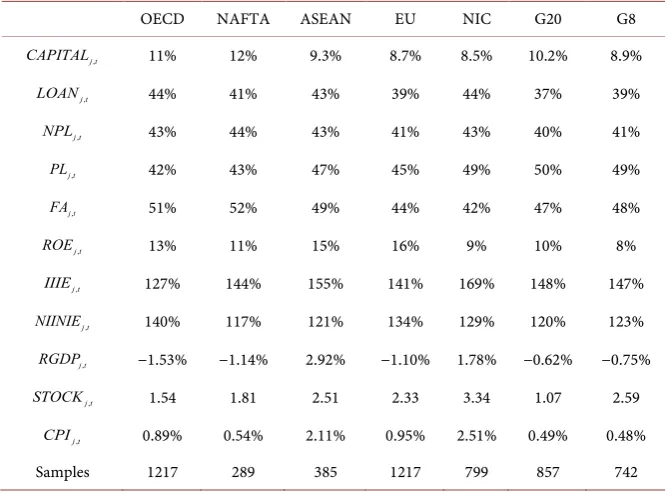
Table 2. Descriptive statistics: country samples (average values)
OECD NAFTA ASEAN EU NIC G20 G8
, j t
CAPITAL 11% 12% 9.3% 8.7% 8.5% 10.2% 8.9%
, j t
LOAN 44% 41% 43% 39% 44% 37% 39%
, j t
NPL 43% 44% 43% 41% 43% 40% 41%
, j t
PL 42% 43% 47% 45% 49% 50% 49%
, j t
FA 51% 52% 49% 44% 42% 47% 48%
, j t
ROE 13% 11% 15% 16% 9% 10% 8%
, j t
IIIE 127% 144% 155% 141% 169% 148% 147%
, j t
NIINIE 140% 117% 121% 134% 129% 120% 123%
, j t
RGDP −1.53% −1.14% 2.92% −1.10% 1.78% −0.62% −0.75%
, j t
STOCK 1.54 1.81 2.51 2.33 3.34 1.07 2.59
, j t
CPI 0.89% 0.54% 2.11% 0.95% 2.51% 0.49% 0.48%
Samples 1217 289 385 1217 799 857 742
capital ratios in these countries all exceed 6%, with NAFTA at 12% (highest) and NIC at 8.5% (lowest). Loans compared to assets ranged from 37% to 44%, non-performing loans compared to loans averaged approximately 40%, and pro-vision for loan losses compared to loans averaged from 42% to 50%. These re-sults indicated that credit policies were robust and stable, and appropriate loan losses are a suitable measure for risk management.
DOI: 10.4236/me.2019.103051 766 Modern Economy
OECD at 140% (the highest) and NAFTA at 117% (the lowest), indicating that these two items were bank profit sources.
Compared to these variables, the change in real gross domestic product had a positive value in the ASEAN and NIC, indicating that these two groups expe-rienced economic growth; however, the OECD had a negative value (the lowest of the seven groups), indicating an economic recession. Furthermore, the fluctu-ation of the stock index was lower in the G20, thereby demonstrating a steady capital market. The NIC showed higher fluctuations in the stock index, indicat-ing that economic growth in the group caused capital from various countries to flow into the stock market or that transaction and exchange systems were in-complete. The consumer price index in the NIC was high, indicating that the NIC experienced economic growth and product demand increased.
4.2. Empirical Test
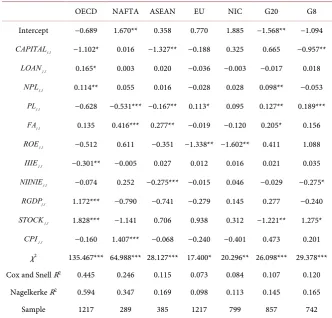
[image:10.595.205.538.390.708.2]1) Start-up stage
Table 3 shows that the capital ratio was significantly and negatively correlated to financial distress in OECD, ASEAN and G8 banks. These results are consis-tent with those of Serrano-Cinca and Gutiérrez-Nieto [38]. The loan ratio was significantly positively correlated to financial distress in OECD banks, which is
Table 3. Relationships between financial ratios and bank failure: Start-up stage.
OECD NAFTA ASEAN EU NIC G20 G8
Intercept −0.689 1.670** 0.358 0.770 1.885 −1.568** −1.094
, j t
CAPITAL −1.102* 0.016 −1.327** −0.188 0.325 0.665 −0.957**
, j t
LOAN 0.165* 0.003 0.020 −0.036 −0.003 −0.017 0.018
, j t
NPL 0.114** 0.055 0.016 −0.028 0.028 0.098** −0.053
, j t
PL −0.628 −0.531*** −0.167** 0.113* 0.095 0.127** 0.189***
, j t
FA 0.135 0.416*** 0.277** −0.019 −0.120 0.205* 0.156
, j t
ROE −0.512 0.611 −0.351 −1.338** −1.602** 0.411 1.088
, j t
IIIE −0.301** −0.005 0.027 0.012 0.016 0.021 0.035
, j t
NIINIE −0.074 0.252 −0.275*** −0.015 0.046 −0.029 −0.275*
, j t
RGDP 1.172*** −0.790 −0.741 −0.279 0.145 0.277 −0.240
, j t
STOCK 1.828*** −1.141 0.706 0.938 0.312 −1.221** 1.275*
, j t
CPI −0.160 1.407*** −0.068 −0.240 −0.401 0.473 0.201
χ2 135.467*** 64.988*** 28.127*** 17.400* 20.296** 26.098*** 29.378***
Cox and Snell R2 0.445 0.246 0.115 0.073 0.084 0.107 0.120
Nagelkerke R2 0.594 0.347 0.169 0.098 0.113 0.145 0.165
Sample 1217 289 385 1217 799 857 742
DOI: 10.4236/me.2019.103051 767 Modern Economy
consistent with the results derived by Boyacioglu et al. [36]. Non-performing loans were significantly and positively correlated to financial distress in OECD, and G20 banks, and these results were consistent with the results of Yildiz and Akkoc [37].
Conversely, loan loss provisions were significantly and negatively correlated to financial distress in NAFTA and ASEAN banks. These results were not con-sistent with those presented by Yildiz and Akkoc [37]. However, loan loss provi-sions were significantly and positively correlated to financial distress in EU, G20 and G8 banks. Fixed assets (Fixed assets to long liability) had a significantly pos-itive correlation with financial distress in the NAFTA, ASEAN and G20 banks. These results were not consistent with those of Boyacioglu et al. [36]. Return of equity had a significantly negative correlation to financial distress in EU and NIC banks, and these results were consistent with those of Boyacioglu et al. [36]. Interest income to interest expense ratios were significantly and negatively cor-related to financial distress in OECD banks. And non-interest income to non-interest expense ratios were significantly and negatively correlated to finan-cial distress in ASEAN and G8 banks. These results were consistent with those of Yildiz and Akkoc [37].
Regarding macroeconomic factors, the changes in real gross domestic product, the volatility of the stock index, and the consumer product index all had differ-ent relationships in the seven regional nationals banking sectors. For example, changes in real gross domestic product showed a significant positive correlation with financial distress in the OECD banks. Conversely, the volatility of the stock index had a significant positive correlation to financial distress in OECD and G8 banks, a significant negative correlation to financial distress in G20 banks, and a non-significant relationship with financial distress in NAFTA, ASEAN, EU and NIC banks. In addition, the consumer product index was significantly and posi-tively correlated to financial distress in NAFTA banks.
DOI: 10.4236/me.2019.103051 768 Modern Economy
in our logistic model, indicating that the related variables were not collinear (The results were omitted to save space). According to the Cox & Snell R2 and
the Nagelkerke R2, the OECD banks have a higher ability to explain the bank
failure model proposed in this study, whereas EU banks have a lower ability to explain the model.
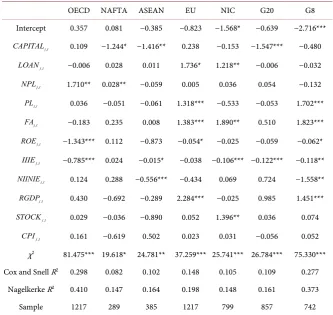
[image:12.595.205.539.392.707.2]2) Growth stage
Table 4 shows that the capital ratio was significantly and negatively correlated to financial distress in NAFTA, ASEAN and G20 banks. These results are con-sistent with those of Serrano-Cinca and Gutiérrez-Nieto [38]. The loan ratio was significantly positively correlated to financial distress in EU and NIC banks, which is consistent with the results derived by Boyacioglu et al. [36]). Non-performing loans were significantly and positively correlated to financial distress in OECD, and NAFTA banks and these results were consistent with the results of Yildiz and Akkoc [37]. Loan loss provisions were significantly and positively correlated to financial distress in EU and G8 banks. These results were consistent with those presented by Yildiz and Akkoc [37]. Fixed assets had a significantly positive cor-relation with financial distress in the EU, NIC and G8 banks. These results were not consistent with those of Boyacioglu et al. [36]. Return of equity had a signif-icantly negative correlation to financial distress in OECD, EU and G8 banks, and
Table 4. Relationships between financial ratios and bank failure: Growth stage.
OECD NAFTA ASEAN EU NIC G20 G8
Intercept 0.357 0.081 −0.385 −0.823 −1.568* −0.639 −2.716***
, j t
CAPITAL 0.109 −1.244* −1.416** 0.238 −0.153 −1.547*** −0.480
, j t
LOAN −0.006 0.028 0.011 1.736* 1.218** −0.006 −0.032
, j t
NPL 1.710** 0.028** −0.059 0.005 0.036 0.054 −0.132
, j t
PL 0.036 −0.051 −0.061 1.318*** −0.533 −0.053 1.702***
, j t
FA −0.183 0.235 0.008 1.383*** 1.890** 0.510 1.823***
, j t
ROE −1.343*** 0.112 −0.873 −0.054* −0.025 −0.059 −0.062*
, j t
IIIE −0.785*** 0.024 −0.015* −0.038 −0.106*** −0.122*** −0.118**
, j t
NIINIE 0.124 0.288 −0.556*** −0.434 0.069 0.724 −1.558**
, j t
RGDP 0.430 −0.692 −0.289 2.284*** −0.025 0.985 1.451***
, j t
STOCK 0.029 −0.036 −0.890 0.052 1.396** 0.036 0.074
, j t
CPI 0.161 −0.619 0.502 0.023 0.031 −0.056 0.052
χ2 81.475*** 19.618* 24.781** 37.259*** 25.741*** 26.784*** 75.330***
Cox and Snell R2 0.298 0.082 0.102 0.148 0.105 0.109 0.277
Nagelkerke R2 0.410 0.147 0.164 0.198 0.148 0.161 0.373
Sample 1217 289 385 1217 799 857 742
DOI: 10.4236/me.2019.103051 769 Modern Economy
these results were consistent with those of Boyacioglu et al. [36]. Interest income to interest expense ratios were significantly and negatively correlated to financial distress in OECD, ASEAN, NIC, G20, and G8 banks; and non-interest income to non-interest expense ratios were significantly and negatively correlated to finan-cial distress in the ASEAN and G8 banks. These results were consistent with those of Yildiz and Akkoc [37].
Regarding macroeconomic factors, the changes in real gross domestic product, the volatility of the stock index, and the consumer product index all had differ-ent relationships in the seven regional nationals banking sectors. For example, changes in real gross domestic product showed a significant positive correlation with financial distress in the EU and G8 banks. Conversely, the volatility of the stock index had a significantly positive correlation to financial distress in NIC banks and an insignificant relationship to financial distress in OECD, NAFTA, ASEAN, EU, G20, and G8 banks. In addition, the consumer product index was insignificantly correlated to financial distress.
The optimal results for the explicit equation of the logistic model regarding banking financial distress in regional groups can be expressed using the follow-ing financial variables. OECD bank variables are ranked from non-performfollow-ing loan to loan ratios, ROE, interest income to interest expense ratios. NAFTA bank variables are ranked from Tier 1 (core) capital to average asset ratios, non-performing loan to loan ratios. ASEAN bank variables are ranked from Tier 1 (core) capital to average asset ratios, interest income to interest expense ratios, non-interest income to non-interest expense ratios. EU bank variables are ranked from loan to asset ratios, provisions for loan losses to loan ratios, fixed asset to long liability ratios, ROE. NIC bank variables are ranked from loan to asset ratios, fixed asset to long liability ratios, interest income to interest ex-pense ratios. G20 bank variables are ranked from Tier 1 (core) capital to aver-age asset ratios, interest income to interest expense ratios. G8 bank variables are ranked from provisions for loan losses to loan ratios, fixed asset to long liability ratios, ROE, interest income to interest expense ratios, non-interest in-come to non-interest expense ratios. In addition, the variance inflation factors of variables were smaller than 10 in our logistic model, indicating that the related variables were not collinear. According to the Cox & Snell R2 and the Nagelkerke
R2, the OECD banks have a higher ability to explain the bank failure model
pro-posed in this study, whereas NAFTA banks have a lower ability to explain the model.
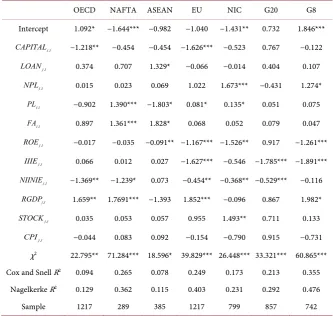
3) Mature stage
DOI: 10.4236/me.2019.103051 770 Modern Economy
Table 5. Relationships between financial ratios and bank failure: Mature stage.
OECD NAFTA ASEAN EU NIC G20 G8
Intercept 1.092* −1.644*** −0.982 −1.040 −1.431** 0.732 1.846***
, j t
CAPITAL −1.218** −0.454 −0.454 −1.626*** −0.523 0.767 −0.122
, j t
LOAN 0.374 0.707 1.329* −0.066 −0.014 0.404 0.107
, j t
NPL 0.015 0.023 0.069 1.022 1.673*** −0.431 1.274*
, j t
PL −0.902 1.390*** −1.803* 0.081* 0.135* 0.051 0.075
, j t
FA 0.897 1.361*** 1.828* 0.068 0.052 0.079 0.047
, j t
ROE −0.017 −0.035 −0.091** −1.167*** −1.526** 0.917 −1.261***
, j t
IIIE 0.066 0.012 0.027 −1.627*** −0.546 −1.785*** −1.891***
, j t
NIINIE −1.369** −1.239* 0.073 −0.454** −0.368** −0.529*** −0.116
, j t
RGDP 1.659** 1.7691*** −1.393 1.852*** −0.096 0.867 1.982*
, j t
STOCK 0.035 0.053 0.057 0.955 1.493** 0.711 0.133
, j t
CPI −0.044 0.083 0.092 −0.154 −0.790 0.915 −0.731
χ2 22.795** 71.284*** 18.596* 39.829*** 26.448*** 33.321*** 60.865***
Cox and Snell R2 0.094 0.265 0.078 0.249 0.173 0.213 0.355
Nagelkerke R2 0.129 0.362 0.115 0.403 0.231 0.292 0.476
Sample 1217 289 385 1217 799 857 742
*p-value < 0.1, **p-value < 0.05, ***p-value < 0.01.
and these results were consistent with the results of Yildiz and Akkoc [37]. Loan loss provisions were significantly and negatively correlated to financial distress in ASEAN banks. These results were not consistent with those presented by Yildiz and Akkoc [37]. However, loan loss provisions were significantly and positively correlated to financial distress in NAFTA, EU and NIC banks. Fixed assets had a significantly positive correlation with financial distress in the NAFTA, ASEAN banks. These results were not consistent with those of Boya-cioglu et al. [36]. Return of equity had a significantly negative correlation to fi-nancial distress in ASEAN, EU, NIC and G8 banks, and these results were con-sistent with those of Boyacioglu et al. (2009). Interest income to interest expense ratios were significantly and negatively correlated to financial distress in EU, G20, and G8 banks and non-interest income to non-interest expense ratios were significantly and negatively correlated to financial distress in OECD, NAFTA, EU, NIC, and G20 banks. These results were consistent with those of Yildiz and Akkoc [37].
DOI: 10.4236/me.2019.103051 771 Modern Economy
with financial distress in the OECD, NAFTA, EU and G8 banks. Conversely, the volatility of the stock index had a significant positive correlation to financial dis-tress in NIC banks and a non-significant relationship with financial disdis-tress in OECD, NAFTA, ASEAN, EU, G20 and G8 banks. In addition, the consumer product index was insignificantly correlated to financial distress.
The optimal results for the explicit equation of the logistic model regarding banking financial distress in regional groups can be expressed using the follow-ing financial variables. OECD bank variables are ranked from Tier 1 (core) capi-tal to average asset ratios, non-interest income to non-interest expense ratios. NAFTA bank variables are ranked from provisions for loan losses to loan ratios, fixed asset to long liability ratios, non-interest income to non-interest expense ratios. ASEAN bank variables are ranked from loan to asset ratios, provisions for loan losses to loan ratios, fixed asset to long liability ratios, ROE. EU bank va-riables are ranked from Tier 1 (core) capital to average asset ratios, provisions for loan losses to loan ratios, ROE, interest income to interest expense ratios, non-interest income to non-interest expense ratios. NIC bank variables are ranked from non-performing loan to loan ratios, provisions for loan losses to loan ratios, ROE, non-interest income to non-interest expense ratios. G20 bank variables are ranked from interest income to interest expense ratios, non-interest income to non-interest expense ratios. G8 bank variables are ranked from non-performing loan to loan ratios, ROE, interest income to interest expense ra-tios. In addition, the variance inflation factors of variables were smaller than 10 in our logistic model, indicating that the related variables were not collinear. According to the Cox & Snell R2 and the Nagelkerke R2, the G8 banks have a
higher ability to explain the bank failure model proposed in this study, whereas ASEAN banks have a lower ability to explain the model.
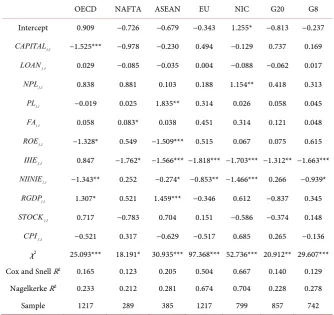
4) Declining stage
Table 6 shows that the capital ratio was significantly and negatively correlated to financial distress in OECD banks. These results are consistent with those of Serrano-Cinca and Gutiérrez-Nieto [38]. The loan ratio was insignificantly cor-related to financial distress, which is not consistent with the results derived from Boyacioglu et al. [36]. Non-performing loans were significantly and positively correlated to financial distress in NIC banks, and these results were consistent with the results of Yildiz and Akkoc [37]. Loan loss provisions were significantly and positively correlated to financial distress in ASEAN banks. These results were consistent with those presented by Yildiz and Akkoc [37]. Fixed assets had a significantly positive correlation with financial distress in the NAFTA banks. These results were not consistent with those of Boyacioglu et al. [36]. Return of equity had a significantly negative correlation to financial distress in OECD and ASEAN banks, and these results were consistent with those of Boyacioglu et al.
DOI: 10.4236/me.2019.103051 772 Modern Economy
Table 6. Relationships between financial ratios and bank failure: Declining stage.
OECD NAFTA ASEAN EU NIC G20 G8
Intercept 0.909 −0.726 −0.679 −0.343 1.255* −0.813 −0.237
, j t
CAPITAL −1.525*** −0.978 −0.230 0.494 −0.129 0.737 0.169
, j t
LOAN 0.029 −0.085 −0.035 0.004 −0.088 −0.062 0.017
, j t
NPL 0.838 0.881 0.103 0.188 1.154** 0.418 0.313
, j t
PL −0.019 0.025 1.835** 0.314 0.026 0.058 0.045
, j t
FA 0.058 0.083* 0.038 0.451 0.314 0.121 0.048
, j t
ROE −1.328* 0.549 −1.509*** 0.515 0.067 0.075 0.615
, j t
IIIE 0.847 −1.762* −1.566*** −1.818*** −1.703*** −1.312** −1.663***
, j t
NIINIE −1.343** 0.252 −0.274* −0.853** −1.466*** 0.266 −0.939*
, j t
RGDP 1.307* 0.521 1.459*** −0.346 0.612 −0.837 0.345
, j t
STOCK 0.717 −0.783 0.704 0.151 −0.586 −0.374 0.148
, j t
CPI −0.521 0.317 −0.629 −0.517 0.685 0.265 −0.136
χ2 25.093*** 18.191* 30.935*** 97.368*** 52.736*** 20.912** 29.607***
Cox and Snell R2 0.165 0.123 0.205 0.504 0.667 0.140 0.129
Nagelkerke R2 0.233 0.212 0.281 0.674 0.704 0.228 0.278
Sample 1217 289 385 1217 799 857 742
*p-value < 0.1, **p-value < 0.05, ***p-value < 0.01.
banks. These results were consistent with those of Yildiz and Akkoc [37].
Regarding macroeconomic factors, the changes in real gross domestic product, the volatility of the stock index, and the consumer product index all had differ-ent relationships in the seven regional nationals banking sectors. For example, changes in real gross domestic product showed a significant positive correlation with financial distress in the OECD and ASEAN banks. Conversely, the volatility of the stock index and the consumer product index had an insignificant rela-tionship to financial distress in banks.
DOI: 10.4236/me.2019.103051 773 Modern Economy
non-interest income to non-interest expense ratios. G20 bank variables are ranked from interest income to interest expense ratios. G8 bank variables are ranked from interest income to interest expense ratios, non-interest income to non-interest expense ratios. In addition, the variance inflation factors of riables were smaller than 10 in our logistic model, indicating that the related va-riables were not collinear. According to the Cox & Snell R2 and the Nagelkerke
R2, the NIC banks have a higher ability to explain the bank failure model
pro-posed in this study, whereas NAFTA banks have a lower ability to explain the model.
5) Overall
We demonstrated that healthy finances (capital ratio) do not occur when banks are experiencing financial distress, and greater flexibility in loan policies increases the risk of failure. Loan losses may be included in the expected lending risks of banks and can serve as a measure for risk management in reducing the possibility of financial crises. However, long liabilities are limited by fixed assets (fixed asset to long liability ratios), thereby detrimental to capital movement, and resulting in financial crises. The empirical results also show that when banks focus on primary operating items (interest income to interest expense ratios) or non-primary operating items (non-interest income to non-interest expense ratios), financial distress does not occur. Concerning macroeconomic factors, these re-sults demonstrated the differences in the cultures, laws and regulations, and economic systems under which various groups and different countries operate.
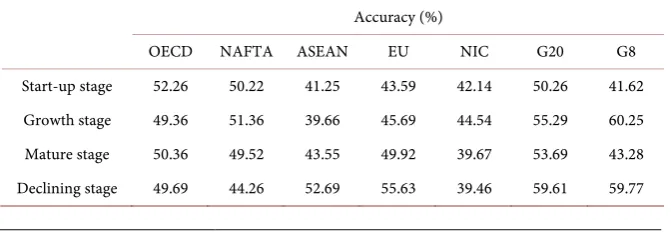
6) Performance analysis of the proposed logistic methods
[image:17.595.206.542.623.739.2]Erdogan (2008) indicated that logistic regression can be used as a part of an early warning system, establishing a cut-off point or level of probability (typical-ly, 0.5) that categorizes a bank as failed. Regarding a more detailed performance analysis of the proposed logistic methods, accuracy was obtained using Equation 1. Table 7 shows the accuracy of the logistic model in OECD, NAFTA, and G20 banks at the start-up stage; in NAFTA, G20, and G8 banks at the growth stage; in OECD and G20 banks at the mature stage; and in ASEAN, EU, G20, and G8 banks at the declining stage. The values were higher than 50%, implying higher accuracy in the model. However, in ASEAN, EU, NIC, and G8 banks at the start-up stage; in OECD, ASEAN, EU, NIC banks at the growth stage; in NAFTA, ASEAN, EU, NIC, and G8 banks at the mature stage; and in OECD, NAFTA, NIC banks at the declining stage, the values were lower than 50%, implying lower
Table 7. Confusion matrix: accuracy (%).
Accuracy (%)
OECD NAFTA ASEAN EU NIC G20 G8
DOI: 10.4236/me.2019.103051 774 Modern Economy
accuracy in the model.
Furthermore, based on regional groups and the accuracy of the logistic model, G8 banks at the growth stage performed the highest (60.25%), whereas NIC banks at the declining stage performed the lowest (39.46%). At the start-up stage, OECD banks performed the highest, whereas ASEAN banks performed the low-est. At the growth stage, G8 banks performed the highest, whereas ASEAN banks performed the lowest. At the mature stage, G20 banks performed the highest, whereas G8 banks performed the lowest. Finally, at the declining stage, G8 banks performed the highest, whereas NIC banks performed the lowest.
5. Conclusions
This study comprised 674 international banks (excluding financial holding companies) and used data from 2002-2012, employing a logistic model to ana-lyze the factors that influence financial early warning systems. The results sug-gested that the capital ratio, loan ratio, non-performing loans, provisions for loan losses, fixed assets, return of equity, interest income to interest expenses, non-interest income to non-interest expenses all had a different correlation to the financial distress experienced by banks in the OECD, NAFTA, ASEAN, EU, NIC, G20, and G8 banks that were in a business life cycle stage. Thus, the em-pirical results show that these nationals have different bank-sector environments. In addition, the logistic model for bank failure prediction in this study explains most of the banking trends in the NIC banks at the declining stage (Cox & Snell
R2 and Nagelkerke R2). Moreover, the accuracy of G8 banks at the growth stage
performed the highest, whereas NIC banks at the declining stage performed the lowest.
Most international banks are protected by deposit insurance. In times of fi-nancial distress, government interventions can prevent the collapse of banks. The risk of operating a bank grows with the internationalization of the capital market. The growing role is a financial intermediary, which stabilizes economic order. Forecasting financial distress has three benefits: 1) depositors can diversi-fy their assets to reduce risks; 2) governments can institute regulations and ex-amine insurance to manage the operational risks of banks; and 3) international cooperation can reduce potential financial distress, mitigating the domino effect.
DOI: 10.4236/me.2019.103051 775 Modern Economy
new theories that predict financial crises.
Fund
This work has been supported by a grant from the Department of accounting, School of Business, Changzhou University
Conflicts of Interest
The authors declare no conflicts of interest regarding the publication of this pa-per.
References
[1] Huang, D.T., Chang, B. and Liu, Z.C. (2012) Bank Failure Prediction Models: For
the Developing and Developed Countries. Quality and Quantity, 46, 553-558. https://doi.org/10.1007/s11135-010-9386-9
[2] Cao, Y., Chen, X., Wu, D.D. and Mo, M. (2011) Early Warning of Enterprise
De-cline in a Life Cycle Using Neural Networks and Rough Set Theory. Expert Systems with Applications, 38, 6424-6429.https://doi.org/10.1016/j.eswa.2010.09.138
[3] Adizes, I. (1989) Corporate Life Cycle: How and Why Corporations Grow and Die
and What Do about It. Prentice-Hall, Englewood Cliffs.
[4] Cao, Y. and Chen, X.H. (2012) An Agent-Based Simulation Model of Enterprises
Financial Distress for the Enterprise of Different Life Cycle Stage. Simulation Mod-elling Practice and Theory, 20, 70-88.https://doi.org/10.1016/j.simpat.2011.08.008
[5] Mahmood, T. (2000) Survival of Newly Founded Businesses: A Log-Logistic Model
Approach. Small Business Economics,14, 223-237. https://doi.org/10.1023/A:1008116207175
[6] Esteve-Perez, S. and Manez-Castillejo, J.A. (2008) The Resource-Based Theory of the Firm and Firm Survival. Small Business Economics, 30, 231-249.
https://doi.org/10.1007/s11187-006-9011-4
[7] Chen, X., Cao, Y. and Wang, F. (2010) A Life Cycle Analysis of Hunan’s Enterprises and Their Determinants. China Economic Review, 21, 470-481.
https://doi.org/10.1016/j.chieco.2010.04.006
[8] Bruderl, J., Preisendorfer, P. and Ziegler, R. (1992) Survival Chances of Newly Founded Business Organizations. American Sociological Review, 57, 227-242. https://doi.org/10.2307/2096207
[9] Strotmann, H. (2007) Survival. Small Business Economics, 28, 87-104. https://doi.org/10.1007/s11187-005-8859-z
[10] Freeman, J.G., Carool, R. and Hannan, M.T. (1983) The Liability of Newness: Age
Dependence in Organizational Death Rates. American Sociological Review, 48,
692-710.https://doi.org/10.2307/2094928
[11] Bruderl, J. and Schussler, R. (1990) Organizational Mortality: The Liabilities of Newness and Adolescence. Administrative Science Quarterly, 35, 530-547. https://doi.org/10.2307/2393316
[12] Fichman, M. and Levinthal, D. (1991) Honeymoons and the Liability of
Adoles-cence: A New Perspective on Duration Dependence in Social and Organizational Relationships. Academy of Management Review, 16, 442-468.
https://doi.org/10.5465/amr.1991.4278962
DOI: 10.4236/me.2019.103051 776 Modern Economy
Economics, 9, 508-523.https://doi.org/10.2307/3003596
[14] Mata, J. and Portugal, P. (1994) Life Duration of New Enterprises. Journal of Indus-trial Economics, 42, 227-246.https://doi.org/10.2307/2950567
[15] Cooper, A.C., Woo, C.Y. and Dunkelberg, W.C. (1988) Entrepreneurs Perceived Chances for Success. Journal of Business Venturing, 3, 97-108.
https://doi.org/10.1016/0883-9026(88)90020-1
[16] Landier, A. and Thesmar, D. (2009) Financial Contracting with Optimistic
Entre-preneurs. Review of Financial Studies, 22, 117-150. https://doi.org/10.1093/rfs/hhn065
[17] Filatotchev, I., Toms, S. and Wright, M. (2006) The Firm’s Strategic Dynamics and Corporate Governance Life-Cycle. International Journal of Managerial Finance, 2,
256-279.https://doi.org/10.1108/17439130610705481
[18] Jensen, M. (1986) Agency Cost of Free Cash Flow, Corporate Finance and
Takeov-ers. American Economic Review, 76, 323-329.
[19] Jensen, M. (1993) The Modern Industrial Revolution, Exit and the Failure of Inter-nal Control Systems. Journal of Finance, 48, 831-880.
https://doi.org/10.1111/j.1540-6261.1993.tb04022.x
[20] Claessens, S., Djankov, S. and Lang, L.H.P. (2000) The Separation of Ownership and Control in East Asian Corporations. Journal of Financial Economics, 58, 81-112. https://doi.org/10.1016/S0304-405X(00)00067-2
[21] Faccio, M., Lang, L.H.P. and Young, L. (2001) Dividends and Expropriation. Amer-ican Economic Review, 9, 154-178.https://doi.org/10.1257/aer.91.1.54
[22] Blum, M. (1974) Failing Company Discriminant Analysis. Journal of Accounting Research, 1, 1-25.https://doi.org/10.2307/2490525
[23] Adizes, I. (2004) Managing Corporate Lifecycles. The Adizes Institute Publishing, Carpinteria.
[24] Abdesselam, R., Bonnet, J. and Pape, N.L. (2004) An Explanation of the Life Span of New French Enterprises. Small Business Economics, 23, 237-254.
https://doi.org/10.1023/B:SBEJ.0000032034.59035.b4
[25] Cole, R. and Gunther, J. (1995) Separating the Likelihood and Timing of Bank Fail-ure. Journal of Banking & Finance, 19, 1073-1089.
https://doi.org/10.1016/0378-4266(95)98952-M
[26] Sarkar, S. and Sriram, R.S. (2001) Bayesian Models for Early Warning of Bank Fail-ures. Management Science, 47, 1457-1475.
https://doi.org/10.1287/mnsc.47.11.1457.10253
[27] Tam, K.Y. and Kiang, M. (1992) Predicting Bank Failures: A Neural Network
Ap-proach. Decision Sciences, 23, 926-947.
[28] Whalen, G. (1991) A Proportional Hazards Model of Bank Failure: An Examination
of Its Usefulness as an Early Warning Tool. Economic Review, 27, 21-31.
[29] Zhao, H., Sinha, A.P. and Ge, W. (2009) Effects of Feature Construction on Classi-fication Performance: An Empirical Study in Bank Failure Prediction. Expert Sys-tems with Applications, 36, 2633-2644.https://doi.org/10.1016/j.eswa.2008.01.053
[30] Ravi, V. and Pramodh, C. (2008) Threshold Accepting Trained Principal
Compo-nent Neural Network and Feature Subset Selection: Application to Bankruptcy Pre-diction in Banks. Applied Soft Computing, 8, 1539-1548.
https://doi.org/10.1016/j.asoc.2007.12.003
DOI: 10.4236/me.2019.103051 777 Modern Economy Wavelet Neural Networks: Application to Bankruptcy Prediction in Banks. Expert Systems with Applications, 36, 7659-7665.
https://doi.org/10.1016/j.eswa.2008.09.019
[32] Canbas, S., Cabuk, A. and Kilic, S.B. (2005) Prediction of Commercial Bank Failure via Multivariate Statistical Analysis of Financial Structure: The Turkish Case. Euro-pean Journal of Operational Research, 166, 528-546.
https://doi.org/10.1016/j.ejor.2004.03.023
[33] Olmeda, I. and Fernandez, E. (1997) Hybrid Classifiers for Financial Multi Criteria
Decision Making: The Case of Bankruptcy Prediction. Computational Economics,
10, 17-335.https://doi.org/10.1023/A:1008668718837
[34] Cielen, A., Peeters, L. and Vanhoof, K. (2004) Bankruptcy Prediction Using a Data Envelopment Analysis. European Journal of Operational Research, 154, 526-532. https://doi.org/10.1016/S0377-2217(03)00186-3
[35] Dickinson, V. (2011) Cash Flow Patterns as a Proxy for Firm Life Cycle. Accounting Review, 86, 1969-1994.https://doi.org/10.2308/accr-10130
[36] Boyacioglu, M.A., Kara, Y. and Baykan, O.K. (2009) Predicting Bank Financial Failures Using Neural Networks, Support Vector Machines and Multivariate Statis-tical Methods: A Comparative Analysis in the Sample of Savings Deposit Insurance Fund (SDIF) Transferred Banks in Turkey. Expert Systems with Applications, 36, 3355-3366.https://doi.org/10.1016/j.eswa.2008.01.003
[37] Yildiz, B. and Akkoc, S. (2010) Bankruptcy Prediction Using Neuro Fuzzy: An
Ap-plication in Turkish Banks. International Research Journal of Finance and
Eco-nomics, 60, 114-126.
[38] Serrano-Cinca, C. and Gutiérrez-Nieto, B. (2013) Partial Least Square Discriminant Analysis for Bankruptcy Prediction. Decision Support Systems, 54, 1245-1255. https://doi.org/10.1016/j.dss.2012.11.015
[39] Hutchison, M. and Mc-Dill, K. (1999) Are All Banking Crises Alike? The Japanese
Experience in International Comparison. Journal of the Japanese and International Economies, 13, 155-180.https://doi.org/10.1006/jjie.1999.0427
[40] Mannasoo, K. and Mayes, D.G. (2009) Explaining Bank Distress in Eastern
Euro-pean Transition Economies. Journal of Banking and Finance, 33, 244-253. https://doi.org/10.1016/j.jbankfin.2008.07.016
[41] Divsalar, M., Javid, M.R., Gandomi, A.H., Soofi, J.B. and Mahmood, M.V. (2011)
Hybrid Genetic Programming-Based Search Algorithms for Enterprise Bankruptcy Prediction. Applied Artificial Intelligence, 25, 669-692.
https://doi.org/10.1080/08839514.2011.595975
[42] Erdogan, B.E. (2008) Bankruptcy Prediction of Turkish Commercial Banks Using