Statistical optimization of process variables by response
surface methodology to enhance phenol degradation by
Pseudomonas putida (NCIM 2102)
Velluru Sridevi1*, Chandana Lakshmi Veera Venkata Mahanti1, Swamy Venkata Narasimha Adimadhyam2, Narasimha Rao Medicherla3
1*Centre for Biotechnology, Department of Chemical Engineering, Andhra University, Visakhapatnam, India; 2Department of Biotechnology, Jawaharlal Nehru Technological University, Anantapur, India;
3Al-Ameer College of Engineering and Information Technology, College of Engineering, Visakhapatnam, India.
E-mail: *[email protected]; [email protected]; [email protected]; [email protected] Received 3 December 2010; revised 9 May 2011; accepted 6 July 2011.
ABSTRACT
Removal efficiency of phenol from aqueous solutions was determined using Pseudomonas putida (NCIM 2102). Experiments were made as a function of pH (4 - 9), temperature (28˚C - 36˚C), and agitation speed (100 - 200 rpm). Optimization of these three process parameters for phenol degradation was studied. Sta-tistically designed experiments using response sur-face methodology was used to get more information about the significant effects and the interactions be-tween these three parameters. A 23 full-factorial cen-tral composite design was employed for experimental design and for analysis of the results. A second order polynomial regression model, has been developed using the experimental data. It was found that the degrading potential of P. putida (NCIM 2102) was strongly affected by the variations in pH, tempera-ture and agitation speed. The experimental values were in good agreement with the predicted values and the correlation coefficient was found to be 0.9871. The optimum process conditions for maximizing phenol degradation were recognized as follows: pH (7.49), temperature (29.99˚C), and agitation speed (138.89) rpm.
Keywords: Biodegradation of Phenol; P. putida (NCIM 2102); Central Composite Design; Correlation Coeffi-cient
1. INTRODUCTION
Nowadays, contamination of the environment by haz-ardous and toxic chemicals is being considered as one of the major problems facing by the industrialized nations
[1]. Phenol and its higher molecular homologues are im-portant environmental pollutants [2], which attracted pub-lic attention due to its presence in ground water, rivers and drinking waters [3]. It was also listed as a priority pollutant by the USEPA [4,5]. Acute exposure to phenol and its quinone analogues is known to cause skin irrita-tion, kidney damage, gastrointestinal discomfort and head-aches. Aesthetically, this compound also poses a nui-sance with detectable taste and odors in water at concen-trations as low as 1 - 8 mg·l–1 [6]. Most of the countries
specify the maximum allowable concentration of phenol in the effluent streams to be less than 1 mg·l–1 [5].
Phe-nol and phePhe-nolic compounds of high concentrations can be found in aqueous effluents from various industries such as oil refineries, petrochemical plants, ceramic plants, steel plants, coal conversion processes, phenol resin industries and pharmaceutical industries [7]. Due to its toxicity, hazardous character and an increasing social concern on environment, the discharge of such com-pounds in the environment has become more restrict. Phenolic wastes are treated by several physico-chemical methods like ozonization, adsorption, reverse osmosis, electrolytic oxidation, H2O2, photocatalysis etc. [8]. But
all the above methods have their own limitations [3,9]. Hence the realization of the high cost of phenol waste treatment by physico-chemical methods has opened the door for the investigation of new methods. Biological treatment an alternative method is versatile, inexpensive [10,11], receiving the most attention due to its environ-mentally friendly approach due to their high biodegrada-tion abilities. If properly designed and operated, bio-logical processes can realize total oxidation of organic matter so that there can be no sludge’s that must be eradicated as a result of treatment [12].
studied and these studies have shown that the phenol can be aerobically degraded by wide variety of fungi and bacterial cultures such as Candida tropicalis [13-15],
Acinetobacter calcoaceticus [16], Alcaligeneseutrophus
[17,18], P.putida [19,20] and Burkholderia cepacia G4 [21,22]. It has been demonstrated that treatment of small volumes of toxic compounds at the point of emission using specific microbial strains allows a higher control over the process and higher removal efficiencies [23]. Thus optimization of process variables is recognized to be an essential aspect of successful fermentation. Tem-perature exerts an important regulatory influence on the rate of metabolism. The effects of oxygen supply vary from species to species. In addition, oxygen mass trans-fer is aided by agitation rates that create turbulence and shear forces in the cultivation system causing significant influences on the growth rate and product formation [24].
Our main goals were to find out 1) the effect of pH; 2) the effect of temperature; 3) the effect of agitation speed on the biodegradation of phenol by P. putida (NCIM 2102) using both the classical method of optimization that involves varying the level of one parameter at a time over a certain range while holding the rest of the vari-ables constant and statistical optimization technique for multivariable effect.
2. DESIGN OF EXPERIMENTS
Response surface methodology is an empirical modeli-zation technique derived to the evaluation of the rela-tionship of a set of controlled experimental factors and observed results. It requires a prior knowledge of the process to achieve statistical model [25-28]. Basically this optimization of process involves three major steps, which are, performing the statistically designed experi-ments, estimating the coefficients in a mathematical model and predicting the response and checking the adequacy of the model.
Y = f (X1, X2, X3, , Xk) (1)
The true relationship between Y and Xk may be
com-plicated and, in most cases, it is unknown, however, a second-degree quadratic polynomial can be used to rep-resent the function in the range of interest;
2 0 1 1 1 1, 2 k k
i i ii i
i i
k k
ij i j i i j j
Y R R X R X
R X X
(2)
where X1, X2, X3, , Xk are the input variables which
affect the response Y, R0, Ri, Rii and Rij (i = 1 – k, j = 1 –
k) are the known parameters, ε is the random error. A second-order model is designed such that variance of Y
is constant for all points equidistant from the centre of the design; 0 i i i X X X X
(3)
where Xi is the coded value, X0 is the actual value at the
center point and ΔXi is the step change value. The
pa-rameters and their values (in brackets) were three levels, like pH (4 - 9), temperature (28˚C, 30˚C, 32˚C, 34˚C, 36˚C), agitation speed (100, 120, 140, 160, 180, 200 rpm), at constant phenol concentration 0.100 g·l–1. This
also enabled the identification of significant effects of interactions for the batch studies. In system involving three significant independent variables X1, X2, and X3,
the mathematical relationship of the response of these variables can be approximated by quadratic (second de-gree) polynomial equation;
2 2 0 1 1 2 2 3 3 11 1 22 2
2
33 3 12 1 2 13 1 3 23 2 3
y b b x b x b x b x b x
b x b x x b x x b x x
(4)
where Y is the predicted value, b0 is the constant, X1 is
the pH, X2 is the temperature, X3 is the agitation speed,
b1, b2 and b3 are linear coefficients, b12, b23 and b13 are
cross product coefficients and b11, b22 and b33 are
quad-ratic coefficients. The low, middle and high levels of each variable were designated as –1, 0, and +1 respec-tively, as given in Table 1. A total of 20 runs were nec-essary to estimate the coefficients of the model using multiple linear regressions. The design of experiments was carried out for analysis using the Statistica 6.0 ver-sion.
3. MATERIALS AND METHODS
3.1. Microorganism
The microorganism P.putida (NCIM 2102) was procured from culture collection NCL, Pune. The microorganism was maintained on beef extract: 1.0 g·l–1; yeast extract:
2.0 g·l–1; peptone: 5.0 g·l–1; sodium chloride: 5.0 g·l–1
and agar: 20.0 g·l–1. The medium was adjusted to pH 7.0
[image:2.595.307.540.635.724.2]by 1 N sodium hydroxide. It was stored at 4˚C ± 1˚C for further use.
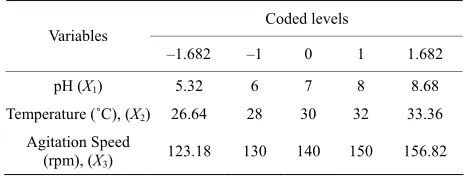
Table 1. Optimization of medium components and the condi-tions of fermentation for the degradation of phenol by P.putida (NCIM 2102).
Coded levels Variables
–1.682 –1 0 1 1.682
pH (X1) 5.32 6 7 8 8.68
Temperature (˚C), (X2) 26.64 28 30 32 33.36
Agitation Speed
3
X
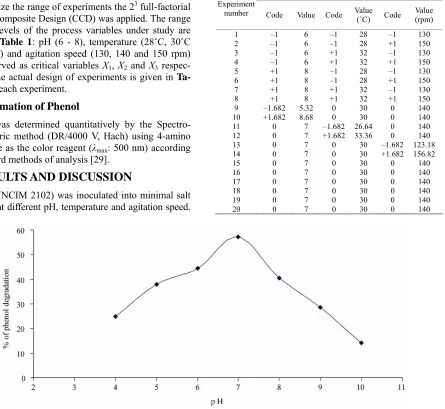
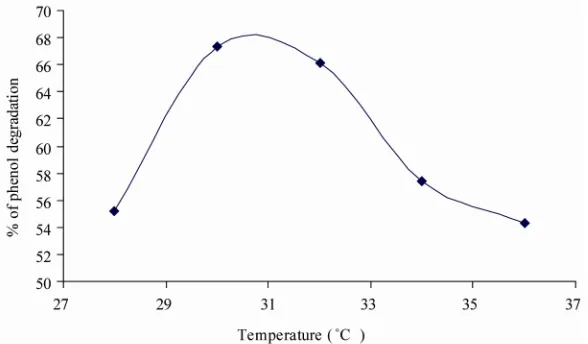
3.2. Optimization Studies The maximum percentage of phenol degradation was
observed at pH (7), temperature (30˚C) and agitation speed (140 rpm) as shown in Figures 1-3. The optimum values of (Figures 1-3), pH (6 - 8), temperature (28˚C, 30˚C and 32˚C) and agitation speed (130, 140 and 150 rpm) were determined using CCD. Using the results of the experiments, the following second order polynomial equation giving the percentage phenol degradation as a function of pH (X1), temperature (X2, ˚C) and agitation
speed (X3, rpm) was obtained by using Statistica 6.0
ver-sion. The physical parameters namely pH: (4 - 9 g·l–1);
tem-perature: (28˚C, 30˚C, 32˚C, 34˚C, 36˚C) and agitation speed: (100, 120, 140, 160, 180, 200 rpm) at constant 0.100 g·l–1 phenol concentration were studied in the
minimal medium composed of dihydrogen potassium phosphate: 1.5 g·l–1; potassium dihydrogen phosphate:
0.5 g·l–1; ammonium sulfate: 0.5 g·l–1; sodium chloride:
0.5 g·l–1; sodium sulfate: 3.0 g·l–1; yeast extract: 2.0 g·l–1;
glucose: 0.5 g·l–1; ferrous sulfate: 0.002 g·l–1 and calcium
chloride: 0.002 g·l–1 by P.putida (NCIM 2102) for the
maximum degradation of phenol. Samples were with-drawn at regular intervals for phenol determination. From the above experiments the range of pH, tempera-ture, and agitation speed were chosen for further opti-mization of the design.
1 2
2 2 2
1 2 3
1 2 2 3 1 3
918.346 22.952 29.584 6.962 1.794 0.595 0.029
0.155 0.036 0.005
y X X
X X X
X X X X X X
(5)
Table 2. The CCD matrix employed for the optimization of medium components and the conditions of fermentation.
3.3. Design of Experiments pH Temperature Agitation Speed
Experiment
number Code Value Code Value (˚C) Code
Value (rpm)
1 –1 6 –1 28 –1 130 2 –1 6 –1 28 +1 150 3 –1 6 +1 32 –1 130 4 –1 6 +1 32 +1 150 5 +1 8 –1 28 –1 130 6 +1 8 –1 28 +1 150 7 +1 8 +1 32 –1 130 8 +1 8 +1 32 +1 150 9 –1.682 5.32 0 30 0 140 10 +1.682 8.68 0 30 0 140 11 0 7 –1.682 26.64 0 140 12 0 7 +1.682 33.36 0 140 13 0 7 0 30 –1.682 123.18 14 0 7 0 30 +1.682 156.82
15 0 7 0 30 0 140
16 0 7 0 30 0 140
17 0 7 0 30 0 140
18 0 7 0 30 0 140
19 0 7 0 30 0 140
20 0 7 0 30 0 140
To optimize the range of experiments the 23 full-factorial
Central Composite Design (CCD) was applied. The range and the levels of the process variables under study are given in Table 1: pH (6 - 8), temperature (28˚C, 30˚C and 32˚C) and agitation speed (130, 140 and 150 rpm) which served as critical variables X1, X2 and X3
respec-tively. The actual design of experiments is given in Ta-ble 2 for each experiment.
3.4. Estimation of Phenol
Phenol was determined quantitatively by the Spectro-photometric method (DR/4000 V, Hach) using 4-amino antipyrine as the color reagent (λmax: 500 nm) according
to standard methods of analysis [29].
4. RESULTS AND DISCUSSION
[image:3.595.95.540.299.708.2]P.putida (NCIM 2102) was inoculated into minimal salt medium at different pH, temperature and agitation speed.
Figure 2. Optimum temperature for phenol degradation.
Figure 3. Optimum agitation speed for phenol deradation.
The predicted values of percentage phenol degrada-tion using the above equadegrada-tion are given in Table 3 along with experimental values.
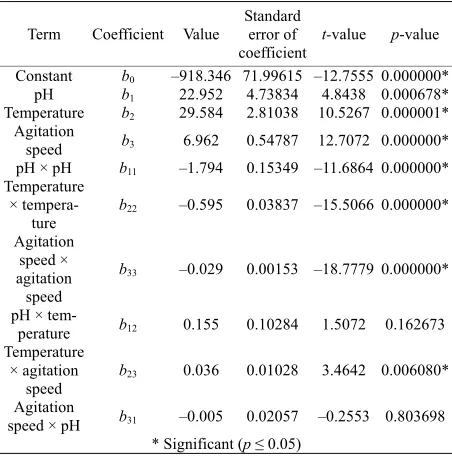
The coefficients of the regression model (Eq.5) cal-culated are listed in Table 4, in which they contain three linear, three quadratic and three interaction terms and one block term. The significance of each coefficient in Eq.5 was determined by student’s t-test and p-values which were also listed in Table 4. The larger the magni-tude of the t-value and smaller the p-value, the more significant is the corresponding coefficient. This implies that the linear and quadratic effects of pH, temperature and agitation speed were highly significant as is evident from their respective p-values. The interaction effect of temperature and agitation speed was found to be signifi-cant (p ≤ 0.05). The remaining two interaction terms i.e.
pH × temperature and agitation speed × pH were found to be insignificant (p > 0.05) which were also presented
in Table 4.
The parity plot (Figure 4) showed a satisfactory cor-relation between the experimental and predicted values (obtained from Eq.5) of percentage phenol degradation, wherein, the points cluster around the diagonal line which indicated the optimal fit of the model, since the deviation between the experimental and predicted values was minimal.
The results of the second order response surface model fitting in the form of Analysis of Variance (ANOVA) were given in Table 5. It is required to test the significance and adequacy of the model. The Fisher variance ratio, the F-value (= S2
r/S2e), is a statistically valid measure of
Table 3. CCD matrix showing real values along with the ex-perimental values of percentage phenol degradation.
% Phenol degradation Run X1 X2 X3
[image:5.595.60.287.104.388.2]Experimental Predicted 1 6 28 130 87.57 87.1215 2 6 28 150 84.47 84.5813 3 6 32 130 85.49 84.8932 4 6 32 150 85.34 85.2030 5 8 28 130 90.48 90.1140 6 8 28 150 87.27 87.3638 7 8 32 130 89.74 89.1257 8 8 32 150 89.28 89.2255 9 5.32 30 140 85.85 86.2451 10 8.68 30 140 91.82 92.1377 11 7 26.64 140 87.57 87.6903 12 7 33.36 140 86.79 87.3824 13 7 30 123.18 86.18 87.1417 14 7 30 156.82 85.34 85.0893 15 7 30 140 94.21 94.2541 16 7 30 140 93.96 94.2541 17 7 30 140 94.28 94.2541 18 7 30 140 94.58 94.2541 19 7 30 140 93.83 94.2541 20 7 30 140 94.79 94.2541
Table 4. Coefficients, t-statistics and significance probability of the model.
Term Coefficient Value Standard
error of coefficient
t-value p-value
Constant b0 –918.346 71.99615 –12.7555 0.000000*
pH b1 22.952 4.73834 4.8438 0.000678*
Temperature b2 29.584 2.81038 10.5267 0.000001*
Agitation
speed b3 6.962 0.54787 12.7072 0.000000*
pH × pH b11 –1.794 0.15349 –11.6864 0.000000*
Temperature ×
tempera-ture b22 –0.595 0.03837 –15.5066 0.000000* Agitation
speed × agitation
speed
b33 –0.029 0.00153 –18.7779 0.000000*
pH ×
tem-perature b12 0.155 0.10284 1.5072 0.162673
Temperature × agitation
speed
b23 0.036 0.01028 3.4642 0.006080*
Agitation
speed × pH b31 –0.005 0.02057 –0.2553 0.803698
* Significant (p ≤ 0.05)
model demonstrates that the model is highly significant, as is evident from the Fisher’s F-test (Fmodel = 85.54974)
and a very low probability value (Pmodel > F = 0.000000).
[image:5.595.310.538.301.393.2]The goodness of the fit of the model was checked by
Figure 4. Parity plot showing the distribution of experimental vs. predicted values of percentage phenol degradation.
Table 5. ANOVA for the entire quadratic model.
Source of variation
Sum of squares (SS)
Degree of freedom
(d.f.)
Mean squares
(MS)
F-value Probe > F
Regression 260.5647 9 28.95164 85.54974 0.000000
Residual 3.3842 10 0.33842
Total 263.9489 19
R² = 0.98717863; Adjusted R² = 0.97563939
the determination coefficient (R2). The R2 value provides
a measure of how much variability in the observed re-sponse values can be explained by the experimental variables and their interactions. The R2 value is always
between 0 and 1. The closer the R2 value is to 1, the
stronger the model is and the better it predicts the re-sponse. In this case, the value of the determination coef-ficient (R2 = 0. 9871) indicates that 98.71% of the
vari-ability in the response could be explained by the model. In addition, the value of the adjusted determination coef-ficient (Adj R2 = 0.9756) is also very high to advocate
for a high significance of the model.
Figures 5-7 represent the contour plots for the opti-mization of physical conditions of percentage phenol degradation. The effect of the pH and temperature on the percentage phenol degradation was shown in Figure 5. An increase in the pH with temperature up to the opti-mum point increased the percentage phenol degradation to a maximum level and a further increase in the pH with temperature the trend is reversed.
[image:5.595.58.284.426.654.2]Figure 5. Contour plot of pH vs. temperature on % phenol degradation (agitation speed was kept constant at 140 rpm).
Figure 6. Contour plot of temperature vs. agitation speed on % phenol degradation (pH was kept constant at 7).
Figure7. Contour plot of agitation speed vs. pH on % phenol degradation (temperature was kept constant at 30˚C).
ally but at a higher agitation speed and temperature the
trend is reversed. The optimum for maximum percentage phenol degradation lies near the center point of the tem-perature and agitation speed.
A similar effect on the response was observed for the agitation speed at any level of the pH. An increase in the agitation speed with pH up to the optimum point in-creased the percentage phenol degradation to maximum level and a further increase in the agitation speed with pH decreased the percentage phenol degradation as shown in Figure 7. Therefore, an optimum was observed near the central value of pH, temperature and agitation speed. The optimum physical conditions for percentage phenol degradation can be attained at the 7.49 of pH, 29.99˚C of temperature and 138.89 rpm agitation speed. At these optimum physical conditions maximum per-centage phenol degradation of 95.12 was obtained.
5. CONCLUSIONS
The true functional relationship between the dependent variable (pH, temperature and agitation speed) and maxi- mum percentage of phenol biodegradation have been studied. The response surface methodology using 23
full-factorial composite design was adopted to optimize these process parameters for the microbial degradation of phenol by P.putida (NCIM 2102). The optimum con-ditions for degradation of phenol by P.putida (NCIM 2102) were as follows: pH 7.49, temperature 29.99˚C and agitation speed138.89 rpm were investigated. A quadratic model was obtained for this design Statistica 6.0 version. The model employed provided good quality of predictions for the above variables in terms of effec-tive phenol degradation and good correlation coefficient 0.9871 was obtained. By this model, we can predict the response for the above variables at any time
REFERENCES
[1] Dos Santos, V.L., De Monteiro, A.S., Braga, D.T. and Santoro, M.M. (2009) Phenol degradation by Aureo-basidium pullulans FE 13 isolated from industrial efflu-ents. Journal of Hazardous Materials, 161, 1413-1420.
doi:10.1016/j.jhazmat.2008.04.112
[2] Vazquez-Rodriguez, G., Youssef, C.B. and Waissman- Vilanova, J. (2006) Two-step modeling of the biodegra-dation of phenol by an acclimated activated sludge. Chemical Engineering Journal, 117, 245-252.
doi:10.1016/j.cej.2005.11.015
[3] Entezari, M.H., Petrier, C. and Devidal, P. (2003) Sono-chemical degradation of phenol in water: A comparison of classical equipment with a new cylindrical reactor. Ultrasonic Sonochemistry, 10, 103-108.
doi:10.1016/S1350-4177(02)00136-0
[5] Mahamuni, N.N. and Pandit, A.B. (2005) Effect of addi-tives on ultrasonic degradation of phenol. Ultrasonic Sonochemistry, 13, 165-174.
doi:10.1016/j.ultsonch.2005.01.004
[6] Lesko, T.M. (2004) Chemical effects of acoustic cavita-tion. Ph.D. Thesis, Institute of Technology, Pasadena, 2004.
[7] Santos, V.L. and Linardi, V.R. (2004) Biodegradation of phenol by a filamentous fungi isolated from industrial ef-fluents-identification and degradation potential. Process Biochemistry, 39, 1001-1006.
doi:10.1016/S0032-9592(03)00201-2
[8] Arutchelvan, V., Kanakasabai, V., Nagarajan, S. and Mu-rali, K.V. (2005) Isolation and identification of novel high strength phenol degrading bacterial strains from phenol-formaldehyde resin manufacturing industrial waste-water. Journal of Hazardous Material, 127, 238-243. [9] Entezari, M.H. and Petrier, C. (2004) A combination of
ultrasound and oxidative enzyme: Sono-biodegradation of phenol. Applied Catalysis B: Environmental, 53, 257- 263. doi:10.1016/j.apcatb.2004.01.025
[10] Kobayashi, H. and Rittmann, B.E. (1982) Microbial re-moval of hazardous organic compounds. Environmental Science & Technology, 16, 170A-183A.
doi:10.1021/es00097a002
[11] Prpich, G.P. and Dauglis, A.J. (2005) Enhanced biodeg-radation of phenol by a microbial consortium in a solid- liquid two-phase portioning bioreactor. Biodegradation, 16, 329-339. doi:10.1007/s10532-004-2036-y
[12] Singh. A. and Ward, O.P. (2004) Biodegradation and biore-mediation. Springer, Berlin, Heidelberg, 2004.
[13] Ruiz-Ordaz, N., Ramirez, J.C.J., Castonon-Gonzalez, H., Lara-Rodriguez, A.R., Christiani-Urbina, E. and Ga-lindez-Mayer, J. (2000) Aerobic bioprocesses and biore-actors used for phenol degradation by free and immobi-lized cells. In: Pandalai, S.G. Ed., Recent Research De-velopments in Biotechnology Bioengineering Research Signpost, Trivendrum, 83-94.
[14] Chang, S.Y., Li, C.T., Chang, M.C. and Shieh, W.K. (1998) Batch phenol degradation by Candida tropicalis and its fusant. Biotechnology and Bioengineering, 60, 391-395.
doi:10.1002/(SICI)1097-0290(19981105)60:3<391::AID -BIT17>3.0.CO;2-P
[15] Ruiz-Ordaz, N., Hernandez-Manzano, E., Ruiz-Lagunez, J.C., Christiani-Urbina, E. and Galindez-Mayer, J. (1998) Growth kinetic model that describes the inhibitory lytic effects of phenol on Candida tropicalis yeast. Biotech-nology Progress, 14, 966-969. doi:10.1021/bp980095x [16] Paller, G., Hommel, R.K. and Kleber, H.P. (1995) Phenol
degradation by Acinetobacter calcoaceticus NCIB 8250. Journal of Basic Microbiology, 35, 325-335.
doi:10.1002/jobm.3620350508
[17] Hughes, E.J., Bayly, R.C. and Skurray, R.A. (1984) Evi-dence for isofunctional enzymes in the degradation of
phenol, m- and p-toluate and p-cresol via catechol meta cleavage pathways in Alcaligenes eutrophus. The Journal of Bacteriology, 158, 79-83.
[18] Leonard, D. and Lindely, N.D. (1998) Carbon and energy flux constraints in continuous cultures of Alicaligenes eutrophus grown on phenol. Microbiology, 144, 241-248. doi:10.1099/00221287-144-1-241
[19] Hill, G.A. and Robinson, C.W. (1975) Substrate inhibi-tion kinetics: Phenol degradainhibi-tion by Pseudomonas putida. Biotechnology and Bioengineering, 17, 1599-1615.
doi:10.1002/bit.260171105
[20] Kotturi, G., Robinson, C.W. and Inniss, W.E. (1991) Phenol degradation by psychotrophic strain of Pseudo-monas putida. Applied Microbiology and Biotechnology, 34, 539-543. doi:10.1007/BF00180585
[21] Folsom, B.R., Champan, P.J. and Pritchard, P.H. (1990) Phenol and Trichloroethylene degradation by Pseudo-monas cepacia G4: Kinetics and interactions between substrates. Applied Environmental and Microbiology, 56, 1279-1285.
[22] Solomon, B.O., Posten, C., Harder, M.P.F., Hecht, V. and Deckwer, W.D. (1994) Energetics of Pseudomonas ce-pacia growth in a chemostat with phenol limitation. Journal of Chemical Technology & Biotechnology, 60, 275-282. doi:10.1002/jctb.280600308
[23] Schroder, M., Muller, C., Posten, C., Deckwer, W.D. and Hecht, V. (1997) Inhibition kinetics of phenol degrada-tion from unstable steady state data. Biotechnology and Bioengineering, 54, 567-576.
doi:10.1002/(SICI)1097-0290(19970620)54:6<567::AID -BIT7>3.0.CO;2-H
[24] Hoq, M.M., Soloman, B.O., Hempel, C., Rinas, U. and Deckwer, W.D. (1995) The kinetics of cellulose-free xy-lanase excretion by Thermomyces langiosus RT9. Jour-nal of Chemical Technology & Biotechnology, 63, 229- 236.
[25] Gopinath, S.C.B., Hilda, A., Lakshmipriya, T., Annadurai, G. and Anbu, P. (2003) Statistical optimization of amy-lase production by Aspergillus versicolor. Asian Journal of Microbiology Biotechnology and Environmental Sci-ence, 5, 327-330.
[26] Box, G.E.P. and Behnken, D.W. (1960) Three level de-sign for the study of quantitative variables. Technomet-rics, 2, 455-475. doi:10.2307/1266454
[27] Box, G.E.P. and Hunter, J.S. (1957) Multi-factor experi-mental designs for exploring response surfaces. Annals of Mathematical Statistics, 28, 195-241.
doi:10.1214/aoms/1177707047
[28] Cochran, W.G. and Cox, D.W. (1968) Experimental de-sign. John Wiley and Sons, Inc., New York, 611-626. [29] American Public Health Association (APHA), American