ISSN Online: 2327-5227 ISSN Print: 2327-5219
DOI: 10.4236/jcc.2019.77023 Jul. 31, 2019 283 Journal of Computer and Communications
Research on Railway Passenger Flow
Prediction Method Based on GA Improved BP
Neural Network
Jian Zhang
*, Weihao Guo
School of Science, Beijing University of Civil Engineering and Architecture, Beijing, China
Abstract
This paper chooses passenger flow data of some stations in China from Janu-ary 2015 to March 2016, and the time series prediction model of BP neural network for railway passenger flow is established. But because of its slow convergence speed and easily falling into local optimal solution of the prob-lem, we propose to improve the time series model of BP neural network by genetic algorithm to predict railway passenger flow. Experimental results show that the improved method has higher prediction accuracy and better nonlinear fitting ability.
Keywords
Railway Passenger Flow, Prediction, BP Neural Network, Genetic Algorithm
1. Introduction
With the Notice of the National Development and Reform Commission of the People’s Republic of China on the reform and improvement of the passenger fare policy for high-speed trains in February 2016, the high-speed train fares will be priced by the railway headquarters [1]. In order to maintain market competi-tiveness and maximize profits, the railway sector needs to understand the daily passenger traffic, the off-season fluctuation index and the specific conditions of hot and cold lines. Therefore, it is necessary to predict the passenger flow of the railway.
However, railway passenger flow is affected by many factors, such as the rapid growth of railway passenger flow during the Spring Festival, which leads to the inability of railway capacity to meet customer demand for passenger transport, and also brings great pressure to railway passenger transport organizations. How to cite this paper: Zhang, J. and Guo,
W.H. (2019) Research on Railway Passen-ger Flow Prediction Method Based on GA
Improved BP Neural Network. Journal of
Computer and Communications, 7, 283-292. https://doi.org/10.4236/jcc.2019.77023
DOI: 10.4236/jcc.2019.77023 284 Journal of Computer and Communications During non-holiday period, some unpopular line occupancy rate is insufficient, resulting in the waste of railway vehicles. Therefore, the prediction of railway passenger flow is of great significance for improving the efficiency of railway passenger transport by helping to set reasonable prices, improving the organiza-tion mode of passenger staorganiza-tions, optimizing the allocaorganiza-tion of railway vehicle re-sources and improving the service capacity of passenger transport equipment [2].
This paper aims to study the application of BP neural network and its im-proved algorithm in railway passenger flow prediction.
2. Domestic and Foreign Research Status
At present, railway travel in China is the first choice of transportation mode for the people. Experts hope to optimize vehicle dispatch and guide the develop-ment of the railway industry by analyzing the passenger flow data of a certain area for several consecutive years.
In recent years, Wu Xinhui put forward “by adopting genetic algorithm to op-timize parameters of RBF neural network, a better solution to the RBF neural network is easy to fall into local optimum problem, in the railway passenger traf-fic forecasting, through the comparison shows that GA-RBFNN model to predict the results of the stability and convergence speed, high precision, good maneu-verability, the railway enterprise management decision has a good guiding signi-ficance [3]”; Chen Peng, Sun Quanxin proposed that the railway passenger traf-fic forecasting method based on the gray CM(1,1) Markov process and fuzzy clustering method is a new forecasting method and is a method based on the forecast of the total traffic volume of the Chinese railway network. The predic-tion effect on a particular line may not be ideal, but it has a unique advantage in predicting the overall passenger volume [4] [5]. This method of forecasting takes into account the random change forecast and growth trend forecast of railway passenger traffic. Considering that it is more in line with the actual situation of railway passenger transport and can guide passenger transport of railways more
effectively. Wang Jianxiong et al. proposed a two-layer orthogonal neural
parame-DOI: 10.4236/jcc.2019.77023 285 Journal of Computer and Communications ters can effectively avoid the phenomenon of over-fitting and under-fitting, and has strong practical ability and accurate characteristics; Gui Wenlin and Han Zhaozhou applied the Tramo/Seats seasonal adjustment model for the first time in the field of passenger traffic forecasting in China. The seasonal adjustment model introduced a pre-adjustment module to pre-adjust the trading days and outliers to make the factor decomposition more accurate: The history and future trends and seasonal characteristics of passenger traffic are analyzed, and the Holt-Winters model can only obtain the above characteristics of the final period [8]. Although this model has high accuracy, it does not include holidays, espe-cially like such a holiday as the Spring Festival, due to the existence of the Spring Festival, makes such a model unable to better predict the passenger flow and then conduct a comprehensive guiding role, and can only guide the normal railway passenger transport operation.
Based on the characteristics of genetic algorithm, this paper proposes a BP neural network time series algorithm based on GA, and establishes a railway passenger flow prediction model.
3. BP Neural Network Time Series Prediction Model
[image:3.595.253.501.519.710.2]In general, the most common BP neural network topology is a three-layer struc-ture (shown in Figure 1), an input layer, an output layer, and a hidden layer in the middle. In this paper, the sigmoid function is used as the activation function in the hidden layer, and the tansig function is used as the activation function in the output layer. The traffic of the previous n years is selected to predict the traf-fic volume of the next year, and the time series model is established. When de-termining the number of hidden layer nodes, the selection scheme is to select the number of hidden layer nodes as little as possible, simplify the structure of the BP neural network, and obtain errors in the network training through the train-ing set; then slowly increase the number of nodes in the hidden layer and con-tinue training. Obtain an error and repeat the above steps until the error is no
DOI: 10.4236/jcc.2019.77023 286 Journal of Computer and Communications longer significantly reduced. Finally, the number of hidden layer nodes selected by the test is 6 [9] [10].
Because the BP algorithm is a faster gradient descent algorithm, it is easy to fall into the local minimum problem and is improved by GA.
4. GA Improved BP Neural Network Prediction Model
Genetic algorithm is a global search algorithm [11]. Firstly, all individuals in a population are randomly initialized. Each individual is a set of initial thresholds and weights, and the fitness value of each individual is obtained. The genetic al-gorithm is used to make the population evolve in constant iterations, and finally get the most. An excellent individual, as the initial threshold and weight of the neural network. This not only makes up for the shortcomings of randomly se-lecting the initial threshold and weight on the ordinary BP neural network, but also can fully exert the mapping ability of BP neural network, so that it has strong learning ability and faster convergence (Figure 2).
According to the above, it has been determined that the BP neural network structure is 4 − 6 − 1, a total of 6 + 1 = 7 thresholds, 4 × 6 + 6 × 1 = 30 weights. Since the genetic algorithm uses real coding, the length of each individual in the population is 30 + 7 = 37.
[image:4.595.213.534.418.704.2]Random initialization of these individuals according to the real number cod-ing method is equivalent to randomly initializcod-ing the initial threshold and weight of a batch of neural networks, and then calculating the fitness values of these
DOI: 10.4236/jcc.2019.77023 287 Journal of Computer and Communications individuals, based on the fitness value, and selecting them one by one. The cros-sover and mutation operations evolve the population until the number of evolu-tion iteraevolu-tions is reached, and the individuals with the highest fitness within the final population are used as the initial threshold and weight of the optimized BP neural network.
The training set is substituted into GA improved BP neural network training, and the test set is used for testing and simulation prediction.
5. Experiment
5.1. Preliminary Analysis of Data
The experiment selects the passenger flow data of several stations in a certain area of China from January 2015 to March 2016. Firstly, the passenger flow and the passenger load rate are analyzed statistically on the train type, train number, time zone and date, and the following conclusions are obtained:
1) The total number of trains at the beginning of G, D, and K accounts for about 90% of the total number of trains. High-speed trains and trains are the main types of trains (see Figure 3).
2) Except for T01, the average passenger load rate of trains starting with T is less than 20%. Therefore, it is necessary to consider whether the following ve-hicles can be used efficiently (see Figure 4).
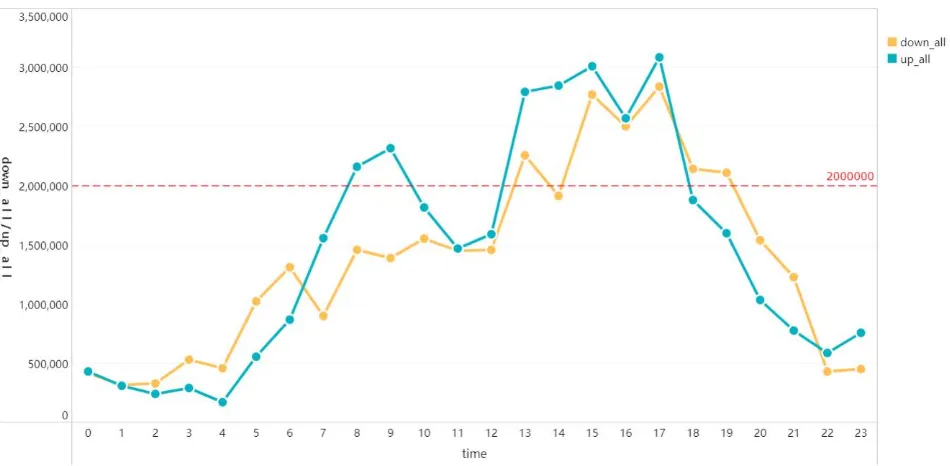
3) The peak period of the flow of people within 24 hours a day is from 1 pm to 5 pm, indicating that the afternoon time is the peak of the flow of people. The relevant departments of the railway can conduct targeted traffic flow during peak hours and increase the number of service personnel at the station (see Fig-ure 5).
[image:5.595.213.370.547.703.2]4) The passenger load factor in summer is higher than that in spring, autumn and winter. The average daily passenger load factor in summer is over 70%. The main reason is that the summer vacation is the peak period for students to re-turn home and travel, and the transfer of migrant workers can also increase the
DOI: 10.4236/jcc.2019.77023 288 Journal of Computer and Communications Figure 4. Train number and average passenger load rate scatter plot.
Figure 5. Line chart of the total number of people getting on and off at each time.
passenger load factor to a certain extent. Holidays should also be given as an important factor in the train deployment program (see Figure 6).
5.2. GA Improved BP Neural Network to Predict Railway
Passenger Flow
[image:6.595.63.538.339.572.2]DOI: 10.4236/jcc.2019.77023 289 Journal of Computer and Communications Figure 6. Date and corresponding passenger line chart.
Figure 7. Optimal individual fitness value curve.
[image:7.595.274.475.522.689.2]DOI: 10.4236/jcc.2019.77023 290 Journal of Computer and Communications than the actual output compared with the actual output value of the passenger flow, and the prediction result of the BP neural network prediction model im-proved by the genetic algorithm [12] can Reduce this error and be more stable and stable. The absolute error of the two algorithms is given by Figure 9.
[image:8.595.242.504.250.472.2]It can be seen from Figure 9 that the absolute error of the BP neural network improved by the genetic algorithm is generally smaller than the absolute error of the standard BP neural network, but the relative error is more sensitive to the test than the absolute error. The relative error refers to a value obtained by multiplying the ratio of the absolute error caused by the measurement to the measured true value by 100%, expressed as a percentage. A comparison of the absolute values of the relative errors of the two models is given below, as shown in Figure 10.
Figure 9. Comparison of absolute error between two models and true values.
[image:8.595.248.480.510.692.2]DOI: 10.4236/jcc.2019.77023 291 Journal of Computer and Communications The two peaks in Figure 10 correspond to the New Year’s Day in 2016 and the Spring Festival in 2016. It can be more clearly seen from the figure that the standard BP neural network railway passenger traffic prediction model is not accurate for the prediction results for certain holidays, and has a large deviation from the real value, and the genetic algorithm has been improved. The BP neural network prediction model not only performs better on non-holiday prediction performance than the standard BP neural network, but also has a great precision improvement for the prediction of holidays compared with the standard BP neural network prediction model.
6. Conclusion
The simulation results show that the BP neural network prediction model based on the initial threshold and weight of BP neural network optimized by genetic algorithm is better than the standard BP neural network in predicting railway passenger flow, and the prediction result is stable. Especially for the prediction of certain holidays, it can greatly reduce the prediction error, has strong robust-ness, can better deal with the problem that BP neural network is easy to fall into local optimum, and improve the convergence speed of the model. Compared with the standard BP neural network prediction model, this model has higher prediction accuracy and better nonlinear fitting ability for railway passenger flow time series.
Acknowledgements
This work was supported by scientific research fund project in Beijing University of Civil Engineering and Architecture (KYJJ2017035).
Conflicts of Interest
The authors declare no conflicts of interest regarding the publication of this pa-per.
References
[1] Wang, H.Y. (2003) Intelligent Ticket Allocation Method Based on Passenger Flow Prediction. China Railway Science.
[2] Luo, X.Y. (1998) Passenger Flow Prediction and Competition Model of Railway. Southwest Jiaotong University, Chengdu.
[3] Wu, X.H. (2010) Optimization Prediction of Railway Passenger Traffic Volume Based on Neural Network. Computer Simulation, 27, 168-170.
[4] Chen, P. and Sun, Q.X. (2005) Research on Railway Passenger Volume Forecast Method Based on Gray Markov Process. Railway Transportation and Economy, 27, 65-67.
[5] Hou, L.M. and Ma, G.F. (2011) Prediction of Railway Passenger Volume Based on Grey Linear Regression Combination Model. Computer Simulation, 28, 1-3, 30. [6] Wang, J.X., Liu C.H., Shan, X.H. and Zhu, J.S. (2010) Railway Passenger Volume
DOI: 10.4236/jcc.2019.77023 292 Journal of Computer and Communications Science, 32, 126-132.
[7] Zhou, H.R. and Zheng, P.Y. (2007) Parameter Optimization of LS-SVM and Fore-cast of Railway Passenger Transport Market. Computer Engineering and Applica-tion, 44, 206-208.
[8] Gui, W.L. and Han, Z.Z. (2011) Analysis of Fluctuation of Passenger Volume of China’s Railway Based on Seasonal Adjustment Model. Railway Transport and Economy, 33, 78-82.
[9] Liu, Y., Dai, Y. and Cao, J.H. (2008) Prediction of Flow Chaotic Time Series Based on Wavelet Neural Network. Computer Engineering, 34, 105-106.
[10] Wang, Z., Wang, Y.H. (2005) Application of Improved BP Neural Network in Rail-way Passenger Volume Time Series Prediction. Journal of Central South University, 36, 158-162.
[11] Shi, Y.S. and Song, Y.X. (2004) Fault Diagnosis Model Based on Genetic Algorithm and BP Neural Network. Computer Engineering, 30, 125-127.