A L G O R I T H M S F O R
M A R S S P E C T R A L C T
A thesis submitted in partial fulfilment of the
requirements for the Degree of
Master of Science in Medical Physics
at the
University of Canterbury
by
David Warwick Knight
A B S T R A C T
This thesis reports on algorithmic design and software development completed for the Medipix All Resolution System (MARS) multienergy CT scanner. Two areas of research are presented -the speed and usability improvements made to -the post-reconstruction material decomposition software; and the development of two algorithms designed for the implementation of a novel voxel system into the MARS image reconstruction chain.
The MARS MD software package is the primary material analysis tool used by members of the MARS group. The photon-processing ability of the MARS scanner is what makes material decomposition possible. MARS MD loads reconstructed images created after a scan and creates a new set of images, one for every individual material within the object. The software is capable of discriminating at least six different materials, plus air, within the object. A significant speed improvement to this program was attained by moving the code base from GNU Octave to MATLAB and applying well known optimisation routines, while the creation of a graphical user interface made the software more accessible and easy to use. The changes made to MARS MD represented a significant contribution to the productivity of the entire MARS group.
A drawback of the MARS image reconstruction chain is the time required to generate images of a scanned object. Compared to commercially available CT systems, the MARS system takes several orders of magnitude longer to do essentially the same job. With up to eight energy bins worth of data to consider during reconstruction, compared to a single energy bin in most com-mercial scanners, it is not surprising that there is a shortfall. A major performance limitation of the reconstruction process lies in the calculation of the small distances travelled by every de-tected photon within individual portions of the reconstruction volume. This thesis investigates a novel volume geometry that was developed by Prof. Phil Butler and Dr. Peter Renaud, and is designed to partially mitigate this time constraint. By treating the volume as a cylinder instead of a traditional cubic structure, the number of individual path length calculations can be drastically reduced. Two sets of algorithms are prototyped, coded in MATLAB, C++ and CUDA, and finally compared in terms of speed and visual accuracy.
The way the processor industry is going, is to add more and more cores, but nobody knows how to program those things. I mean, two, yeah; four, not really; eight, forget it.
— Steve Jobs (n.d.).[1]
A C K N O W L E D G M E N T S
I would like to thank Prof. Philip Butler, Assoc. Prof. Anthony Butler, Dr. Stephen Bell, Dr. Steve Marsh, Dr. Peter Renaud, Christopher Bateman, and Brian Goulter for supervising my master’s research. Phil provided an endless supply of inspiration and refreshing optimism for everyone in the MARS group, and he, Anthony and Stephen always encouraged a friendly and approachable working environment. Thanks to Steve for running the Medical Physics program and for offer-ing useful and timely advice throughout my journey. Many thanks to Christopher Bateman who gave me insight into the MARS project, particularly with his mind-bending explanations of the mathematics behind material decomposition. He also went above and beyond when it came to proof-reading this document. Special thanks to Brian who was my sounding board throughout this entire process. Brian could always find the time to listen to my crazy ideas and exhaust-ing thought processes. He is also credited with createxhaust-ing many of the amazexhaust-ing diagrams littered throughout this thesis. I would also like to acknowledge the MARS group for awarding me a masters scholarship. The support given by everyone in the MARS group, of which there are far too many to name, was always much appreciated. Of special note are Kishore and Joe who ea-gerly embraced the new MARS MD, offered ideas for further improvements and finding all of the sneaky bugs. Thanks to Niels de Ruiter for his technical assistance with the MARS reconstruction workstation.
C O N T E N T S
Abstract iii
Acknowledgements iv
Table of Contents v
List of Figures ix
1 I N T R O D U C T I O N 1
1.1 Research Motivation . . . 3
1.2 Clinical Significance . . . 3
1.3 Development Tools . . . 4
1.4 Thesis Outline . . . 4
2 B A C K G R O U N D 7 2.1 Computed Tomography Imaging . . . 7
2.2 MARS . . . 9
2.3 Image Reconstruction Techniques . . . 10
2.3.1 Background Physics . . . 10
2.3.2 Filtered Back-projection . . . 14
2.3.3 Algebraic Reconstruction Technique . . . 15
2.4 High-Performance Computing . . . 17
3 M A R S M D 21 3.1 Introduction . . . 21
3.2 X-ray Interactions in Medical Imaging . . . 23
3.3 Material Decomposition . . . 23
3.4 MD Algorithm . . . 25
3.5 Software Improvements . . . 25
3.6 Graphical User Interface . . . 31
3.7 Other New Features . . . 33
3.8 MARS MD Gallery . . . 34
3.8.1 Multi-material Phantom . . . 35
3.8.2 Lamb Meat Imaging . . . 35
3.8.3 Osteoporosis Arthritis Imaging . . . 35
3.9 Discussion . . . 37
3.10 Summary . . . 39
4 C Y L I N D R I C A L V O L U M E G E O M E T RY 41 4.1 Introduction . . . 41
4.2 Related Works . . . 43
4.3 Cylindrical Volume Geometry . . . 46
4.4 Fan-Beam Geometry . . . 49
4.5 Parallel-Beam Geometry . . . 53
4.6 Allocation of Ring Path Length to Voxels . . . 55
4.7 Index Conversion . . . 58
4.8 Conclusion . . . 59
4.9 Summary . . . 59
5 S Y S T E M M AT R I X C R E AT I O N 61 5.1 Introduction . . . 61
5.2 Related Works . . . 62
5.3 MATLAB Implementation . . . 64
5.4 CUDA . . . 69
5.5 MEX & CUDA Implementations . . . 71
5.6 Performance Testing . . . 73
5.7 Discussion . . . 73
5.8 Conclusion . . . 75
5.9 Summary . . . 76
6 V O L U M E V I S U A L I S AT I O N 77 6.1 Introduction . . . 77
6.2 Related Works . . . 78
6.3 Grid Overlay Mapping . . . 80
6.3.1 MATLAB Implementation: VoxelMapFun . . . 82
6.3.2 MATLAB Implementation: PointMapFun . . . 84
6.3.3 MEX & CUDA Implementation . . . 85
6.4 Performance Testing . . . 87
6.5 Image Reconstruction Analysis . . . 90
6.5.2 Square Geometry . . . 92
6.5.3 Circular Geometry . . . 94
6.5.4 Circular Geometry with Path Length Correction . . . 95
6.6 Discussion . . . 96
6.7 Conclusion . . . 99
6.8 Summary . . . .100
7 C O N C L U S I O N 101 7.1 MARS MD Improvements . . . .101
7.2 Cylindrical Volume Geometry . . . .101
B I B L I O G R A P H Y 103
L I S T O F F I G U R E S
Figure 1 Differences between standard CT, dual-energy CT, and spectral CT. The photon counting capability of the Medipix detector is what differentiates the MARS scanner from competing dual-energy scanners [2]. . . 8 Figure 2 Photograph of a MARS scanner. . . 10 Figure 3 The MARS scanner collects photons in the range of 20 - 120 keV, and
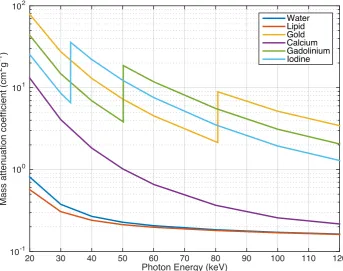
the mass attenuation profiles of some of the most commonly searched for materials are displayed. The human body is largely composed of lipid (fat), water and bone, which unfortunately have very similar attenuation profiles due to their K-edges sitting below the diagnostic imaging range [3]. 12 Figure 4 Coordinate system of the Radon transform. . . 13 Figure 5 A Radon transform applied to a Shepp-Logan phantom generates a
pro-jection image known as a sinogram. Each column in the sinogram is made up all parallel projections for a given projection angle. . . 14 Figure 6 As the volume rotates about the z-axis, individual ray lines will pass through
different combinations of voxels (MARS Bioimaging, 2014). . . 17 Figure 7 The core functionality of MARS MD. Air components are set to zero and
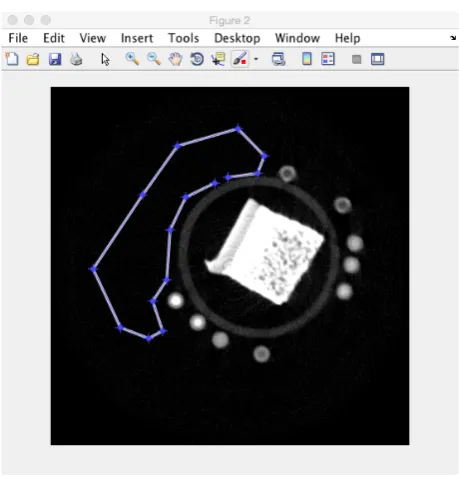
ignored, soft tissue components are decomposed into lipid and water, and high-Z materials are decomposed with the CMD algorithm. . . 26 Figure 8 The MARS MD GUI was designed with non-expert users in mind. . . 32 Figure 9 A popup window allows the user to draw a polygon around part of the CT
image which is used to create the covariance matrix. . . 33 Figure 10 Multi-material phantom scanned with a Medipix-3RX (CdTe) camera
op-erating in charge-summing mode [3]. . . 36 Figure 11 Photograph of the lamb meat sample (top left), reconstructed Hounsfield
unit image of the sample (top right), and bone, water-like, and lipid-like material decomposition images of the same (bottom). [3]. . . 37 Figure 12 Excised cartilage sample containing an iodine contrast agent. Arthritic
car-tilage is identified by deep penetration of the contrast agent [3]. . . 38
Figure 13 Right-handed set of Cartesian coordinates are fixed to the gantry frame and the cylindrical volume rotates and translates within the frame. The central ray is measured by the grey detector pixel, and rays at angles q
andfare measured by nearby pixels (MARS Bioimaging, 2014). . . 42
Figure 14 Visualisation of the first 10 rings in a disk. . . 46 Figure 15 The almost cubic shape of a single voxel (MARS Bioimaging, 2014). . . 47 Figure 16 Quadratic relationship between the number of rings and the number of
voxels in a disk. . . 48 Figure 17 Four rays traverse the reconstruction volume and arrive at separate
detec-tor elements (MARS Bioimaging, 2014). . . 50 Figure 18 Path length through ring i can be calculated using simple
trigonome-try. The x-ray leaves the source, S, and intersects ring i twice. The path lengths,LG
i andLDi , in neighbouring quadrants are identical (MARS
Bioimag-ing, 2014). . . 50 Figure 19 Dependence on f further complicates path length calculations because
the ray may pass through several neighbouring disks within the volume (MARS Bioimaging, 2014). . . 51 Figure 20 The circular geometry is intersected by a ray parallel to thex-axis (MARS
Bioimaging, 2014). . . 54 Figure 21 The chord length is determined by the formulaa=2ph(2R h)[4]. . . . 55 Figure 22 Five voxels intersected by a ray line at an angle of 3°. The left-most (light
grey) voxel will likely be ignored by the reconstruction algorithm. . . 55 Figure 23 Calculation ofLa = p3b. . . 56
Figure 24 Minor variations in x-ray angle have profound effects over which voxels will be included in the path length calculations. . . 57 Figure 25 Fan beam model configuration displaying x-ray source, x-ray path, circular
volume, and detector elements. Intersected voxels are coloured with vary-ing shades of grey, where a darker shade indicated a longer intersection. The intersected detector element is coloured green. . . 65 Figure 26 Close up view of the circular volume using the same parameters as Fig.25. 66 Figure 27 The MEX version of Alg.5is the most efficient implementation. The
Figure 28 A 2D voxel is enclosed by two straight lines which intercept the origin and two circles which are centred on the origin. The area within the four edges can be classified with the two gradients m1 and m2 and the two radiir1
andr2. . . 80
Figure 29 A simple point mapping procedure was implemented to transform the cir-cular geometry into square pixels. . . 81 Figure 30 The GPU has a limited amount of global memory that must be carefully
managed by the developer. The two methods of memory management attempted in the CUDA implementation of PointMapFun are outlined. . . . 88 Figure 31 The highly parallel nature of PointMapFun results in an impressive speedup
on the GPU when compared to the same algorithm running in MATLAB code and standard C/C++ code through the MEX interface. . . 89 Figure 32 Phantoms used for filtered back-projection (FBP) reconstruction testing. . . 91 Figure 33 Performing filtered back-projection image reconstruction of both
phan-toms with 720 projection angles using the square geometry. The only no-ticeable image artefacts are the predictable blurred edges that occur at object boundaries. . . 93 Figure 34 Filtered back-projection images generated with the circular geometry. There
are noticeable image artefacts present in both sets of images, likely caused by assumptions made about voxel shapes within the algorithm. . . 95 Figure 35 Filtered back-projection images generated with the circular geometry and
a path length correction factor applied. The spiral and circular artefacts have mostly disappeared, but have been replaced by artefacts in the cen-tres of the images that are reminiscent of beam hardening artefacts. . . 97 Figure 36 Empty spaces along the ray line can potentially cause image artefacts
dur-ing reconstruction. . . 98
1
I N T R O D U C T I O NThis thesis reports on developments I have made in spectral computed tomography (CT) image reconstruction and material decomposition (MD) techniques for the Medipix All Resolution Sys-tem (MARS). The current MARS image processing chain does a good job, but there is room for significant improvement in terms of both computation speed and image quality. As at the end of this thesis, reconstruction can take anywhere from a couple of hours to a couple of days, depend-ing on the size of the data sets bedepend-ing processed. Material decomposition is the second step in the image processing chain, with it taking several hours to process an entire set of CT slices. Because of these issues, research being conducted by students in the MARS group is often stifled, with the progress of the entire project being restricted as a flow-on effect. In order for the MARS scanner to become a commercially successful product, the performance of these key processes need to be improved. The development of hardware and software for the MARS project is a dynamic and fast-moving process, with new and improved systems always on the horizon. Creating efficient software is an important consideration, but so too is the type of hardware that the software will run on. The increasingly powerful graphics processing units (GPUs) offer potential solutions to the ever-present need for faster image reconstruction. But the answer is not so clear-cut, and the benefits and drawbacks of both the central processing unit (CPU) and the GPU must be care-fully considered for every new algorithm. There is no one-size-fits-all piece of hardware that will satisfy all situations.
the code base from GNU Octave to MATLAB allowed for a number of additional improvements, including parallelising the three core algorithms and designing a graphical user interface (GUI). The work completed on MARS MD for the first part of this thesis ultimately led to some impres-sive performance improvements, with computation times reducing from hours to minutes. This result has led to a significant increase in the volume of MD work being completed by students, and has contributed to the publication of several research papers and research grant applications. The MARS image processing chain is made up of several discrete steps: (1) image pre-processing, such as ignoring bad pixels and reducing detector noise; (2) CT image reconstruction; and (3) material decomposition. A major area of research currently being conducted promises to merge these steps into a single operation. The new algebraic reconstruction technique (ART)-based reconstruction method is heavily reliant on the polychromatic Beer-Lambert Law, and is being developed by members of the MARS group. By performing image reconstruction and material decomposition simultaneously, the MARS scanner will be able to produce better quality images in a fraction of the time. Iterative image reconstruction methods such as ART are notoriously slow, in part because of the significant number of individual photon path lengths that need to be calculated at each iteration. One portion of the new algorithm relates to how the scanned ob-ject is represented in memory, with the obob-ject being treated as a cylinder instead of a traditional cuboid. The cylindrical volume is composed of concentric rings, and the individual voxels within each ring are a very close approximation to being cubic. Developed by Prof. Philip Butler and Dr. Peter Renaud (University of Canterbury), this novel approach to cylindrical volume geometry investigated in this thesis is capable of significantly reducing the number of photon path length calculations needed to complete a reconstruction. In a traditional cuboid reconstruction, the sys-tem matrix composed of the individual path lengths required per iteration is so large that it can’t realistically be stored in memory. Instead, it must be repeatedly computed during the reconstruc-tion process, a major factor in the poor performance of ART-based algorithms. The cylindrical volume geometry is capable of reducing the size of the system matrix by several orders of mag-nitude, allowing the system matrix to be pre-computed and stored before the scan takes place. The second part of this thesis presents programming implementations and analysis for a large part of the cylindrical volume geometry formulation, and provides valuable insight into what will become a core component of the MARS scanner.
The remainder of this chapter briefly discusses the rationale and significance of the MARS project. Section 1.1 outlines my key motivations for completing this research project; section 1.2 briefly discusses the clinical importance of the MARS project; and section1.3 describes the
software and hardware tools employed throughout this thesis. The chapter concludes in section 1.4with outlines of the chapters in this thesis.
1.1 R E S E A R C H M O T I VAT I O N
With a background in both computer science and physics, I find myself fascinated by the interdis-ciplinary work being conducted in the field of medical physics. The MARS group is developing cutting-edge technologies that will assist in making remarkable breakthroughs in medicine, a truly inspiring goal. I have always had a keen interest in the semiconductor industry and its abil-ity to follow Moore’s Law in developing faster computer processors, and the move to multi-core CPUs and GPUs has ushered in new and exciting programming paradigms. These technologies are routinely implemented in medical devices such as CT and MRI scanners, due to the large amount of data processing that needs to be completed quickly. The MARS scanner is no exception and improvements need to be made to the underlying computational efficiency of almost every aspect of the project, not only for the benefit of research students, but also for customers and clinical researchers who rely on the MARS scanner.
The motivation of this research project is to make positive contributions to the productivity of the MARS group, and the objectives for this thesis can be grouped into two sections:
• Implement a solution that takes advantage of any inherent parallelism in the existing mate-rial decomposition software, and improve the overall usability of the software to encourage student comprehension and experimentation.
• Perform the initial implementation and analysis of a novel approach to calculating photon path length within a reconstruction volume. By designing algorithms for both the CPU and the GPU and comparing their performance, the appropriate type of hardware that best suits the specific problem can be determined.
1.2 C L I N I C A L S I G N I F I C A N C E
MARS research includes locating regions of atherosclerosis plaque with gold contrast agents, and measuring drug delivery to tumours in mouse models [3]. The image reconstruction software and the material analysis techniques that are discussed in chapter3are what makes this research possible, and delivering this analysis quickly is of vital importance to everyone involved in the MARS project.
1.3 D E V E L O P M E N T T O O L S
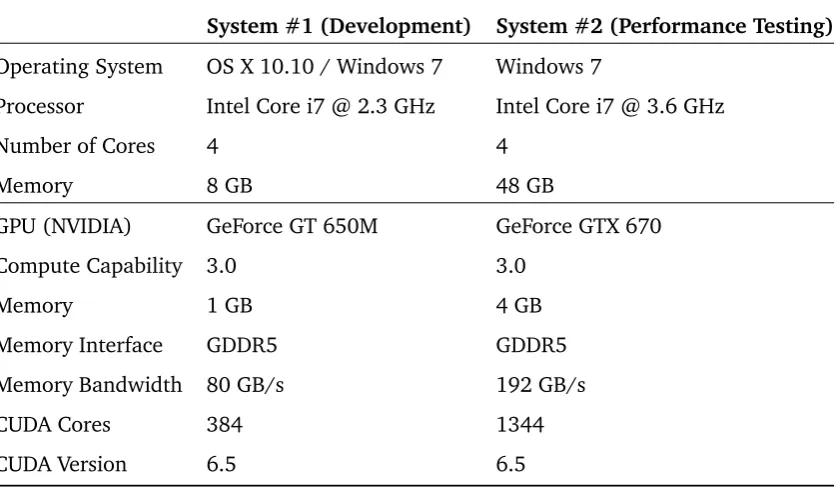
The key similarities and differences when the two computer systems used throughout this thesis are outlined in Table1. All software development was completed on system #1, and development was greatly simplified due to the two systems sharing a number of important properties such as GPU compute capability. Even though the GPU housed within system #2 was significantly more powerful, it still had the same underlying technology and capabilities as the GPU in system #1. This meant that the same code could be used on both GPUs with no changes necessary. System #2 is the primary image reconstruction computer used by members of the MARS group. This system was the best option for algorithm performance testing because it represented similar hardware and software configurations that future MARS reconstruction systems are likely to employ.
All algorithm development and performance testing took place within the MATLAB program-ming environment. Being an interpreted language, MATLAB can suffer from extremely poor per-formance compared to code written in a compiled language such as C and C++. Xcode and NVIDIA Nsight Eclipse Edition were jointly used to develop subroutines in C++ and CUDA, which were executed within MATLAB through the MEX interface.
1.4 T H E S I S O U T L I N E
This thesis reports on parallelisation methods applied to two distinct parts of the MARS scanner: (1) the material decomposition software called MARS MD, presented in chapter 3; and (2) the novel approach to cylindrical volume geometry that will be integrated into the image processing chain, presented in chapters4,5and6. Chapter2provides the necessary background to the work presented in this thesis. Overviews of the relevant x-ray physics and parallelisation techniques are presented in chapters3and5, respectively. Finally, a conclusion to the thesis is given in chapter 7. Detailed summaries of chapters2-6are provided below.
Table 1: Computer hardware used for the software development and performance testing aspects of this thesis.
System #1 (Development) System #2 (Performance Testing)
Operating System OS X 10.10 / Windows 7 Windows 7
Processor Intel Core i7 @ 2.3 GHz Intel Core i7 @ 3.6 GHz
Number of Cores 4 4
Memory 8 GB 48 GB
GPU (NVIDIA) GeForce GT 650M GeForce GTX 670
Compute Capability 3.0 3.0
Memory 1 GB 4 GB
Memory Interface GDDR5 GDDR5
Memory Bandwidth 80 GB/s 192 GB/s
CUDA Cores 384 1344
CUDA Version 6.5 6.5
Chapter2provides background to the technologies of computed tomography (CT) and spectral CT. MARS and the Medipix detector are introduced, specifically in relation to spectral imaging. The medical imaging concepts of FBP and ART are described, and the chapter concludes with a brief discussion of the exciting field of high-performance computing.
Chapter 3 begins by describing the process of material decomposition and how it relates to the MARS scanner. The unique contributions of MD to medical imaging and other industries are discussed. The performance improvements made to the material decomposition software MARS MD are explained, as well as the design choices made when developing the graphical user interface. Finally, the overall contribution these changes made to the research efficiency of the MARS group is briefly discussed.
Chapter 5 discusses the motivation and choices made in the partial implementation of the circular volume geometry, specifically in regards to the calculations of voxels intersected and path lengths within voxels. Because the voxels are treated as being up to103 times smaller than
those used by a traditional CT scanner, the algorithm development works under the assumption that not every individual path length needs to be calculated. This potentially time-saving measure is investigated when the algorithm is developed in MATLAB before porting to C++ and CUDA.
Chapter 6 continues development of the circular volume geometry by considering how the irregularly-shaped voxels are mapped onto the square pixels of a computer screen. A simple mapping process is implemented for the purpose of determining to what extent image artefacts influence the final image. For this purpose, two distinct phantoms were reconstructed using a FBP method.
2
B A C K G R O U N DThis chapter introduces the core concepts and technologies relevant to this thesis. Section 2.1 introduces the concept of computed tomography, highlighting the differences between standard CT, dual-energy CT, and spectral CT; section2.2provides the background and motivation behind the MARS project; section2.3gives an overview of the two most common image reconstruction methods, FBP and ART; and the chapter concludes with section2.4which offers an introduction to some of the most common high-performance computing technologies.
2.1 C O M P U T E D T O M O G R A P H Y I M A G I N G
Computed tomography (CT) is an imaging modality common in both medical and industrial practices, and uses x-rays to generate images with high spatial resolution while employing fast scan times. Because x-rays are known to cause skin damage, malignancies, and other side effects, radiologists must find the balance between delivering large radiation doses to patients and ob-taining good quality diagnostic images. The image reconstruction process is also computationally expensive and time consuming. Figure 1 demonstrates the differences between competing CT technologies: standard single-energy CT; dual-energy CT; and spectral CT.
Figure 1: Differences between standard CT, dual-energy CT, and spectral CT. The photon counting capabil-ity of the Medipix detector is what differentiates the MARS scanner from competing dual-energy scanners [2].
the detector is proportional to the total energy deposited by all photons across the x-ray spec-trum, any information about individual photons is completely lost. The subsequent image recon-struction process involves performing an iterative series of forward and filtered back-projection operations using these signals [6]. The grey levels in a CT image correspond to the level of x-ray attenuation, and standard CT scanners can not be reliably used to distinguish materials that have very similar attenuation properties.
Dual-energy CT scanners provide improved material separation by measuring the averaged flux over two separate x-ray spectra. This can be achieved in several ways, for example: using a single x-ray source that alternates between tube voltage; using alternating source filtrations; or using dual-source synchronous acquisition. The pair of attenuation measurements allow for the differentiation of two materials by exploiting the fact that the energy-dependent attenuation curves are different for distinct materials [2].
Spectral CT is the technique employed by the MARS scanner. It only requires a single spectrum and makes use of the polychromatic nature of the x-ray source. By using an energy discriminating detector it can measure the specific energy of every detected x-ray photon, allowing the scanner to group the entire x-ray spectrum into multiple energy ranges. By analysing the distribution of detected x-ray energies, it is possible to quantify the individual materials within the scanned
object, such as muscle, bone, fat, and contrast agents. The spatial resolution of standard CT is typically of the order of half a millimetre, but the MARS scanner can produce images with spatial resolution of the order of tens of microns, and is subsequently used for the evaluation of the micro-structure of specimens [2].
2.2 M A R S
The Medipix All Resolution System (MARS) is a multi-energy CT scanner (Fig. 2) that employs the Medipix energy-discriminating detector. Developed at the European Organisation for Nuclear Research (CERN), these detectors are capable of acquiring a set of selected energy bins in parallel by processing each photon individually. The latest MARS scanners use the Medipix3RX detector.
Each energy bin is the summation of the individual photon counts that fall within a specific en-ergy range [2]. These features are what makes the MARS scanner capable of generating spectral CT imagery, essentially allowing images to be created which can distinguish between clinically important materials that have similar attenuation properties, a feat not possible on modern CT scanners [7]. Spectroscopic photon-counting detectors can also increase the signal-to-noise ra-tio (SNR), thus allowing for a reducra-tion in radiara-tion dose to the patient. Current size limitara-tions mean the scanner is only capable of accommodating small animals and excised samples of human tissue, but small animal CT imaging is used extensively for preclinical studies [8]. A human-sized scanner is planned for development within the next two years.
The MARS team is composed of members from many disciplines, including biologists, clinical radiologists, mathematicians, software engineers, electrical engineers, and physicists. The project is a collaboration between the universities of Canterbury and Otago.
The Medipix range of detectors have undergone several iterations following their initial intro-duction in 1999. From Medipix1 to Medipix3, the detectors have evolved from having an array of 64⇥64 pixels to an array of 256⇥256 pixels. The pixel areas have shrunk from 170⇥170µm2
down to 55⇥55µm2, and the number of energy thresholds has increased from one up to eight
Figure 2: Photograph of a MARS scanner.
There are a range of Medipix detectors, with the main discriminating factor often being the material that makes up the semiconductor sensor layer. A number of materials are used for this purpose, including Si, GaAs, CdTe, and CdZnTe [3]. The sensor layer is bump bonded to a Com-plementary Metal Oxide Semiconductor (CMOS) Application Specific Integrated Circuit (ASIC) readout layer. X-rays passing into the sensor layer produce an electron-hole cloud, which in turn causes a voltage pulse. The CMOS readout layer is able to analyse the pulse and calculate the energy of the x-ray that produced it [3].
MARS cameras are made up of vertically aligned Medipix3RX 14 mm ⇥14 mm detectors. In the current scanners, the source-to-detector distance (SDD) ranges from 100 to 250 mm. Future human-sized scanners will consist of about 100 detectors arranged in an arc.
2.3 I M A G E R E C O N S T R U C T I O N T E C H N I Q U E S
2.3.1 Background Physics
When an x-ray beam passes through an object, its intensity decreases due to the interactions de-scribed in section3.2. This process of attenuation is described by the Beer-Lambert Law, which
states that a logarithmic relationship exists involving: the intensity of an x-ray,I, passing through the object; the product of the distance,s, travelled by the x-ray; the x-ray energy,E; and the posi-tion and energy dependent linear attenuaposi-tion coefficient of the substance,µ(E,s). The monochro-matic form of the Beer-Lambert Law is typically used in its integral form
I(E) = I0(E)e R
µ(E,s)ds (2.3.1)
where I0 is the initial x-ray intensity and the linear attenuation coefficient is integrated over the
entire path of the x-ray. To take full advantage of the Medipix chip in the MARS scanner, it is essential to consider the polychromatic form of the Beer-Lambert Law. Extending the monochro-matic form by integrating over all energies of the polychromonochro-matic spectra found in the x-ray beam we obtain
Z
I(E)dE= Z
I0(E)e R
µ(E,s)dsdE (2.3.2)
Within the object being scanned, different materials will attenuate the x-ray beam by different amounts. The linear attenuation coefficient characterises how likely an x-ray will be able to pene-trate a substance, with a higher value representing a higher probability of attenuation within the substance and is a combination of all possible x-ray interactions. The overall coefficient for a com-posite object made up ofmmaterials is the sum of all individual linear attenuation coefficients within the object,
µ(E) =
Â
m µm
(E) (2.3.3)
The linear attenuation coefficient of a substance (µ), with units of cm 1, is directly proportional
to the density so it is often convenient to instead refer to the mass attenuation coefficient (µ/r),
with units of cm2g 1. The energy dependence of the mass attenuation for some common materials
is shown in Fig.3.
The sharp discontinuities observed in Fig. 3 are known as K-edges and occur at the binding energy of the K-shell electrons. Once an incoming photon has energy greater than the binding energy, there is a significant increase in the probability of photoelectric absorption and thus the attenuation coefficient undergoes a sudden five-fold increase as well. Every element has unique K-shell binding energies, many of which occur in the energy range of diagnostic x-rays. Exploiting these elemental “fingerprints” for diagnostic purposes is sometimes known as K-edge imaging.
Photon Energy (keV)
20 30 40 50 60 70 80 90 100 110 120
Mass attenuation coefficient (cm
2 g -1 )
10-1 100 101 102
[image:23.595.133.477.67.338.2]Water Lipid Gold Calcium Gadolinium Iodine
Figure 3: The MARS scanner collects photons in the range of 20 - 120 keV, and the mass attenuation pro-files of some of the most commonly searched for materials are displayed. The human body is largely composed of lipid (fat), water and bone, which unfortunately have very similar attenua-tion profiles due to their K-edges sitting below the diagnostic imaging range [3].
value of -1000 and water has a value of zero. Hounsfield units for other materials are calculated with the equation
HU = µ µwater
µwater µair ⇥1000 (2.3.4)
Due to the energy dependence of linear attenuation, the associated Hounsfield unit for a material at different energies will also be different. To solve this problem for the purposes of spectral CT, the spectral Hounsfield unit was created [10].
Introduced in 1917 by Johann Radon and widely used in tomography, the Radon transform provides a mathematical model for the measured attenuation collected by the detector element. Taking Equation2.3.1 and removing the energy dependence for simplicity, we can compute the integral of the attenuations as
Z
µ(s)ds⇡
Â
µids=logI0I (2.3.5)where the CT reconstruction procedure will attempt to derive the distribution of µ from the
measuredI0/I.
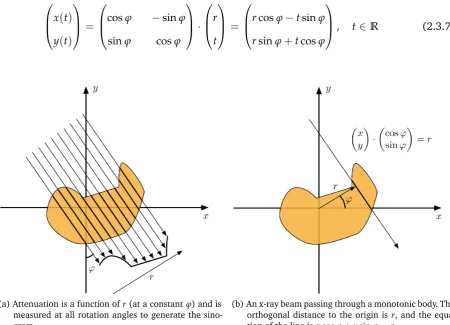
A slice through the object being scanned can be treated mathematically as a distribution of attenuation coefficients in two dimensions,µ(x,y), and this function will be referred to as f(x,y) for the remainder of this section. The x-ray beam is attenuated by every element of f(x,y)along the line (Fig.4b), so we formulate the equation
0 B @x y 1 C A· 0 B @cosj
sinj
1 C
A= xcosj+ysinj=r (2.3.6)
Since there are many projection angles to consider, we derive the following parametrisation:
0 B @x(t)
y(t)
1 C
A=
0 B
@cosj sinj
sinj cosj
1 C A· 0 B @r t 1 C A = 0 B
@rcosj tsinj
rsinj+tcosj
1 C
A, t2R (2.3.7)
(a) Attenuation is a function ofr(at a constantj) and is
measured at all rotation angles to generate the sino-gram.
[image:24.595.57.508.244.569.2](b) An x-ray beam passing through a monotonic body. The orthogonal distance to the origin isr, and the equa-tion of the line isxcosj+ysinj=r.
Figure 4: Coordinate system of the Radon transform.
where 0 B @r t 1 C
A is a line parallel to they-axis, and the line is rotated through jdegrees using a
ro-tation matrix. From Equations2.3.5and2.3.7the attenuation measured by the detector element is given by the line integral
Z
f(x,y)ds= Z •
Finally, Equation 2.3.8 is referred to as the Radon transform, described by the formulation
f(x,y)7! Rf(j,r), where the left-hand side is defined in the planeR2and the right-hand side is
defined on[0, 2p]⇥R[11].
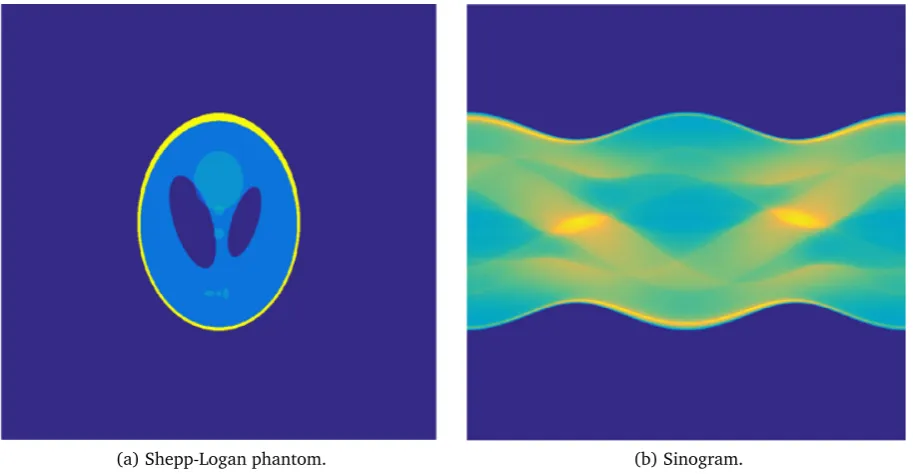
Radon transform data is referred to as a sinogram, where the transform of small objects ap-pear as blurred sine wave patterns with varying phases and amplitudes (Fig.5). In terms of CT, the sinogram represents the radiographic projection data collected at all projection angles in a projection plane [3].
[image:25.595.83.540.223.460.2](a) Shepp-Logan phantom. (b) Sinogram.
Figure 5: A Radon transform applied to a Shepp-Logan phantom generates a projection image known as a sinogram. Each column in the sinogram is made up all parallel projections for a given projection angle.
2.3.2 Filtered Back-projection
Filtered back-projection (FBP) algorithms employ inverse Fourier transforms and are commonly used in the reconstruction process of clinical scanners. However, these processes are based on an-alytical algorithms and don’t perform well when the collected projection data is particularly noisy or under-sampled [12]. Back-projection is a relatively simple concept to understand. With a finite number of projections of an object contained in the sinogram, each projection can be smeared or back-projected along the lines they were measured from, resulting in an approximation of the original object. With no corrections applied, this simple method leaves significant blurring
in the reconstructed image. Filtered back-projection partially corrects this blurring by applying a high-pass filter to the projection. Commonly used filters are the ramp, Shepp-Logan, and Hann filters. The filter, g, is convolved with the raw projection data, p(r,j). The formulation for this
procedure is given by
pg(r,j) =g⌦p(r,j) =
Z •
•p(`,j)g(r `)d` (2.3.9)
The imageµ(x,y)can be calculated from the filtered projection data,pg(r,j)using
µ(x,y) =FR21 FR1[pg(r,j)] (2.3.10)
where the first step is to apply a Fourier transform to calculate the two-dimensional frequency spectrum of the image, and the second step is to apply an inverse Fourier transform of the image spectrum to obtain the reconstructed image.
2.3.3 Algebraic Reconstruction Technique
Algebraic reconstruction technique (ART) is a general term used to describe how to iteratively solve a large system of linear equations for the purposes of image reconstruction. Compared to FBP, iterative techniques generate higher-quality images, but are computationally more expen-sive. With recent advances in computing technologies such as GPUs, the implementation of ART for CT image reconstruction is becoming more commercially viable.
Treating the density distribution from the Radon transform as a system of linear equations, Sir Godfrey Hounsfield used an iterative reconstruction method in the world’s first CT scanner [11] in 1972. An ART-based algorithm is employed by the MARS scanner.
Let the matrix R represent the Radon transform Rf seen in Equation2.3.8. Every element in R stores the projection data for a givenr and jand we define R(k,`) = Rf (k·Dj,`·Dr). For
example, R(1, 1) = Rf(0, 0), R(1, 2) = Rf(0,Dr), R(2, 3) = Rf(Dj, 2Dr), etc. The system of
linear equations to be solved is formulated with the expressionAx=b, but to remain consistent with the subject matter, we will instead useSx=R, where the matrixSis called thesystem matrix and describes the image formation process being conducted on the vector of volume elements,x. As described above, the measured data (Radon transform) from all projection angles is stored in
Withmangle steps andnparallel beams in the image reconstruction, we therefore havem⇥n
linear equations in the unknowns xi, where i 2 1, . . .n2 implies that all rays are organised in a
column vector. Combining all of our knowledge ofSx = R, the following general form must be solved by the reconstruction:
0 B B B B B B B B @
1 0 0 . . . 1 0 0 . . .
0 1 0 . . . 0 1 0 . . .
0 0 1 . . . 0 0 1 . . .
. . . . 1 C C C C C C C C A
| {z }
S · 0 B B B B B B B B B B B B @ x1 x2 x3 . . .
xn2
1 C C C C C C C C C C C C A = 0 B B B B B B B B B B B B B B B B B B B @
R(1, 1)
R(1, 2)
. . .
R(1,n)
R(2, 1)
. . .
R(m,n)
1 C C C C C C C C C C C C C C C C C C C A (2.3.11)
The matrix S has dimensions of (m⇥n)⇥(n⇥n). To account for photon path length through each individual voxel, weighting factors can also be applied toSto increase the accuracy at each projection angle. The general iterative method computes an approximation of the solution of the linear equations with the formula
xk+1= xk+l kRi
⌦
si,xk↵
||si||2 si (2.3.12)
wherelkis a relaxation parameter,siis thei-th row ofS, andRiis thei-th component ofR. Every
voxel within xis iteratively updated until the reconstruction converges at a solution.
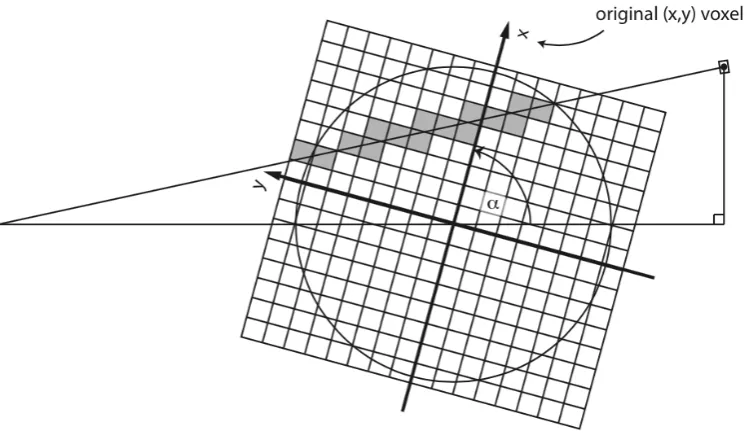
The traditional reconstruction model is composed of a cuboid that surrounds the scanned ob-ject, and is made up of thousands of smaller cubes or volume elements known as voxels. The termvoxelis a combination of the wordsvolumeandpixel. Voxels are commonly used in the visu-alisation of medical data and for rendering three-dimensional computer games. One of the most time consuming parts of any iterative CT reconstruction algorithm is the calculation of photon path lengths through the millions of individual cuboid voxels within the object (Fig.6).
The development of a new ART-based polychromatic reconstruction algorithm which takes full advantage of the multiple energy counters of the Medipix chip is being researched by members of the MARS group [3]. The cylindrical volume geometry investigated in this thesis is one part of the new reconstruction algorithm, with the intention of reducing the number of photon path length calculations needed during the iterative process. This in turn will reduce the time needed
Figure 6: As the volume rotates about the z-axis, individual ray lines will pass through different combina-tions of voxels (MARS Bioimaging, 2014).
to compute the coefficient matrix, and will result inS becoming more sparse. Taking advantage of increased matrix sparsity is a major focus in developing the new algorithm.
2.4 H I G H-P E R F O R M A N C E C O M P U T I N G
The term high-performance computing (HPC) refers to how complex tasks can be accomplished efficiently by employing multiple processors or groups of computers [13]. HPC is often treated as a collective term that encompasses hardware and software systems, programming platforms, and parallel programming paradigms. Heterogeneous architectures, where the CPU and GPU work closely together, are leading the way in pushing new ideas and areas of research into parallel programming.
Many of the computational problems solvable by parallel computing operate on the principle that a large problem can be broken down into many smaller problems, each of which can be solved concurrently. In order to determine how a large problem can be mapped in this way, the programmer must consider the available computer architecture (hardware aspect) and the parallel programming model (software aspect).
in-tegrates multiple cores onto a single processor, known as a multi-core processor. A parallelised computation essentially maps the segments of the large problem to the multiple cores which process parts of the solution concurrently. OpenMP (Open Multi-Processing) is a commonly used API (application programming interface) that allows a programmer to harness the multiple cores that reside in modern CPUs. It supports multi-platform shared memory multiprocessing mem-ory programming in C, C++, and Fortran, and is compatible with most operating systems [14]. OpenMP consists of compiler directives, libraries and environment variables that can be easily in-corporated into a subroutine to let it take advantage of multiple cores [15]. On a computer with
N processor cores, the compiler will attempt to split a program containing OpenMP directives intoNparts.
A program that can be divided up into a discrete series of calculations is called a sequential program. Aprecedence restraint(or adata dependency) describes the situation whereby the input of one calculation depends upon the output of a previous calculation. The sections of a program can be grouped in one of two ways: (1) some sections must be calculated after other sections due to a precedence restraint; and (2) some sections can be calculated at the same time as other sections because there is no precedence restraint. A program that contains sections of code that are computed at the same time as other sections is called aparallel program. Generally, a parallel program is made up of a series of sequential operations that are computed concurrently, but a program that contains many data dependencies is likely to restrict the use of parallelism.
The two fundamental types of parallelism aretask parallelism anddata parallelism [13]. Task parallelism refers to the situation wherefunctionsare distributed across multiple cores, and arises when multiple tasks need to be performed but can operate independently. Data parallelism refers to the situation where operations can be performed on multiple data items simultaneously, mean-ing that the data is distributed across multiple cores. This type of parallelism is what GPU are most suited for. GPUs were originally developed to assist with making computer games seem more realistic by allowing complex scenes to be quickly rendered on the computer screen. These types of calculations are generally known as SIMD (single instruction, multiple data), meaning that each pixel undergoes the same operation as all the others, but occurs using different data. Modern GPUs consist of a number of multi-processors and can process over a thousand instruc-tions at once, making them ideal for SIMD algorithms. A similar concept is known as SPMD (single program, multiple data), whereby the same program is executed on multiple parts of the data [16]. This implies that each parallel unit may be executing different instructions, with some instructions being faster than others.
Each multiprocessor within a GPU contains a number of processor cores that are linked with very high bandwidth memory. While modern CPUs can manage thousands of threads, they can only run 4–12 at any given time, depending on the number of computational cores contained within the CPU [6]. The performance gain achievable on a GPU depends upon how easy it is to adapt a serial algorithm to run in a parallelised form. Thankfully, frameworks and tools are being developed and refined that allow such changes to be made in an efficient way. A popular framework is called the compute unified device architecture (CUDA). Developed by NVIDIA for use with their range of GPUs, it supports joint CPU/GPU application execution [17]. The term
compute capability was coined by NVIDIA to describe the characteristics of its GPUs, and are composed of a major and a minor version number separated by a decimal point. The major version number refers to the class architecture and the minor version refers to minor differences within that class.
An alternative to CUDA is the open computing language (OpenCL). This language works on NVIDIA and non-NVIDIA GPUs alike, and is a good option if the software application is likely to be run on a wide range of different machines. Additional hardware possibilities also exist, for example Intel Xeon Phi coprocessors which are based on the Intel Many Integrated Core (MIC) architecture and offers up to 1.2 teraflops per coprocessor [18].
With future MARS scanners being scaled up to human size over the next two years, the amount of data needing to be rapidly processed will increase dramatically. For example, the current scan-ners can only accommodate small objects like mice. The size difference between a 20 g mouse and an 80 kg human is approximately4⇥103, and therefore the computational complexity can
be expected to increase by a similar magnitude. The need for more efficient image reconstruction algorithms is a necessity, with commonly adapted medical imaging algorithms to the GPU includ-ing image registration, image segmentation, and image de-noisinclud-ing. Real-time image de-noisinclud-ing can be achieved with GPU-based algorithms [6]. The scalability of parallelised algorithms run-ning across multiple GPUs is the most cost efficient solution to such a problem, and finding the best way to implement these algorithms is an objective of this research project.
3
M A R S M DThis chapter presents improvements made during this thesis to the material decomposition soft-ware, MARS MD, used by the MARS research team. By applying changes to data structures and algorithm implementation, and by using a parallelised structure, the speed of the program was improved by several orders of magnitude. Section3.1introduces some of the history and impor-tance of the MARS MD software; section3.2describes the photon interactions in matter that are relevant to medical imaging; sections3.3and3.4give brief overviews of the material decompo-sition process and algorithm used in MARS MD; section3.5explains the core algorithm of MARS MD and the subsequent speed improvements; sections3.6and3.7describe the new user interface and additional features added to the MARS MD software; section3.8demonstrates some impor-tant research performed using the software; section3.9briefly discusses future developments to the software; and the chapter concludes with a summary in section3.10.
3.1 I N T R O D U C T I O N
MARS MD is a post-reconstruction material decomposition program that is used to calculate the proportions of various materials in objects that have been scanned by a MARS system. Materials such as bone, tissue, gold, iodine, and contrast pharmaceuticals are routinely investigated in ongoing studies.
open-source project with a vibrant and dedicated community of developers and users alike. For many people, the primary reason for choosing to develop in Octave is the fact that it is completely free to use, unlike the moderately expensive MATLAB software package with its wide range of toolboxes. Both MATLAB and Octave are high-level interactive languages designed for performing numerical computations. Octave was created with MATLAB compatibility in mind and is able to natively run MATLAB m-functions [19]. The reverse is not true, however, since Octave adds additional syntax and functionality that MATLAB doesn’t understand. Octave is primarily a command line tool and doesn’t have a dedicated GUI, although some third party tools do exist. MATLAB is often the tool provided to students because of its easy to use GUI which makes the programming experience more interactive and improves the debugging experience considerably. MATLAB also comes with a powerful just-in-time (JIT) compiler which allows code to be compiled during execution of the program. This means that slow portions of code such as loops can be greatly improved by a process called vectorisation. Octave also supports a JIT compiler, but it is far less efficient than the one in MATLAB.
MARS MD is an important part of the MARS project because it enables specific materials to be identified and quantitatively measured from MARS scan data. Many of the astonishing images published in journals and student theses were created using the software, and some examples are presented in section3.8. The work presented in this chapter describes improvements made to the MARS MD program.
The design goal for improving MARS MD was to make it simple for anyone to install and use, which would in turn allow pre-clinical research with the MARS scanner to be performed much faster. Compared to Octave, MATLAB is a more familiar programming environment for students, which was the primary reason to move the code base back to MATLAB. The entire MATLAB soft-ware package is provided to every student at the universities of Canterbury and Otago, where most MARS students are enrolled, thereby eliminating the cost benefit of using Octave. The sec-ondary focus of rewriting MARS MD with MATLAB was to identify and fix inefficient portions of the code to improve computational time. The powerful toolboxes provided by MATLAB, particu-larly the Parallel Computing Toolbox, assisted with this task.
3.2 X-R AY I N T E R A C T I O N S I N M E D I C A L I M A G I N G
The attenuation of an x-ray beam passing through an object can be caused by a number of fundamental interactions, three of which are relevant to diagnostic imaging and will be briefly described.
• Photoelectric absorption, due to the photoelectric effect, occurs when an incident photon interacts with an atom and leaves it in an excited state. An electron that was bound to the nucleus, known as a photoelectron, is ejected from the atom and leaves with kinetic energy equal to the energy lost by the photon. This effect relies on the condition that the x-ray energy is greater than the binding energy of the electron. The vacancy left by the missing photoelectron is filled by an electron in a higher shell, with the resulting energy difference either being lost by an ejection of a characteristic x-ray (fluorescent x-ray) or by another electron from a higher shell (Auger electron).
• Rayleigh scattering is caused by the oscillating electromagnetic field of a photon, which excites nearby electron to oscillate as well. This energy is released as scattered radiation, but it only contributes a very small amount to the overall attenuation of an x-ray beam within an object.
• Compton scattering treats both the x-ray and electron as particles which essentially collide like two billiard balls. Often the electron is treated as “free” but in reality it is likely located in an outer orbital of an atom. Both the photon and electron recoil in different directions with new energies. If the energy transferred is greater than the binding energy of the elec-tron, the electron will be ejected from the atom.
3.3 M AT E R I A L D E C O M P O S I T I O N
scattering. This differs from methods used today whereby signals are decomposed directly into materials. The attenuation coefficient used by Alvarez and Macovski was given by
µ(E) =Cphoto⇥ 1
E3 +Ccompt⇥ fKN(E) (3.3.1)
whereCphotoandCcompt are coefficients related to the cross-sections of the two interactions, and
fKN(E)is known as the Klein-Nishina function which gives the differential cross-section of
pho-tons scattered from a single free electron. Equation3.3.1breaks down because the formulation of the photoelectric cross-section involves bothZand x-ray energy, and the power ofZdepends on the photon energy. Alverez and Macovski instead treated the power ofZas a constant. It was also believed at the time that because there were only two significant x-ray interactions occurring in matter, it meant that only two materials without a K-edge could be identified, a statement shown to be false by Bornefalk who instead showed that the intrinsic dimensionality of the attenuation coefficient for low-Z materials is at least four in the diagnostic imaging region [21].
A photon that is counted by a multi-energy detector, such as the Medipix chip, will likely have passed through a number of different materials within the object being scanned. Building on the ideas from section3.2, every material along the signal’s path is modelled as a product of a basis function, fj(E), and a basis coefficient,aj. At a specific energy, the overall attenuation coefficient
of the signal,µ(E), is then composed of a linear combination of these material constituents,
µ(E) =a1f1(E) +a2f2(E) +...+aNfN(E) (3.3.2)
The set of all basis functions is known before the decomposition begins. The goal of material decomposition is to find the set of basis coefficients that best solves the linear system. The MD algorithm can be generalised to be performed on both projection images and reconstructed im-ages.
During a typical material decomposition procedure, there three types of mis-identification that can occur [3]. The first type is caused by large material basis sets because attenuation curves for different materials are often very similar, and trying to decompose materials in this situation leads to numerical instability. This problem was shown to be solveable by the work completed by Le and Molloi (2011) and Alessioet al.(2013) who developed algorithms that take advantage of sparse solutions to perform material identification and quantification as separate operations [22,23]. The second type occurs when materials are deliberately omitted from the decomposition in an
attempt to reduce the number of unknowns, but instead this causes non-represented materials to appear as combinations of different materials. Liuet al.(2009) showed how an extra material can be decomposed with a dual-energy scanner by including mass fraction conservation constraints [24], and Wanget al.(2011) isolated materials with vastly different non-overlapping attenuation ranges by using segmentation techniques [25]. The third type results from using poor quality data containing image artefacts.
3.4 M D A L G O R I T H M
This section briefly outlines the MD algorithm used in the MARS MD software.
Reconstructed images are used to formulate effective mass attenuation coefficients for the chosen materials. Before decomposition begins, the data in each energy range was de-noised by taking the average of five adjacent images followed by a cylindrical median filter with a circle radius of one voxel. Next, the statistical segmentation function identifies low concentration high-Z materials as soft tissue if the signal is less than the level of noise present. These low concentrations are identified by modifying Euclidean norm thresholding with the Mahalanobis distance. Finally, the decomposition process employs the combinatorial material decomposition (CMD) algorithm developed by Christopher Bateman (University of Otago) for his PhD thesis, which uses 0-norm minimisation to achieve sparse solutions. The advantage of this algorithm is that it can deal with a problem set involving more materials than there are energies. It does this by calculating non-negative linear least squares solutions for a series of sub-problems, where fewer materials are considered at a time. The solution with the smallest least squares error out of all combinations is selected as the best solution. Therefore, unlikely or impossible solutions are rejected at an early stage [3].
3.5 S O F T WA R E I M P R O V E M E N T S
involves fewer unknowns to solve for at each iteration [3]. Taking a scan with a multi-energy detector allows for more than two energy ranges to be investigated, which in turn allows for more K-edges to be measured simultaneously.
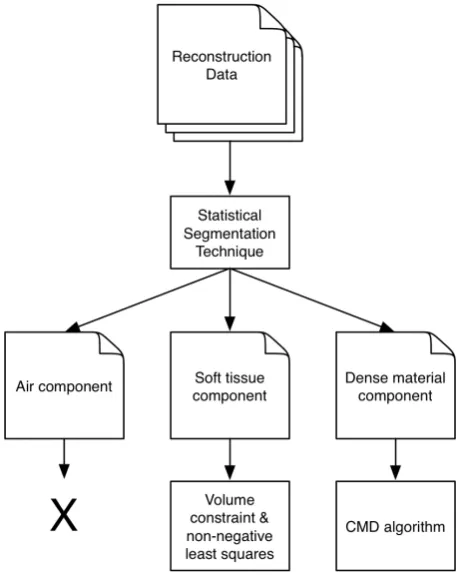
Figure 7: The core functionality of MARS MD. Air components are set to zero and ignored, soft tissue components are decomposed into lipid and water, and high-Z materials are decomposed with the CMD algorithm.
MARS MD is composed of three primary functions: median filter, segmentation, and material decomposition. Let there bemmaterials to be decomposed in the object,b energy bins, and let every image be made up ofn2 pixels. The MARS MD program has the following basic structure,
with the main branches being displayed in Fig.7:
1. Load covariance matrix (b⇥btotal pixels).
2. Load energy data (reconstructed image) for a single slice for all energy bins and store as a multi-dimensional array (b⇥n2 total pixels).
3. Remove some of the noise from each data set with a median filter. This step is optional.
4. Create air, soft tissue, and high Z segmentation maps using the covariance matrix with the energy data sets (3⇥n2total pixels).
5. Perform a material decomposition using the segmentation maps and energy data sets, and store as a multi-dimensional array (m⇥n2 total pixels).
6. Write every individual material image to disk.
Using the MATLAB profiler (which measures execution time for individual functions within the code) to analyse the program it was clear that the processes in steps 3-5 were bottlenecks in the program, with each step corresponding to approximately one third of the running time. The MD algorithm has a high degree of parallelism because the processing of each pixel does not depend on the value of its neighbours. Pixels from one energy bin set only depended on pixels from the remaining energy bins that are situated in the exact same row and column.
Before any changes could be made to the MARS MD software within the MATLAB environment, the code base first had to be converted from Octave to the MATLAB programming language. Due to the inherent compatibility between the two platforms, this was a particularly simple task. For example, the most mundane yet sweeping alteration was changing all Octave friendly double quotes into the single quotes that MATLAB requires.
One of the best ways to speed up MATLAB code that consists of nested loops is called vec-torisation. This process eliminates loops by replacing them with a single line of code that will perform the same operations. MATLAB is able to interpret what the code is trying to achieve and then execute it with its own highly-optimised array routines often at a far greater speed than the equivalent set of nested loops. Depending on how the loops work and what sort of calculations are being performed, vectorisation is often not possible or simply too difficult to achieve. Some-times vectorisation of code will offer no speed benefits at all, due to the fact that the MATLAB JIT compiler can highly optimise loops making a negligible difference at run-time.
Before attempting to optimise array operations in MARS MD, the first step was to remove its heavy reliance on the struct data type. Each energy array was being loaded and stored as a separate field within a struct and being passed through the entire chain from one struct to the next. The struct data type has certain advantages, for example the ability to store more than one type of data within it, and also the ability to give each section of data a unique name that can be used to easily access it. This added functionality comes with extra overhead, and with there being no clear usage of these features in MARS MD, it was decided to instead store all data in a multi-dimensional array.
con-secutive elements in a column are stored in concon-secutive memory locations. The system will cache values along with their linear neighbours, so to enhance performance it makes sense to operate on a array column-by-column instead of row-by-row. In the case of a nestedfor-loop that oper-ates over a square array, this means making the outer loop iterate over the columns and the inner loop iterate over the rows. Like many of the changes made to MARS MD, this one again offered small but noticeable speed improvements. The biggest improvement came as a follow-up to this one, where the Parallel Computing Toolbox was utilised and the outerfor-loop was changed into aparfor-loop.
The concept of aparfor-loop is the same as for a for-loop, whereby the main program, also known as the client, will perform the statements contained within the loop. In the case of a
parfor, the client will coordinate the execution of these loops with a series of workers contained
within a parallel pool. By distributing sections of the data, referred to as slices, to the workers, the overall calculation can be performed in parallel and potentially run significantly faster than the standard loop. Once the workers have finished with their slice, the results are sent back and reassembled by the client. Every execution of aparfor-loop is called an iteration, with workers receiving their allocation of slices in no particular order. This is an important characteristic of the functioning of a parfor-loop, because in order for a speed improvement to occur each worker needs to be able to operate on its data completely separately from every other worker. Commu-nication between workers, while certainly possible, is a large source of overhead and should be avoided whenever possible. MATLAB is very strict when it comes to what can and can’t be per-formed within aparfor-loop, and often a great deal of work has to be put in to redesigning an algorithm to accommodate the strict rules. There are many reasons for why this type of loop may not be possible or desirable, such as if one iteration of the loop depends upon results from a previous operation, or if the communication cost between workers outweighs any performance benefit from running concurrently. It is not possible to use fields from a struct as sliced variables within aparfor-loop [26], which represents another reason to remove the program’s reliance on this data type. There are workarounds for this behaviour, but they will again add unnecessary overhead to the function.
Some of the relevant variable types that may exist within a parfor-loop and are briefly de-scribed below.
• The loop variable is assigned by the initialparforstatement and defines the index value for each iteration of the loop. Loop variables must be a group of ascending consecutive integers and are used to coordinate the slices that are sent to workers.
• Sliced variables are those that are broken up and sent to workers. They can be either input or output data, or both. The client sends sliced input data to the workers and the workers send sliced output data back to the client.
• Broadcast variables are used within the loop but aren’t affected by an assignment statement within the loop. These variables are usually transmitted to every worker individually, so a large broadcast variable will incur significant communication overhead between client and worker.
A parallel pool can exist as either a cluster of workers distributed over several machines on a network, or simply as a local pool operating on a desktop computer. Only the local parallel pool option was employed with MARS MD. In general, the maximum possible size of a local parallel pool equals the number of cores within the CPU of the computer. Some CPUs are capable of a technology known as hyper-threading, which essentially allows a single core to operate two processes at once. While hyper-threading may present more workers than there are available cores in the CPU, this generally won’t translate into faster performance of aparfor-loop because hyper-threading doesn’t offer any advantage when it comes to numerically intensive operations. MATLAB will ignore hyper-threading by default.
Each of the three bottlenecks in the code consisted of nestedfor-loops and are described below.
Median Filter
The original median filter function was made up of four nested for-loops, which is always an indication that speed improvements are possible. For every pixel in an energy array, an approxi-mately circular shape is calculated around the pixel and the final value stored within the pixel is the median of those pixels surrounding it that lie within the circle. The two outer loops iterated over the rows and columns of pixels, but the two inner loops performed a similar iteration and were used to choose the pixels within each circle. While a simple idea, the set of four nested
for-loops caused a major slowdown in the median filter operation. An alternative solution that
to act as a mask for the circular region of interest. The two inner loops are then replaced with vectorised code that tells MATLAB which square of values to pull out of the energy array. This new small array is then masked and the only values to emerge are those lying within the circular region. The median of these values is then taken as normal.
While this modification made a noticeable speed improvement, an even bigger improvement came simply by changing the outer-mostfor-loop into aparfor-loop. The function was already it-erating in column-major order so copying data elements to the workers was already optimised in this regard. The only problem with this solution was the presence of a broadcast variable within the loop. Because each worker is required to read array elements from neighbouring columns within the array, this would have subjected the function to an additional communication over-head that will have caused the performance to suffer.
Segmentation
Within the segmentation function the Mahalanobis distance is computed several times, for example between each voxel to the lipid and water basis vectors. The Mahalanobis distance provides a measure for how many standard deviations away a measurement is from the mean of a multivariate normal distribution. In terms of the original MARS MD code, and ignoring the complex details, this involves multiplying the difference of basic vector points by the inverted covariance matrix. There are two problems with this method: the inverse of a matrix is primarily a theoretical value, and subsequently not an ideal choice when accuracy is required; and the matrix inversion process is slow. Because multiplying by the inverse of a matrix is performed as an alternate way of dividing by the original matrix, MATLAB provides an alternative syntax that is both faster and more accurate. Instead of multiplying by the inverse of a matrix, simply divide by the original matrix using the matrix right division (/) or matrix left division (\) operations. This improvement to the MARS MD code was incredibly minor and only offered a fractional improvement to the program’s speed, but it is a good example of how important it is to take advantage of any optimised tools that are available.
In regards to the part of the function that performed the image segmentation, the only major change was again optimising the two nested for-loops into column-major order and changing the outer-loop into aparfor-loop. Similar to the median filter function, this loop was also forced to deal with a broadcast variable, but it generally only stored a small number of values, meaning
that the overhead would not have had a noticeable effect on performance.
Material Decomposition
This portion of the overall algorithm represents the culmination of the previous functions and generates a multi-dimensional array made up of one square array for every material being searched for in the object. It treats every pixel separately and allocates a value to it depending on whether it decides a material resides in that pixel. The sameparforconversion was applied here, and to avoid the use of large broadcast variables within the innerfor-loop, temporary ar-rays were created at each iteration. Once an iteration was complete, the values stored in the temporary variables were transferred into the main output variables. After the MD process was completed, each section of the multi-dimensional array was written to disk as a TIFF image.
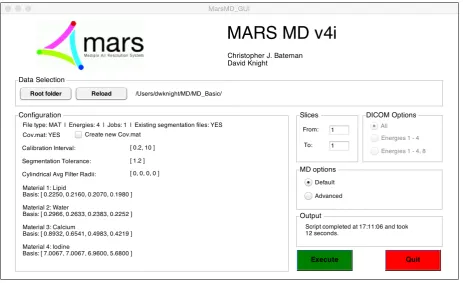
3.6 G R A P H I C A L U S E R I N T E R F A C E
For new members to the MARS research group and especially for those who were non-experts in the field of MD, the cumbersome command line instructions for running the program were particularly confusing and non-intuitive. A well designed graphical user interface enables a user to be more productive, which in turn benefits the entire team. Tools within MATLAB allowed the creation of a new user interface for MARS MD (Fig.8).
![Figure 1: Differences between standard CT, dual-energy CT, and spectral CT. The photon counting capabil-ity of the Medipix detector is what differentiates the MARS scanner from competing dual-energyscanners [2].](https://thumb-us.123doks.com/thumbv2/123dok_us/9049784.401231/19.595.150.473.65.327/differences-standard-spectral-medipix-detector-differentiates-competing-energyscanners.webp)