Development and testing of two methods for the measurement
of the mowing machine feed rate
F. Kumhála, M. Kroulík, J. Mašek, V. Prošek
Czech University of Agriculture in Prague, Czech Republic
ABSTRACT
Two methods were developed and tested for the measurement of the mowing machine material feed rate (based on the conditioner power input measured by a torque-meter, and/or on the material change in momentum measured by a curved impact plate). The measurements carried out in the year 2001 proved that a very good linear relationship existed between the conditioner power input, output frequency of the apparatus measuring the impact force by means of the impact plate, and the material feed rate through the mowing machine. The calculated R-Squared values were about 0.95. In the year 2002, the impacts of material and condition (parameters) changes on the mowing machine material feed rate measure-ment accuracy were measured under laboratory conditions. It was evident from the statistical evaluation that changing crop variety, crop maturity, and intensity of conditioning can have a statistically significant influence on the measurement based on the torque-meter. As concerns the impact plate measurement, it was found that it is not possible on the basis of our measurements to determine statistically the influence of the factors tested.
Keywords: mowing machines; feed rate measurement; conditioner; impact plate
The sensor of the forage crop feed rate can be useful in several applications of precision farming. The infor-mation on the variable feed rate of forage can be used for the calculation of the site-specific forage crop yield for a yield map.
Flowrate measurement techniques for forage harvest-ers were published previously. Vansichen and De Baer-demaeker (1993) calculated the yield from the torque of the harvester blower. Another possibility is to measure the distance between the feeder rolls of the harvester (Ehlert and Schmidt 1995). Recently (1996), Auernham-mer and Demmel measured the yield using a nuclear gauge sensor placed in the spout of a forage harvester. A mass flow sensor for a pull type (trailed) forage har-vester based on a reaction of a curved plate in the spout was constructed and tested by Missotten et al. (1997).
A site-specific measurement of biomass in growing crops was proposed using a pivoted cylindrical body moving horizontally through a plant population (moving pendulum). The angle of deviation of this pendulum var-ies with the plant propertvar-ies (e.g. stand density, stem thickness, crop maturity, material moisture). These mea-surements were performed on cereals (Ehlert and Schmidt 1996).
Martel and Savoie (1999) installed four sensors in a forage harvester to measure the feedroll displacement, the crop impact force against a hinged plate above the blower, the frequency of a capacitance controlled oscil-lator near the end of the spout, and the number of light beam interruptions by forage particles in the spout. Sig-nificant results were obtained from the feedroll displace-ment and the crop impact force. The linear relationship between the material feed rate and the measured signals was observed with R-Squared coefficient R2 = 0.95 for the
feedroll displacement, and R2 = 0.94 for the crop impact force, respectively. The frequency of light beam interrup-tions was not sensitive to the changes in the throughput levels. The frequency of capacitance controlled oscilla-tor increased linearly with the increasing feed rate and the slope was related to the moisture content. A number of calibration parameters would be required for the preci-sion work of this system.
Demmel et al. (2002) used the principle based on the belt weighing technology for the measurement of the mowing machine material feed rate. This system can be used only for the mowing machines equipped with swather conveyor.
The objective of this research was to develop yield-mapping capabilities for modern mowing machines equipped with conditioners. The measurement of the material feed rate is based on the conditioner power in-put as measured by a torque-meter, or on the material change in momentum measured by a curved impact plate.
MATERIAL AND METHODS
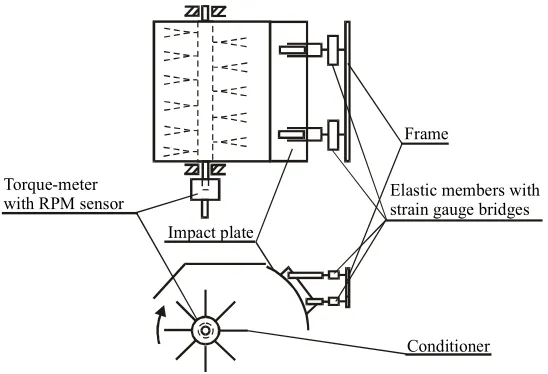
Besides the torque-meter, the mowing machine was equipped with a curved impact plate mounted at the exit of the machine. The material ejected from the mowing machine conditioner struck the impact plate. In this way, the force created by the change in direction was mea-sured. The curved impact plate was equipped with four elastic members with strain gauge bridges for the force measurement. The equipment for this material feed rate measurement is shown in Figure 1.
Voltage signals obtained by the strain gauges placed on the torque-meter and by the impact-plate four-bridge strain gauge were amplified and converted into frequen-cy by an electronic measuring apparatus developed in our laboratory. The output frequency was proportional to the measured tension. All signals were processed with a one-chip microcomputer and the data obtained were transferred into a notebook for storage.
Laboratory measurements were performed to obtain information on the relationship between the conditioner power input and the signals from the impact plate, and the material feed rate. It was necessary to determine the amount of the material feed rate of the conditioner. The laboratory set-up was composed of a conveyer belt car-rying a measured quantity of material, a tractor and a ro-tary drum-mowing machine equipped with an electronic measurement apparatus. The StatgraphicsPlus software was used for the statistical evaluation of the data achieved.
RESULTS AND DISCUSSION
In 2001, the objective of our research was to evaluate the possibility of utilising the two properties described for the material feed rate measurement. The relationships be-tween the material feed rates, the signals from the torque-meter, and the impact plate measurements were tested.
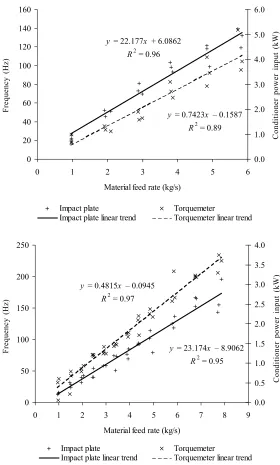
A mixture of alfalfa and grass was used in our measure-ments. The material was transported into the mowing machine for approximately five seconds in each measure-ment using a conveyer belt. The signals from the torque-meter, RPM sensor and the impact plate sensors were measured every half second. Ten values of the torque-meter measuring apparatus output frequency, RPM, and output frequency of the apparatus measuring impact force by means of the impact plate arrangement were obtained from a single measurement. The measurement was repeated a minimum of three times for each deter-mined amount of the material. The values obtained from these measurements were used in the calculation and charting. The measurements were divided between two days. Figure 2 shows the chart obtained from the first day measurements.
According to the chart (Figure 2), it is evident that the power input of the conditioner depends on the material feed rate linearly as well as the output frequency of the impact plate measuring apparatus. The R-Squared values were 0.96 for the impact plate, and 0.89 for the torque-meter.
The measurement was carried out also on the second day to improve its precision. The same test material was used on both days. The properties of the material were partly changed by the impact of the conditioner during the first day of measurement. The results of the second day measurement are presented in (Figure 3).
Figure 3 agrees with Figure 2 in the trend with differ-ences in the slope and R2. The R-Squared values were found to be 0.95 for the impact plate, and 0.97 for the torque-meter. It is possible to explain the higher value of the torque-meter correlation coefficient by the changed properties (hay moisture etc.) of the material on the sec-ond day. If the material properties are more uniform, the values obtained from the torque-meter are also more uni-form and the calculated average can be more accurate as
Elastic members with strain gauge bridges Impact plate
Frame
Torque-meter with RPM sensor
[image:2.595.162.436.542.729.2]Conditioner
well. This influence on the performance of the impact plate does not seem to be as important as in the case of the torque-meter measurement. The alternative correla-tion models (i.e. exponential, logarithmic) were tested as well. The R-Squared values of these models were some times by much some like the R-Squared values for the lin-ear model chosen. According to many authors (Ehlert and Schmidt 1995, Martell and Savoie 1999, Schmittmann et al. 2001) the linear model is preferred. For that reason, it was decided to use of linear models in all cases. From the chart (Figure 3), it is possible to determine with both measurement methods, the material feed rate difference with a value of 0.5 kg/s. Such accuracy should be suffi-cient for the practical utilisation, i.e., creating yields maps, etc. Schmittmann et al. (2001) determined the val-ue of the forage harvester material feed rate difference as 2 kg/s using different methods of the feed rate measure-ment.
The objective of the research carried out in the year 2002 was to test these two yield mapping capabilities under different conditions. The influence was measured of changing crop variety, crop maturity and moisture, and the intensity of conditioning. The impact of the chang-ing parameters in both measurement methods (torque-meter and impact plate) was studied.
Two types of material were used for this measurement: alfalfa with grass mixture, and grass from natural mead-ow. These crops were harvested on the same landhold-ing but at different crop maturity and moisture contents. Moisture contents varied from 82% to 72% in alfalfa with grass mixture, and from 77% to 74% in grass. Two levels of conditioning intensity were set up and tested during the measurement with each different material. The same procedure for data acquiring like in the year 2001 was used for the measurement in 2002 and the data acquired were used in calculation.
y = 22.177x + 6.0862
R2 = 0.96
y = 0.7423x – 0.1587
R2 = 0.89
0 20 40 60 80 100 120 140 160
0 1 2 3 4 5 6
Material feed rate (kg/s)
0.0 1.0 2.0 3.0 4.0 5.0 6.0
Impact plate Torquemeter
Impact plate linear trend Torquemeter linear trend
Figure 2. Dependence of the conditioner power input and output frequency of the apparatus me-asuring the impact force by means of impact plate arrangement on material feed rate (first day measurements)
y = 23.174x – 8.9062
R2 = 0.95
y = 0.4815x – 0.0945
R2 = 0.97
0 50 100 150 200 250
0 1 2 3 4 5 6 7 8 9
Material feed rate (kg/s)
0.0 0.5 1.0 1.5 2.0 2.5 3.0 3.5 4.0
Impact plate Torquemeter
[image:3.595.62.342.300.765.2]Impact plate linear trend Torquemeter linear trend
Figure 3. Dependence of the conditioner power input and output frequency of the apparatus measuring impact force by means of impact pla-te arrangement on mapla-terial feed rapla-te (second day measurements)
Frequency (Hz)
Frequency (Hz)
Conditioner power input (kW)
(and moisture), the measurements with the material from the same landholding were repeated after two weeks. The first number in the file name indicates whether the mea-sured file was obtained in the first measurement (i.e. Gra_1) or in the second measurement (i.e. Gra_2). To study the influence of the conditioning intensity, two levels of this intensity were set up on the mowing machine condition-er for each matcondition-erial measured. A smallcondition-er intensity of con-ditioning is marked by con_2, and a higher intensity is marked by con_4. Using this algorithm, the file name (for example) Alf_1_con_4 indicates that this file comes from the first measurement with alfalfa and grass mixture crop, and that a higher intensity of conditioning was set up on the mowing machine conditioner.
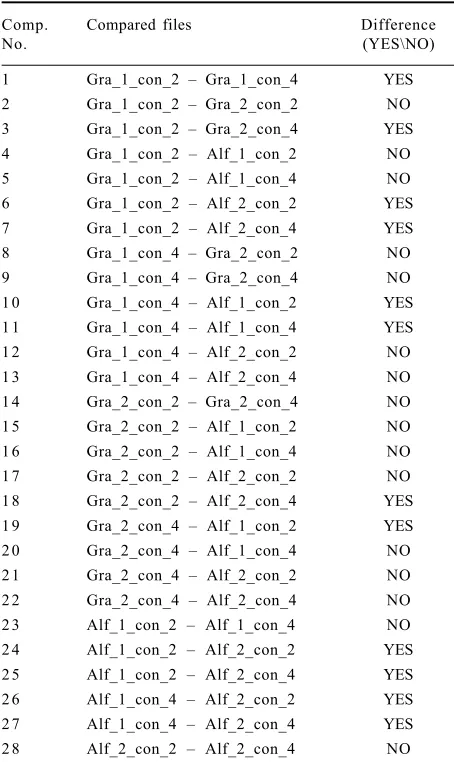
The analysis of variance was used for the data evalua-tion in the first step. It was necessary to test the null hypothesis that the standard deviations of the data achieved are the same. The P-value 0.00266918 of Co-chran’s test and P-value 0.00000429378 of Bartlett’s test were calculated. Since both of these calculated P-values are less than 0.05, a statistically significant difference exists between the standard deviations at the 95% confi-dence level. This unfortunately violates one of the im-portant assumptions underlying the analysis of variance. It was not possible to use the analysis of variance for the data evaluation in this case. For this reason, it was de-cided to use two-sample comparisons. The files of the data measured were compared with one another. Table 1 shows the results of the two-sample comparisons for all file combinations.
It follows from Table 1 that out of 28 pairs of files test-ed, in 12 cases existed a statistically significant difference between the means of two samples at the 95% confidence levels. Of particular interest are the comparisons No. 1, 11, 24 and 27. In these cases, the change of only a single factor very probably affected the measurement.
In the comparison No. 1, the function was tested of the measuring device using the same grass from natural meadow with 77% material moisture. The intensity of conditioning only was changed. It is possible to derive from the result of this comparison that the set-up of the intensity of conditioning is an important factor affecting the torque-meter measurement.
[image:4.595.63.290.81.462.2]From the comparison No. 11 another important finding follows. The first compared file was achieved during the function of the measurement device with alfalfa and grass mixture in optimal crop maturity for the harvest and a high-er set-up of the intensity of conditioning. The second com-pared file was obtained with grass in optimal crop maturity
Table 1. Statistically significant differences (indicated by t-test) between the files obtained by torque-meter measurement
Comp. Compared files Difference
No. (YES\NO)
1 Gra_1_con_2 – Gra_1_con_4 YES 2 Gra_1_con_2 – Gra_2_con_2 NO 3 Gra_1_con_2 – Gra_2_con_4 YES 4 Gra_1_con_2 – Alf_1_con_2 NO 5 Gra_1_con_2 – Alf_1_con_4 NO 6 Gra_1_con_2 – Alf_2_con_2 YES 7 Gra_1_con_2 – Alf_2_con_4 YES 8 Gra_1_con_4 – Gra_2_con_2 NO 9 Gra_1_con_4 – Gra_2_con_4 NO 1 0 Gra_1_con_4 – Alf_1_con_2 YES 1 1 Gra_1_con_4 – Alf_1_con_4 YES 1 2 Gra_1_con_4 – Alf_2_con_2 NO 1 3 Gra_1_con_4 – Alf_2_con_4 NO 1 4 Gra_2_con_2 – Gra_2_con_4 NO 1 5 Gra_2_con_2 – Alf_1_con_2 NO 1 6 Gra_2_con_2 – Alf_1_con_4 NO 1 7 Gra_2_con_2 – Alf_2_con_2 NO 1 8 Gra_2_con_2 – Alf_2_con_4 YES 1 9 Gra_2_con_4 – Alf_1_con_2 YES 2 0 Gra_2_con_4 – Alf_1_con_4 NO 2 1 Gra_2_con_4 – Alf_2_con_2 NO 2 2 Gra_2_con_4 – Alf_2_con_4 NO 2 3 Alf_1_con_2 – Alf_1_con_4 NO 2 4 Alf_1_con_2 – Alf_2_con_2 YES 2 5 Alf_1_con_2 – Alf_2_con_4 YES 2 6 Alf_1_con_4 – Alf_2_con_2 YES 2 7 Alf_1_con_4 – Alf_2_con_4 YES 2 8 Alf_2_con_2 – Alf_2_con_4 NO
Gra_1 – grass, first measurement; Gra_2 – grass, second meas-urement; Alf_1 – alfalfa and grass mixture, first measmeas-urement; Alf_2 – alfalfa and grass mixture, second measurement; con_2 – smaller intensity of conditioning; con_4 – higher intensity of conditioning
Torque-meter
Eight files of the torque-meter measurement were ob-tained during our experiments in this way. The files are named using the following principle: All files achieved with the grass measurement are marked starting with Gra, and with alfalfa and grass mixture are marked starting with Alf. To compare the influence of the crop maturity
Table 2. The results of the analysis of variance for the files obtained during impact plate measurement
Source Sum of squares Df Mean square F-ratio P-value
Between groups 13669.6 7 1952.81 0.61 0.7441
Within groups 244620.0 8 3 3188.19
[image:4.595.65.534.697.760.2]for the harvest and a higher set-up of the intensity of con-ditioning as well. It is possible to derive from that compar-ison that the variety of the harvested crop can influence the power input as measured by the torque-meter.
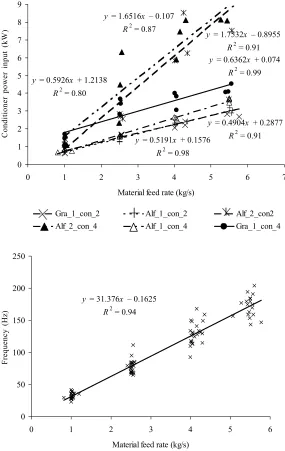
Comparisons No. 24 and 27 test files measured with alfalfa and grass mixture in optimal crop maturity (82% material moisture) with the files measured with older (har-vested after two weeks) alfalfa and grass mixture crop from the same field (72% material moisture). If the files with the same set-up of the intensity of conditioning are compared, in both cases a statistically important differ-ence exists between these files. It follows from these comparisons that the crop maturity can also influence the power input measured by the torque-meter. All files from comparisons No. 1, 11, 24 and 27 (with calculated coefficients for linear correlation) are charted in Figure 4. In those comparisons where a statistically important difference between two files was calculated, the combi-nation of these three factors very probably influences the
y = 31.376x – 0.1625
R2 = 0.94
0 50 100 150 200 250
0 1 2 3 4 5 6
Material feed rate (kg/s)
torque-meter measurement. It is not possible to detect which one from the factors tested influences the mea-surement more than the rest of them.
Impact plate
Eight files of the impact plate measurement were also obtained during our experiments. The analysis of vari-ance was used for the data evaluation. It was necessary to test the null hypothesis that the standard deviations of the data achieved were identical. The P-value 0.461494 of Cochran’s test and P-value 0.878545 of Bartlett’s test were calculated. Since the smaller of the P-values is greater than 0.05, there is not a statistically significant difference between the standard deviations at the 95% confidence level. It is possible to use the analysis of variance for the data evaluation in this case. The results of the analysis of variance are given in Table 2.
[image:5.595.63.348.55.506.2]Figure 5. Dependence of the output frequency of the apparatus measuring impact force by means of impact plate on material feed rate Figure 4. Graphic comparison of files tested with use of torque-meter measurement
Conditioner power input (kW)
Frequency (Hz)
y = 0.4904x + 0.2877
R2 = 0.91
y = 0.5191x + 0.1576
R2 = 0.98
y = 1.7532x – 0.8955
R2 = 0.91
y = 1.6516x – 0.107
R2 = 0.87
y = 0.6362x + 0.074
R2 = 0.99
y = 0.5926x + 1.2138
R2 = 0.80
0 1 2 3 4 5 6 7 8 9
0 1 2 3 4 5 6 7
Material feed rate (kg/s)
ABSTRACT
Vývoj a ověření funkce dvou metod měření okamžité průchodnosti materiálu žacím strojem
Byly vyvinuty dvě metody pro měření okamžité průchodnosti materiálu rotačním žacím strojem. První metoda je založena na měření okamžitého příkonu čechrače pomocí torzního dynamometru a druhá na měření hybnosti materiálu vycházejícího z čechrače pomocí nárazové desky. V roce 2001 bylo zjištěno, že existuje dobrá lineární závislost údajů z dynamometrické-ho měření i z měření pomocí nárazové desky na okamžitém množství materiálu procházejícídynamometrické-ho žacím strojem. Koeficienty determinace (R2) se pohybovaly okolo 0,95. V roce 2002 byl testován vliv změn různých vlastností sklízeného materiálu
a intenzity jeho úpravy na přesnost měření. Bylo zjištěno, že zralost sklízeného materiálu, jeho druh a nastavená intenzita čechrání statisticky významně ovlivňují měření založená na principu sledování příkonu čechrače. U nárazové desky nebylo možno vlivy těchto veličin na měření statisticky prokázat.
Klíčová slova: žací stroje; měření průchodnosti materiálu; příkon čechrače; nárazová deska
Corresponding author:
Ing. Dr. František Kumhála, Česká zemědělská univerzita v Praze, 165 21 Praha 6-Suchdol, Česká republika tel.: + 420 224 383 135, fax: + 420 234 381 828, e-mail: [email protected]
The calculated F-ratio equals in this case 0.612512. Since the P-value of the F-test is in this case greater than 0.05, no statistically significant difference exists between the means of the files tested at 95% confidence level. It follows from that analysis that it is not possible to find the mean significantly different from others. The influ-ence of the factors tested on the impact plate measurement cannot be determined statistically on the basis of our tests. All impact plate measurement values are charted in Fig-ure 5. Because no statistically significant difference be-tween the files tested was found, the linear correlation was applied to all data. The calculated R-Squared value was 0.94. This is in a good agreement with the measure-ments achieved in 2001.
The measurements carried out showed a very good lin-ear relationship between the conditioner power input and output frequency and the apparatus measuring force by means of an impact plate arrangement on the material feed rate. The change of the intensity of conditioning itself or the change of crop maturity itself or the change of crop variety itself can make statistically significant differenc-es between the fildifferenc-es measured with the torque-meter. Consequently, factors tested can have a statistically sig-nificant influence on the measurement based on the torque-meter.
Conversely, if the method based on the impact plate is used, it is not possible on the basis of our experiments to determine any statistically significant influence of the changes of the factors tested on the impact plate mea-surement. The measurement method based on the use of the impact plate can be less sensitive to the material and the intensity of conditioning changes. Another advan-tage for the impact plate utilisation can be its simplicity and lower costs in comparison with the torque-meter. It
is possible to recommend an infield measurement ar-rangement to obtain relationships under the real field conditions.
REFERENCES
Aurenhammer H., Demmel M., Pirro P. (1996): Lokale Er-tragsermittlung mit dem Feldhäcksler. Landtechnik, 51: 152–153.
Demmel M., Schwenke T., Heuwinkel H., Locher F., Rott-meier J. (2002): Lokale Ertragsermittlung in einem Scheibenmähwerk mit Aufbereiten. Proc. Conf. Agr. Eng., Halle, VDI Verlag GmbH: 139–143.
Ehlert D., Schmidt H. (1995): Ertragskartierung mit Feld-häckslern. Landtechnik, 50: 204–205.
Ehlert D., Schmidt H. (1996): Ortsspezifische Biomassener-fassung in stehenden Pflanzenbeständen. Landtechnik, 51: 86–87.
Martel H., Savoie P. (1999): Sensors to measure forage mass flow and moisture continuously. ASAE Pap. No. 991050, St. Joseph, Michigan, USA.
Missotten B., Broos B., Strubbe G., De Baerdemaeker J. (1997): A yield sensor for forage harvesters. In: Stafford J.V. (ed.): Precision Agriculture ’97, BIOS Sci. Publ., UK: 529–535.
Schmittmann O., Kromer K.-H., Weltzien C. (2001): Yield-monitoring on forage harvester. In: Blahovec J., Libra M. (eds.): Physical methods in agriculture, approach to preci-sion and quality. CUA, Prague: 286–291.
Vansichen R., De Baerdemaeker J. (1993): A measurement technique for yield mapping of corn silage. J. Agr. Eng. Res., 55: 1–10.