An adequate concentration of phosphorus in soil so-lution and its refilling from the solid phase of soil are necessary for the required production of agricultural crops (Tisdale and Nelson 1975, Denison and Kiers 2005, Reid and Scholas 2005). The concentration of soluble phosphorus fractions in the aqueous phase of the surface layer of soil is also important from the environmental aspect of potential phosphorus runoff into surface waters (Matula 2009).
The knowledge of composition of the phospho-rus concentration in soil solution could underlie a reasonable consensus between the agronomic and environmental approach. The equilibrium P-concentration in the soil solution is also a good parameter for improving P-soil testing. It agrees with the opinion (Sims 2000, Fixen 2005, White and Brown 2010) that only an unconditionally neces-sary level of soluble forms of phosphorus should be maintained in agriculturally productive soils to ensure the necessary yield of agricultural crops.
Data on an adequate optimum concentration of phosphorus in the soil solution are scarce and
inconsistent; in fertile arable soils they range from 0.03 to 0.3 ppm P (Tisdale and Nelson 1975, Sanchez 1976, Sims 2000, Mengel and Kirkby 2001). It is generally agreed that the soil solution is a centre of all chemical and biological activities in soil. The cause of the inconsistency of data on phosphorus concentration in soil solution may also be a very difficult methodical procedure and labour-consuming isolation of soil solution from the soil. Sampling methodology of soil solution has a profound influence on the composition of the soluble constituents, so one cannot study the soil solution without altering it (Schwab 2000). The specification of the method of soil solution extraction from the solid phase of soil and also the end-point analytical procedure of phosphorus determination will influence the obtained values of phosphorus concentration. All older data on phosphorus concentration in the aqueous phase were mostly determined colorimetrically using the phosphomolybdenum blue complex that basically detects only inorganic phosphorus, orthophosphate
Relationship between phosphorus concentration in soil
solution and phosphorus in shoots of barley
J. Matula
Crop Research Institute, Prague, Czech Republic
ABSTRACT
Phosphorus concentration in the soil solution of agricultural soils should be a consensus of the agronomic and environmental aspect. Data from literary sources are inconsistent if the method of soil solution extraction from the soil and the method of phosphorus detection are not indicated. In the present paper a simplified procedure of soil solution extraction is used that is derived from the need of water to attain saturated soil paste. Based on barley cultivation in a plant growth chamber on 72 different soils the relationship between P concentration in simulated soil solution and the response of test plant (spring barley) was evaluated. Three approaches were used to derive an adequate P concentration in soil solution. Based on the diagnostics of P content in barley the following adequate P concentrations in soil solution were derived: 0.23–0.86 ppm P for colorimetry and 0.9–1.75 ppm P for ICP-AES. Using the concept of the boundary line of yield the critical P concentration in soil solutions was 0.8 ppm P for colorimetry and 1.3 ppm P for ICP-AES. The concept of the boundary line of P efficiency index enabled to define P concentrations in soil solution that can be considered as the lower limits of suitability from the agronomic aspect: 0.15 ppm P in simulated soil solution for colorimetry and 0.7 ppm P for ICP-AES.
Keywords: soil testing; plant growth chamber; colorimetric detection; ICP-AES detection
ions. Recently, an ICP-AES technique has been in-troduced for phosphorus detection on a larger scale that detects all soluble phosphorus, i.e. inorganic phosphorus including organic phosphorus. The determination of total soluble phosphorus in the aqueous phase is important from the environmental aspect because all forms of soluble phosphorus are detected that may be transported to surface and subsurface runoff waters. Matula (2011) found that differences between the phosphorus values detected by ICP and colorimetry in the water extracts were uneven, they relatively increased with a decrease in the phosphorus reserve in soils.
The objective of our study was to contribute to the knowledge of an adequate phosphorus concentra-tion in soil soluconcentra-tion for the needs of innovaconcentra-tion and correction of criteria of phosphorus reserve in soils both from agronomic and environmental aspects. Another objective was to simplify and standardise the method of soil solution extraction from the solid phase of soils that would be applicable also in routine testing of a larger number of soil samples. In the present study this problem is solved by so called simulated soil solution. Vegetation trials of the cultivation of a test plant in a plant growth chamber were used to find the response of plants to P concentration in a simulated soil solution of the set of 72 different soils. The advantage of growth chamber studies is the acquisition of cheaper and more expeditious information on the relationship between biological availability of nutrients in a larger set of soils with different characteristics of soil reserve under standardised conditions of cultivation of test plants (Dahnke and Olson 1990).
MATERIAL AND METHODS
Research was conducted on 72 soil samples taken from the surface profile (20 cm) of agricultural lands in different localities of the Czech Republic. The soil samples were homogenized by screening through a 2-mm sieve, and finished by air-drying.
The following important basic agrochemical soil characteristics were determined in soil samples: pH, CEC value and content of oxidisable soil or-ganic matter. The pH value was determined in a soil suspension with 0.2 mol KCl/L solution at a 1:1 ratio (w/v). The CEC value was determined according to Matula (1996). The content of oxidiz-able soil organic matter was determined according to Sims and Haby (1971).
Soil solution was extracted from the soil samples to determine the concentration of colorimetrically
detected phosphorus, so called dissolved reac-tive phosphorus (Matula 2011), and dissolved total phosphorus by means of ICP-AES technique. Biological availability of phosphorus was deter-mined in these soils using a test plant in growth chamber studies.
Procedure of extraction of simulated soil so-lution. It is a modification of the laboratory pro-cedure of water extraction that consists of three steps: (a) addition of water to obtain saturated water paste or beyond; (b) equilibrating; (c) removing the solution. The advantages of these techniques include ease of preparation, simple separation of soil and solution, and the ability to control many experimental parameters (Schwab 2000).
The simulation of soil solution is based on the need of water for attaining so called saturated soil paste using a friction test of 25 g of soil. Determination of the water need for attaining so called saturated water paste is a very labour- and time-consuming procedure especially if standard-ised technological equipment is lacking. For this reason we focused our efforts on an experimental solution of the relationship between water need for the creation of saturated soil paste and cation exchange capacity of soil (CEC).
Based on our research into a large set of soils from topsoil of the Czech Republic a close regression relation was found out between the CEC value of soil and water need for the creation of saturated soil paste: y (mL of water)/25 g of soil) = 0.4616 × × CEC0.552
Procedure of water addition. An amount of 50 g of the soil sample is weighed into a centrifugation cuvette with lid. Shake the soil in a cuvette to make its surface slant as far as the edge of the cuvette neck. Add the calculated volume of distilled wa-ter to the soil with a graduated pipette to create saturated paste in relation to the CEC value of soil that will be increased by a half. The calculation of water addition to 50 g of soil: mL H2O/50 g = ((0.4616 × CEC0.552) × 2) × (1.5). After water is added to the soil, close the cuvette with lid and leave it in laboratory overnight (equilibrating step).
volume with distilled water to the full volume of the pipette. Deduce the dilution of simulated soil solution from data. Empty the pipette contents through the folded filter paper cone (7–9 cm in diameter, Filtrak 389 or Whatman 40) in order to potentially capture floating organic impurities into sample tubes. The samples of solutions are analysed without delay for phosphorus content by ICP-AES technique and colorimetry.
The phosphorus concentration in simulated soil solution was determined by means of the reduced phosphomolybdenum blue complex on a SKALAR auto-analyser (Skalar 1992) and by the ICP-AES technique on a Thermo Jarrell Ash Trace Scan ana-lyser (Franklin, USA).
Growth chamber trials. Short-term (21-day) vegetation trials were established on each soil with spring barley cv. Jersey as a test plant. Each variant had three replications. Vegetation pot of 6 cm in diameter was filled with 150 g of soil. Fifteen barley seeds (after their washing and one-hour soaking in distilled water) were planted onto the soil surface in the vegetation pots and covered with 25 mL of coarse-grained quartz sand. Moistening of the vegetation pots was differentiated on the basis of an experimentally determined relation-ship between the field water capacity of soil and the value of its cation exchange capacity (CEC) (Matula et al. 2000). The moisture content was regularly renewed according to the weight loss of the vegetation pot. Cultivation took place in a plant growth chamber with the light and tempera-ture regime: daylight 16 h, 20°C, dark 8 h, 15°C; photosynthetically active radiation 500 μE/m2/s. Nitrogen dose of 6 mg N/pot, as NH4NO3 solution, was applied continuously ten times during the trial. Harvested barley shoots were instantly dried at 65°C. A Milestone microwave device was used for mineralisation of barley dry matter in the medium
of nitric acid and hydrogen peroxide; the analysis was carried out on an ICP-AES Trace SCAN ap-paratus (Thermo Jarrell Ash, Franklin, USA).
Results were evaluated by the statistical pro-grammes GraphPad PRISM, Ca., USA, version 3 and Microsoft Excel 2007.
RESULTS AND DISCUSSION
The set of soils with a large range of agrochemical characteristics was chosen intentionally for these experiments so that obtained results would have a more universal application for the exact specification of adequate phosphorus reserve in agricultural soils. The feature of universal functionality in different soil conditions is one of the fundamental prerequisites of sophisticated soil testing in future (Skogley 1994).
[image:3.595.63.531.599.761.2]Tables 1 and 2 show statistical parameters of soil characteristics. Minimum values of oxidis-able carbon (Cox) content, values of cation ex-change capacity (CEC) and pH values were as follows: 0.85% Cox, 59 mmol+/kg and 3.55 pH0.2 mol/L KCl, respectively. On the contrary, maxi-mum values of oxidisable carbon (Cox) content, values of cation exchange capacity (CEC) and pH values were substantially higher: 5.13% Cox, 305 mmol+/kg and 7.21 pH0.2 mol/L KCl, respectively. The determined phosphorus concentration in soil solution at colorimetric detection ranged from the minimum 0.016 mg P/1000 mL to 4.333 mg P/1000 mL. When phosphorus was determined in simulated soil solution by ICP-AES technique, the concentration ranged from the minimum 0.258 mg P/1000 mL to 5.259 mg P/1000 mL. Differences in the concentration of phosphorus in simulated soil solution detected by colorimetry and ICP were uneven in the range of determined concentrations (Table 2). Similarly like in Matula (2010, 2011) the
Table 1. Column statistics of basic soil characteristics (72 analysed soils)
Statistic parameters Oxidised organic matter (% C) (mmolCEC
+/kg)
pH (0.2 mol/L KCl)
Minimum 0.85 59 3.55
25% percentile 1.60 128 5.27
Median 1.97 139 5.70
75% percentile 2.46 154 6.28
Maximum 5.13 305 7.21
Mean 2.15 146 5.77
Coefficient of variation (%) 37.4 27.9 12.9
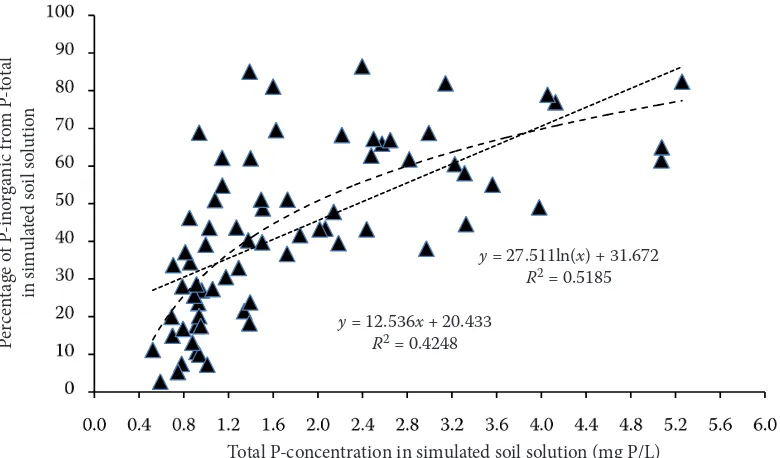
largest differences were observed in the area of low phosphorus concentrations in soil extracts. It is assumed that colorimetrically determined phosphorus using the phosphomolybdenum blue complex represents inorganic phosphorus, i.e. orthophosphate ions. Phosphorus detection by ICP-AES technique shows total phosphorus. The difference between ICP determination and color-imetry can be considered as organic phosphorus including particulate phosphorus (Baldwin 1998, Worsfold et al. 2005, Kowalenko and Babuin 2007). The scatter plot in Figure 1 illustrates a
[image:4.595.66.527.88.320.2]relation-ship between the total phosphorus concentration in simulated soil solution and the percentage of inorganic phosphorus detected colorimetrically in simulated soil solution. These results document a possibility of great differences between inor-ganic phosphorus (detected colorimetrically) and total phosphorus detected by ICP-AES. In other words, data on the phosphorus concentration in soil solution may be misleading if the method of phosphorus detection is not indicated, especially in the area of low phosphorus concentrations in soil solution. It also may elucidate the reason for a Table 2. Column statistics of the phosphorus concentration in simulated soil solution of 72 soils and P-content in barley shoots
Statistic parameters
Phosphorus concentration in simulated soil solution
(mg P/1000 ml) Percentage of colorimetric P from ICP-AES phosphorus (%)
Phosphorus content in dry matter of barley shoots Colorimetry
determination determinationICP-AES
Minimum 0.016 0.258 2.8 1.83
25% percentile 0.246 0.935 26.3 3.56
Median 0.632 1.389 43.2 4.48
75% percentile 1.498 2.458 62.0 5.35
Maximum 4.333 5.259 86.5 6.45
Mean 0.946 1.801 43.45 4.37
Standard deviation 0.940 1.169 22.1 1.09
Standard erorr 0.111 0.138 2.6 0.129
Coefficient of variation (%) 99.4 64.9 50.9 25
Geometric mean 0.538 1.494 36.0 4.22
Figure 1. Scatter diagram of percentage of inorganic phosphorus from total phosphorus of simulated soil solu-tion in relasolu-tion to the total phosphorus concentrasolu-tion in simulated soil solusolu-tion of 72 soils
Per
cen
ta
ge o
f P
-in
or
ga
nic f
ro
m P
-to
ta
l
in sim
ul
at
ed s
oi
l s
ol
ut
io
n
Total P-concentration in simulated soil solution (mg P/L)
y = 27.511ln(x) + 31.672
R2 = 0.5185 y = 12.536x + 20.433
[image:4.595.90.480.496.725.2]high inconsistency in literary data on the adequate phosphorus concentration in soil solution.
Table 2 shows the column statistics of determi-nation of phosphorus content in barley shoots. Variability of the range of phosphorus content in plants was substantially lower than that of phos-phorus concentration in simulated soil solution, which is consistent with general knowledge. The range between 2 and 5 mg P/g dry matter is con-sidered as sufficient phosphorus content in plant leaves while toxicity occurs when the content of 10 mg P/g dry matter is exceeded (White and Brown 2010). The sufficient phosphorus content in dry weight of shoots for young barley plants is reported to be 3.5–5 mg P/g (Bergmann and Neubert 1976, Jones et al. 1991).
[image:5.595.66.455.58.286.2] [image:5.595.65.424.536.747.2]Figures 2 and 3 illustrate the determined rela-tionship between phosphorus concentration in simulated soil solution and the response of phos-phorus content in barley. Using a second-order polynomial regression, the phosphorus concen-tration of 0.23 mg P/L detected colorimetrically in simulated soil solution corresponded to the content of 3.5 g P/kg of barley dry matter and it was substantially higher, 0.9 mg P/L, at ICP-AES detection. The following values of phosphorus concentration in simulated soil solution corre-sponded to the content of 5 g P/kg dry matter: 1.25 mg P/L at colorimetric detection and 2.2 mg P/L at ICP-AES detection. The scatter plots of the relationship in Figures 2 and 3 suggest that the use of continuous regression of the second-order Figure 2. The relation-ship between phosphorus content in shoots of bar-ley and colorimetrically determined phosphorus concentration in simu-lated soil solution
Figure 3. The relation-ship between phos-phorus content in shoots of barley and ICP-AES determined phosphorus concen-tration in simulated soil solution
Colorimetrically determined P-concentration in simulated soil solution (mg P/L)
Ph
os
ph
or
us co
nt
en
t in dr
y m
at
ter
of b
ar
le
y s
ho
ots (g P/kg)
Ph
os
ph
or
us co
nt
en
t in dr
y m
at
ter
of b
ar
le
y s
ho
ots (g P/kg)
ICP-AES determined phosphorus concentration in simulated soil solution (mg P/L)
y = –0.379x2 + 2.062x + 3.039 R2 = 0.6554
y = 2.552x + 2815
R2 = 0.5772
y = 1.866x + 1.7392
R2 = 0.4238
polynomial for the derivation of P concentration in simulated soil solution related to the content of 5 g P/kg barley dry matter overestimates the necessary concentration in simulated soil solu-tion. The use of a linear approach (Dahnke and Olson 1990) will be more appropriate in this case. In the areas of low phosphorus concentrations in soil solution the scatter plots clearly indicate the steep relationship of an increase in phosphorus content in barley followed by the ‘saturation level’, i.e. with a minimum change in phosphorus content in barley. The point of intersection of the steep line and the ‘saturation’ line clearly defines the upper limit of an adequate phosphorus concentra-tion in soil soluconcentra-tion: 0.86 mg P/L for colorimetric detection and 1.75 mg P/L for ICP-AES detection,
i.e. substantially lower values than when the con-tinuous curve of the second-order polynomial is used. Hussain et al. (2010) reported on the basis of research on three soils the concentration of soil solution colorimetrically detected 0.34–0.45 mg P to achieve the maximum wheat yield. In our case an adequate range between 0.23 and 0.86 mg P/L in soil solution was detected, which is similar to the findings of Hussain et al. (2010) if taking into account the average of the values.
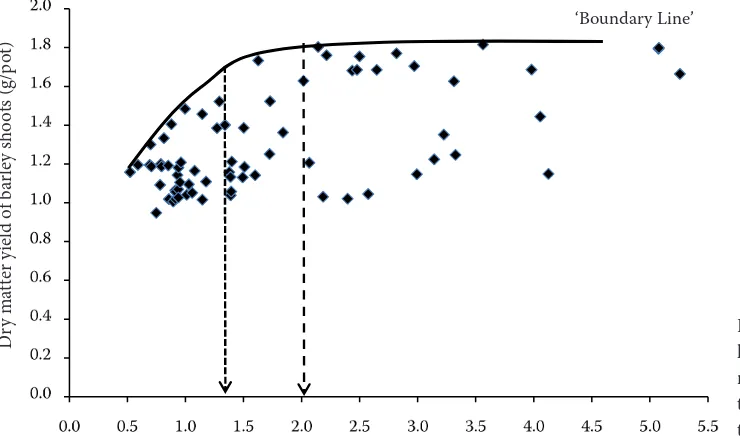
[image:6.595.68.501.59.279.2]It is advantageous and popular to use the con-cept of boundary line, originally published by Webb (1972), for the analysis of biological data. In Figures 4 to 7 the concept of boundary line is used for the estimation of adequate phosphorus concentration in soil solution. In Figures 4 and 5 Figure 4. Yield boundary line of barley shoots in rela-tion to the concentrarela-tion of colorimetrically determined phosphorus in simulated soil solution
Figure 5. Yield boundary line of barley shoots in relation to the concen-tration of ICP-AES de-termined phosphorus in simulated soil solution
Colorimetrically determined phosphorus concentration in simulated soil solution (mg P/L)
Dr
y m
at
ter y
ie
ld o
f b
ar
le
y s
ho
ots (g/p
ot)
ICP-AES determined phosphorus concentration in simulated soil solution (mg P/L)
Dr
y m
at
ter y
ie
ld o
f b
ar
le
y s
ho
ots (g/p
ot)
‘Boundary Line’
[image:6.595.65.435.529.748.2]the boundary line of barley yield formation is used in relation to phosphorus concentration in simulated soil solution. The weak side of this approach is the indistinctly defined beginning of the maximum of yield formation, which has a very flat shape then. The flatness of the boundary line of yield curve complicates a more exact defini-tion of the upper limit of adequate phosphorus concentration in soil solution. The beginning of the maximum yield of barley shoots corresponded with the following phosphorus concentrations in simulated soil solution in relation to the method of phosphorus detection: colorimetry 1.5 ppm P, ICP-AES 2 ppm P. The critical concentration of a nutrient in the soil is generally relative to the 90–95% level of achieved yield (Munson and Nelson
[image:7.595.69.433.56.282.2]1990, Hussain et al. 2010). The critical concen-tration of phosphorus in simulated soil solution related to 95% yield level corresponded to 0.8 ppm P at colorimetric detection and 1.3 ppm at ICP-AES detection. In our previous studies (Matula 2004) the index of nutrient efficiency (IE) was used that expresses the relation of nutrient content to yield (IE = yield/nutrient). An advantage of this approach is the sharply defined maximum that corresponds to the best utilisation of the nutrient for yield formation. Figures 6 and 7 show the relationship of the boundary line of phosphorus efficiency index in barley to phosphorus concentration in soil solution. The maximum of the boundary line corresponds to largely different values of phos-phorus concentration in simulated soil solution
Figure 6. Boundary line of phosphorus index nutri-ent efficiency in relation to the concentration of colorimetrically deter-mined phosphorus in simulated soil solution
Figure 7. Boundary line of phosphorus index nu-trient efficiency in rela-tion to the concentrarela-tion of ICP-AES determined phosphorus in simulated soil solution
In
dex efficien
cy o
f p
hos
ph
or
us u
se
d b
y b
ar
le
y
Colorimetrically determined phosphorus concentration in simulated soil solution (mg P/L)
In
dex efficien
cy o
f p
hos
ph
or
us u
se
d b
y b
ar
le
y
ICP-AES determined phosphorus concentration in simulated soil solution (mg P/L)
‘Boundary Line’
[image:7.595.67.536.525.763.2]according to the method of phosphorus detection: 0.15 ppm P for colorimetry and 0.7 ppm P for ICP. The difference may be connected with our previ-ous findings about a marked relative decrease in the proportion of inorganic P in total phosphorus concentration in extracts from soils at low levels of P reserve in soil (Matula 2010, 2011). The de-rived concentrations in soil solution are close to the lower limit of adequate concentration in soil solution derived from phosphorus content in bar-ley 3.5 g P/kg dry matter (Figures 2 and 3). From the aspect of agronomic production the defined phosphorus concentrations in soil solution can be considered as the lower limit of adequate P concentration in soil solution. These determined concentrations correspond to the content of 3 g P/kg in dry matter of barley shoots.
REFERENCES
Baldwin D.S. (1998): Reactive ‘organic’ phosphorus revisited.
Water Research, 32: 2265–2270.
Bergmann W., Neubert P. (1976): Pflanzendiagnose und Pflan-zenanalyse. VEB Gustav Fischer Verlag, Jena.
Dahnke W.C., Olson R.A. (1990): Soil test correlation, calibration, and recommendation. In: Westerman R.L. (ed.): Soil Testing and Plant Analysis. Soil Science Society of America Book Series No. 3, Madison, 45–71.
Denison R.F., Kiers E.T. (2005): Sustainable crop nutrition: con-straints and opportunities. In: Broadley M.R., White P.J. (eds.): Plant Nutritional Genomics, Blackwell, Oxford, 242–286. Fixen P.E. (2005): Decision Support Systems in Integrated Crop
Nutrient Management. In: Proceedings No. 569. International Fertilizer Society, York.
Hussain A., Murtaza G., Ghafoor A., Mehdi S.M., Sabir M. (2010): Assessment of phosphorus requirements of wheat on different textured alluvial soils through Freundlich type equations.
Com-munication in Soil Science and Plant Analysis, 41: 2413–2431.
Jones J.B., Jr., Wolf B., Mills H.A. (1991): Plant Analysis Hand-book. Micro-Macro Publlishing, Inc., Athens, Georgia, USA. Kowalenko C.G., Babuin D. (2007): Interference problems with
phosphoantimonylmolybdenum colorimetric measurement of phosphorus in soil and plant materials. Communications in
Soil Science and Plant Analysis, 38: 1299–1316.
Matula J. (1996): Determination of potassium, magnesium, phos-phorus, manganese and cation exchange capacity for fertilizer recommendations used by Czech Union of Rapeseed
Grow-ers. Communications in Soil Science and Plant Analysis, 27:
1679–1691.
Matula J. (2004): Barley response to the soil reserve of sulphur and ammonium sulphate in short-term experiments under controlled conditions of cultivation. Plant, Soil and
Environ-ment, 50: 235–242.
Matula J. (2009): Possible phosphorus losses from the top layer of agricultural soils by rainfall simulations in relation to
multi-nutrient soil tests. Plant, Soil and Environment, 55: 511–518.
Matula J. (2010): Differences in available phosphorus evaluated by soil tests in relation to detection by colorimetric and
ICP-AES techniques. Plant, Soil and Environment, 56: 297–304.
Matula J. (2011): Determination of dissolved reactive and dis-solved total phosphorus in water extracts of soils. Plant, Soil
and Environment, 57: 1–6.
Matula J., Sychová M., Drmotová A. (2000): The effect of nitrogen fertilizers on pool of labile forms of sulphur and nitrogen in
soil. Rostlinná Výroba, 46: 29–35.
Mengel K., Kirkby E.A. (2001): Principles of Plant Nutrition. 5th
Edi-tion. Kluwer Academic Publishers, Dordrecht, Boston, London. Munson R.D., Nelson W.L. (1990): Principles and practices in
plant analysis. In: Westerman R.L. (ed.): Soil testing and plant analysis. Number 3 in the Soil Science Society of America Book Series, Madison, 359–387.
Reid W.V., Scholas R. (2005): Millennium Ecosystems and Human Well-being: Synthesis. Island Press, Washington DC. Sanchez P.A. (1976): Properties and Management of Soils in the
Trop-ics. John Wiley and Sons, New York, London, Sydney, Toronto. Schwab A.O. (2000): The soil solution. In: Sumner M.E. (ed.):
Hand Book of Soil Science. CRC Press, Boca Raton, London, New York, Washington DC.
Sims J.R., Haby V.A. (1971): Simplified colorimetric determination
of soil organic matter. Soil Science, 112: 137–141.
Sims T. (2000): Soil fertility evaluation. In: Sumner M.E. (ed.): Hand Book of Soil Science. CRC Press, Boca Raton, London, New York, Washington DC.
Skalar (1992): Soil and Plant Analysis. Skalar methods. Breda. Skogley E.O. (1994): Reinventing soil testing for the future. In:
Soil testing: Prospects for Improving Nutrient Recommenda-tions. SSSA Special Publication, No. 40, Madison.
Tisdale S.L., Nelson W.L. (1975): Soil Fertility and Fertilizers. 3rd
Edition. Collier Macmillan Publication, London, New York. Webb R.A. (1972): Use of the boundary line in the analysis of
biological data. Journal of Horticultural Science, 47: 309–319.
White P.J., Brown P.H. (2010): Plant nutrition for sustainable
de-velopment and global health. Annals of Botany, 105: 1073–1080.
Worsfold P.J., Gimbert L.J., Mankasingh U., Omaka O.N., Han-rahan G., Gardolinski P.C.F.C., Haygarth P.M., Turner B.L., Keith-Roach M.J., McKelvie I.D. (2005): Sampling, sample treatment and quality assurance issues for the determination of phosphorus species in natural waters and soils. Talanta,
66: 273–293.
Received on March 21, 2011
Corresponding author:
Doc. Ing. Jiří Matula, CSc., Výzkumný ústav rostlinné výroby, v.v.i., Drnovská 507, 161 06 Praha 6-Ruzyně, Česká republika