The necessity of communication with the market and the importance of its role results from the basic marketing philosophy, that is to know the market and its needs and to offer the most effective solution to satisfy these needs. The importance of communica-tion rises together with widening of the producers supply and their effort to achieve an advantageous competitive position on the market and the stability of its own existence. The market dynamics results in a change of the shopping behavior of the individual market segments, their requirements, expectations and inventions in order to satisfy the needs, which conditions the necessity of a new approach toward the creation of communication with the market (Kotler, Amstrong 2004; Kretter et al. 2007).
Advertising is a communication process between the company and a customer (potential customer) as a recipient. The goal is to reach mutual understand-ing; so in fact, the goal is to influence it (Bielik et al.
2001). It was also defined (De Pelsmacker et al. 2003) as a paid form of a non-personal communication of companies, non-profit companies and individuals who are somehow identified in the advertising and want to inform or persuade people from the specific public by the means of different types of media .
The mutual dependence and structure change the positions of the communication tools, the positions of the communication tools point out to the need of their coordination into an integrated system with the goal to achieve the synergic effect. An effective marketing program combines all the elements of the marketing mix into a form of a coordinated program in order to be in harmony with the marketing goals of the company (Nagyová 1999).
Without any doubt, advertising as one of the oldest tools for affecting the buyers is the most effective factor of the marketing communication (Horská 2000).
The food advertising market in the Slovak Republic
Reklamný trh potravín v SR
Ľ. NAGYOVÁ, M. KROČANOVÁ, Ľ. MAĎAROVÁ
Slovak University of Agriculture, Nitra, Slovak Republic
Abstract: In order to achieve success on the domestic and foreign markets, the producers and distributors should know the customers´ behavior and possibilities how to positively affect it for their advantage. The consumers carry out many shop-ping decisions every day. Most of the big sellers study these decisions in order to know what, where, when, how, how much or how many and why the customers buy. The marketers have to know how the consumers will react to different marketing programmes used by the company. The communication media such as information carriers are objective decision of the in-dividual advertising sponsors. This paper shows the volume of financial means invested by the advertising sponsors, produ-ction groups as well as the analysis of the food advertising market and the following survey of the biggest food advertisers in the Slovak Republic.
Key words: communication,market, consumer, media, advertising, food
Abstrakt: Pre dosiahnutie úspechu na domácom a zahraničnom trhu by výrobcovia a distribútori mali poznať spotrebi-teľské správanie a možnosti ako ho pozitívne ovplyvňovať vo svoj prospech. Spotrebitelia každodenne realizujú mnoho nákupných rozhodnutí. Väčšina veľkých predajcov venuje významnú pozornosť tomu, aby sa dozvedela čo, kde, kedy, ako, koľko a prečo spotrebitelia nakupujú. Marketingoví pracovníci musia poznať, ako budú spotrebitelia reagovať na rôzne marketingové programy, ktoré spoločnosť použije. Komunikačné prostriedky ako nositelia informácií bývajú predmetom rozhodovania jednotlivých zadávateľov reklamy. Príspevok poukazuje na objem finančných prostriedkov preinvestovaných jednotlivými zadávateľmi reklamy, produktové skupiny, analýzu reklamného trhu potravín a prehľad najväčších inzerantov na Slovensku.
Advertising tools and services are a vital element of the market competition. The socially oriented economy cannot work without this system. All of the legally produced and sold products must have free-dom of the marketing communication. Advertising is one of the basic marketable instruments for the chosen products and a crucial factor for the company turnover (Šimo 2006).
Advertising is an information that has to be acces-sible to the consumer who wishes to gain knowledge about the products and services. It is the tool of the company communication policy and has many forms and ways of use; therefore, it is difficult to generalize its qualities (Vysekalová 2002).
The strongest input by creating an advertising top quality is an ability to create the atmosphere loaded with ideas and dedication. Advertising enables the consumers to profit from the market competition, which widens the range of products, creates an inno-vative process and market-regulated prices. Without advertising, there does not have to be a visible dif-ference between the products.
Advertising creates and provides jobs also by bring-ing the efficiency to a company. New jobs are created by expansion, new market development and innovation is not achievable without the free marketing commu-nication. Hence, advertising creates the competition and supports the products innovation (Vysekalová, Mikeš 2003).
A creative commercial advertisement has to be simple, inspiring and coming from life. It is revealed in the form of a strong idea. Everyone whose heart has been touched by such a commercial is forced to notice it, accept and remember. That is the true meaning of advertising. A commercial has to amaze and surprise because this increases the chance of a brand or a prod-uct being liked by the people. Good advertising always looks for a specific way of communication, different from others (Vysekalová, Komárková 2002).
Advertising is surely a stimulative element of the global free trade. It should not be limited because it supports the transparence of supply and a direct contact with consumers. Excessive limitations of advertising would build a wall against the realization of the market mechanism, they would endanger the world trade and isolate the national one (Horská 2004).
OBJECTIVES OF THE PAPER AND METHODS USED
It is clear that producers are able to offer their do-mestic as well as foreign customers the food products
of such a quality that they can compete with foreign products. However, when shopping, a customer can hardly guess the level of quality hidden inside the package. From these reasons, it is necessary for the producer in both domestic and by entering the foreign markets to provide an appropriate marketing com-munication, whose goal is to coordinate the attitudes and behavior of the potential customers as well as of other subjects.
The goal of the paper is to point out to the develop-ment of the food advertising market characterized by the volume of financial means invested into ad-vertising in the chosen communication media. The communication media such as information carriers are an objective for decision making of the advertis-ing sponsors.
The partial goals of the paper are:
– to monitor the development of advertising market indicators in the SR;
– to evaluate the advertising market and advertising according to the volume;
– to evaluate the volume of financial means invested by the advertising sponsors and brands;
– to monitor the TOP 10 food producers from the aspect of volume of the invested financial means on advertising;
– to evaluate the food advertising market.
The analysis of expenses on advertising in the in-dividual media types is based on gaining the data related to the net sales from the sale of advertising publishers, broadcasters, outdoor companies and media agencies. Not available data were completed by the qualified estimations of the magazine “Strategies” and estimation equations considering the public sources and the TNS data. The main starting point for the qualified estimation of the size of the advertising market was the volume of advertising in the media. The methods of analysis, synthesis, comparation and index calculation were used. The numeric data can be found in the analytical tables and charts.
The data in the paper were found in the professional literature and magazines devoted to advertising as well as on the web page www.etrend.sk.
The time horizon of the research is 2001–2005.
RESULTS AND DISCUSSION Characteristics of the media market in the Slovak Republic
2005 was, as well as during last years, the volume of advertising in the media.
The size of the advertisement market are the ex-penses on advertising consisting of real exex-penses on advertising in the media and expenses on BTL activities such as sale support, public relations, direct marketing and sponsoring.
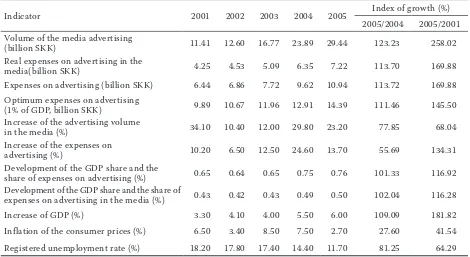
The advertising volume in the media (Figure 1) reached 29.44 billion SKK in Slovakia in 2005, which means an inter-year increase by more than 23%. However, according to the qualified estimation, the real expenses on advertising in the media reached 7.2 billion SKK, which is by almost by 14% higher than in 2004. After considering the inflation, it means a rise of the advertising market by approximately 11%. The highest increase in expenses was in advertising in the
printing media (by 12.3%) and outdoor advertising (by 13.5%); the lowest was in radios (by 4.7%).
Expenses on all the communication activities in Slovakia in 2005, that is the real expenses on advertising in the media (TV, press, radio stations, outdoor, internet, cin-ema advertising) and expenses on BTL activities (public relations, sales & event marketing, direct marketing, sponsoring), reached 10.94 billion SKK (Table 1). In comparison with 2004, this means an increase by ap-proximately 1.3 billion SKK. In 2005, an increase in the value of 900 million SKK has been noted in the field of the real expenses on advertising in the media.
Media agencies as specialized institutions pro-viding a complex media service, business subjects such as advertising sponsors and different media means such as agents of the advertising messages
2001 2002 2003 2004 2005
bi
lli
on
. S
K
K
40 35 30 25 20 15 10 5 0
2001 2002 2003 2004 2005
11.41 12.60 16.77
23.891
29.44
bi
lli
on
S
K
K
[image:3.595.103.469.69.180.2]year
Figure 1. The volume of advertising in the media (in billion SKK) Source: Strategies 2006 + own processing
Table 1. Development of the advertising market in Slovakia in 2001–2005
Indicator 2001 2002 2003 2004 2005 Index of growth (%)
2005/2004 2005/2001 Volume of the media advertising
(billion SKK) 11.41 12.60 16.77 23.89 29.44 123.23 258.02
Real expenses on advertising in the
media(billion SKK) 4.25 4.53 5.09 6.35 7.22 113.70 169.88
Expenses on advertising (billion SKK) 6.44 6.86 7.72 9.62 10.94 113.72 169.88 Optimum expenses on advertising
(1% of GDP, billion SKK) 9.89 10.67 11.96 12.91 14.39 111.46 145.50
Increase of the advertising volume
in the media (%) 34.10 10.40 12.00 29.80 23.20 77.85 68.04
Increase of the expenses on
advertising (%) 10.20 6.50 12.50 24.60 13.70 55.69 134.31
Development of the GDP share and the
share of expenses on advertising (%) 0.65 0.64 0.65 0.75 0.76 101.33 116.92 Development of the GDP share and the share of
expenses on advertising in the media (%) 0.43 0.42 0.43 0.49 0.50 102.04 116.28
Increase of GDP (%) 3.30 4.10 4.00 5.50 6.00 109.09 181.82
[image:3.595.63.533.490.747.2]perform their activities in a certain economic-social environment. Therefore, in order to evaluate their influence, it is necessary to analyze the economic environment.
In 2005, the Slovak economy was on its highest level since 1998. The GDP increase in 2005 was on the level of 6%. While a higher rise in the economy in 1998 was caused mainly by the governmental expenses, the rise in 2005 was a result of higher export, domestic consumption and business invest-ments. More efficient economy, higher employment, higher incomes and loans brought more money to Slovak citizens. The money was registered in the sales of businessmen as well. The retail turnover increased by 9.7% in 2005, which was the highest increase during the past 6 years. The sales in retail with foodstuffs, pharmaceutical and cosmetic goods decreased.
The fact that the production and distribution mar-keting workers know the customers' behavior well is also approved by the opinion of the experts, who agree with the fact that in connection with the rising economy, the increase of the advertising market in 2006 is estimated on another 400–500 million SKK, which means an increase by 7–8% (Table 1).
VOLUME OF ADVERTISING IN THE SLOVAK MEDIA
It is obvious that information in the mass media significantly influences the public opinion. By the means of different forms of the media, every human has a chance to perceive different messages, either with a positive or a negative effect.
The volume of advertising in the media represents the extent of advertising expressed by the area or financial equivalent. The area equivalent expresses the extent of advertising in the area units or the length of
commer-cials in time units. This equivalent makes it possible to compare the volume of advertising abstractedly from the valid prices of the individual mass media. The financial equivalent expresses the financial evaluation of advertising counted on the basis of the valid price sheets of each media and all kinds of price reduction stated in this sheet. The volume of advertising in the media usually serves to qualified estimations of real expenses on advertising in the media. In practice, the financial equivalent of the advertising volume in the media is mostly used. This equivalent expresses the volume of expenses on advertising in the media on the basis of monitoring its advertising in combination with its valid price sheets. However, such statements do not reflect the agreed prices, special bonuses, or a different business strategy of each media. The volume of advertising in the media expressed by the means of the financial equivalent can highly exceed the real expenses on advertising, while this proportion differs in TV channels, radio stations, printing media and outdoor advertising.
The key inter-year increases of the real expenses on advertising in the media – TV channels by 200 million SKK, the biggest press publishers by 300 million SKK, outdoor advertising with an increase by almost 100 million SKK – mean that the advertising market was rising dynamically also in 2005.
[image:4.595.64.537.606.733.2]The TV is considered to be the main source of infor-mation. It is followed by the printed media, outdoor advertising and finally, the radio stations (Table 2). This is visible on the volume of invested financial means by different companies in this sequence: TV, printed media, outdoor advertising and radio stations. The price is stated according to the demand which is applied in advertising as well. The most expensive advertising is on TV followed by the printed media, outdoor advertising and radio stations. Lately, the benefits from the radio advertising have come into the center of attention of many companies.
Table 2. Development of the media mix in 2001–2005 (in %)
Media 2001 2002 2003 2004 2005 Index of growth (%)
2005/2004 2005/2001
TV 46.20 47.20 47.30 48.00 45.00 93.75 97.40
Press* 34.80 33.10 35.30 31.50 34.90 110.79 100.29
Out of home 8.20 9.70 9.90 10.70 10.70 100.00 130.49
Radio stations 10.40 9.90 7.50 8.40 7.70 91.67 74.04
Internet n n n 1.10 1.40 27.27 n
Advertising in cinemas n n n 0.30 0.30 100.00 n
AN OVERVIEW OF THE BIGGEST COMPANIES FROM THE ASPECT OF
VOLUME OF FINANCIAL MEANS INVESTED INTO ADVERTISING IN 2001–2005
In order to reach the goal, the efficiency and profit-ability of the media advertising, it is necessary for the advertising messages to be carried out in the right media, which are chosen by the sponsors considering their communication goals. The combination of vari-ous media seems to be the most efficient communica-tion of each company. The sponsors will provide the advertising message to be more efficiently accepted by the target groups and will provide a sort of return of the invested financial means.
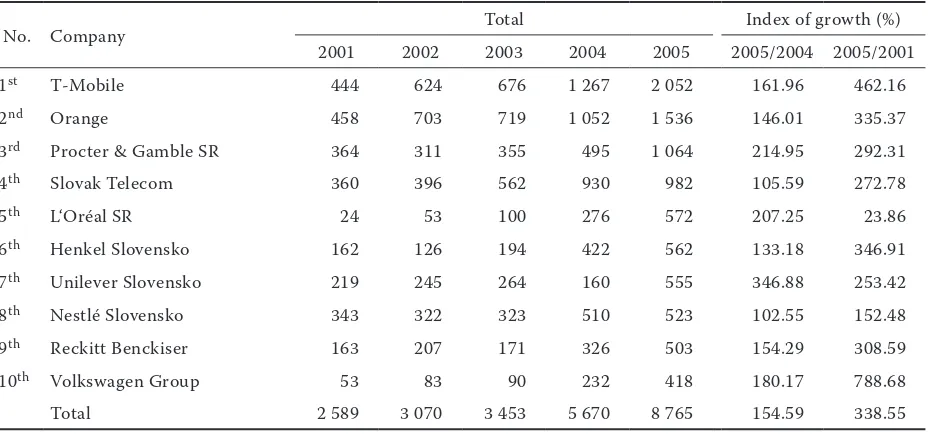
Table 3 gives the information about the 10 most important companies according to the volume of advertising in the Slovak media in 2001–2005. In the Top 10 chart, abstractedly from order, mainly the telecommunication companies T-mobile (EuroTel until May 2005) and Orange, Procter & Gamble and since 2001 also the Slovak Telecom could be found. All the ten companies spent the biggest volume of their financial means on TV commercials (7 907 mil. SKK), less on outdoor advertising (156 mil. SKK) and radio advertising (144 mil. SKK). The advertising in cinemas was used by 3 companies in the volume of 10 mil. SKK. One of the TOP 10 companies – Reckit Benckisser – used only commercials. In comparison with 2004, the TOP 10 producers spent by 50% more financial means on investments into advertising in 2005.
In comparison with 2004, T-Mobile increased the volume of financial means invested into advertising by 785 mil. SKK in 2005 which secured the company No.1 position above Orange, which was the leader in 2001–2003. Slovak Telecom spent a significant volume of financial means on promotion of its products and services in 2005. The decision to significantly affect the potential customers provided the company the 3rd place in the TOP 10 chart in 2003 and the 4th place in 2005.
The representation of the food companies in evalu-ation of the 10 biggest investors into advertising was only reached by Nestle Slovakia in 2005. With the total volume of 523 mil. SKK, it reached the 8th place which is a decrease by 4 positions in comparison with 2004. Another food company, Heineken Slovakia, with the total volume of the invested financial means into advertising in the value of 112 mil. SKK, did not get into the TOP 10 chart despite the fact that during 2001–2004 it had a stable position in this chart. It fell from the 4th position in 2004 to the 35th position in 2005. A better placement was noted by the follow-ing companies: Wrigley’s, Opavia – LU, Coca-Cola, Danone, Ferrero, Kraft Foods Slovakia a Kofola.
THE ANALYSIS OF THE FOOD ADVERTISING MARKET
[image:5.595.68.533.530.747.2]In 2005, according to the total sales, 12 companies from the food industry were placed into the TOP 200 chart of the biggest non-financial companies of
Table 3. Top 10 companies according to the advertising volume in the Slovak media (in mil. SKK) in 2001–2005
No. Company Total Index of growth (%)
2001 2002 2003 2004 2005 2005/2004 2005/2001
1st T-Mobile 444 624 676 1 267 2 052 161.96 462.16
2nd Orange 458 703 719 1 052 1 536 146.01 335.37
3rd Procter & Gamble SR 364 311 355 495 1 064 214.95 292.31
4th Slovak Telecom 360 396 562 930 982 105.59 272.78
5th L‘Oréal SR 24 53 100 276 572 207.25 23.86
6th Henkel Slovensko 162 126 194 422 562 133.18 346.91
7th Unilever Slovensko 219 245 264 160 555 346.88 253.42
8th Nestlé Slovensko 343 322 323 510 523 102.55 152.48
9th Reckitt Benckiser 163 207 171 326 503 154.29 308.59
10th Volkswagen Group 53 83 90 232 418 180.17 788.68
Total 2 589 3 070 3 453 5 670 8 765 154.59 338.55
Slovakia. Heineken Slovakia, a.s. Nitra took the 48th place, Nestlé Slovakia, s.r.o. Prievidza took the 50th place, 51st place was taken by Kraft Foods Slovakia, a.s. Bratislava, 64th place by Rajo, a.s., Bratislava, 67th place belonged to Palma-Tumys, a.s., Bratislava, 70th place to Tauris, a.s., Rimavská Sobota. Other 6 food companies took the 88th–145th positions.
The evaluation criteria were: sales volume, added value, net profit margin and the average number of workers. The sales volume was of the biggest value. The share of the advertising expenses in sales of the TOP 5 non-financial companies in mil.SK in the years 2001 and 2002 is shown in Table 4.
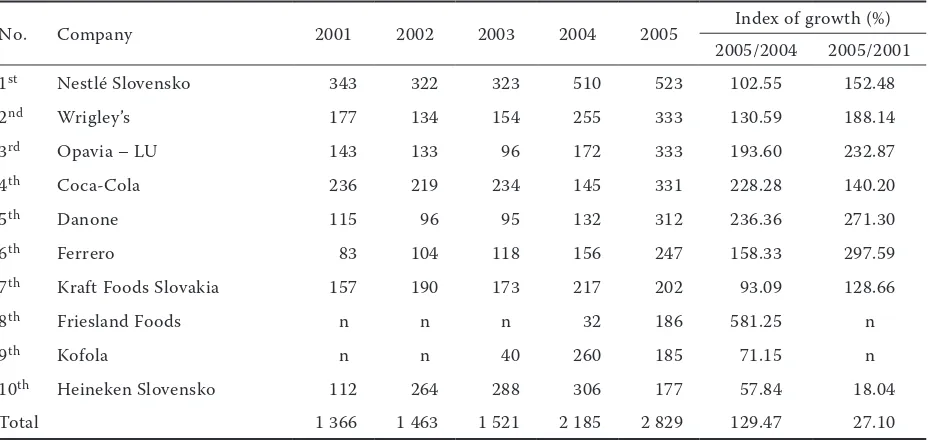
In 2001–2005, only Nestlé Slovakia recorded a rising trend in expenses on advertising in compari-son with sales (12% in 2005). In the last 5 years, it has maintained its leading position in advertising volume in the media with more than 2 billion SKK. Companies Wrigley’s, Opavia – LU, Coca-Cola and Danone belong to the first 5 companies with the greatest volume of financial means spent on ad-vertising (Table 5), but none of them is in the chart of the 5 non-financial companies according to the total sales.
[image:6.595.64.533.279.750.2]About the best placed product category “FOOD” in the TOP 10 product categories according to the
Table 4. Share of the advertising expenses in sales of the TOP 5 non-financial companies (in mil. SKK) in 2001 and 2002
Company
Total sales (mil. SKK)
Expenses on advertising (mil. SKK)
Expenses on advertising/
sales (%)
Total sales (mil. SKK)
Expenses on advertising
(mil. SKK)
Expenses on advertising/
sales (%)
2001 2002
Heineken Slovensko 4.018 112 3 4.662 264 6
Nestlé Slovensko 4.057 343 8 4.412 322 7
Kraft Foods Slovakia 3.068 157 5 3.593 190 5
Rajo – 25 – – 50 –
Palma-Tumys 3.336 137 4 3.816 167 4
2003 2004
Heineken Slovensko 5.396 288 5 4.387 306 7
Nestlé Slovensko 4.721 323 7 4.533 510 11
Kraft Foods Slovakia 3.683 173 5 4 354 217 5
Rajo – 41 – 3.169 81 3
Palma-Tumys 4.159 167 4 3.619 139 4
2005
Heineken Slovensko 4.815 177 4
Nestlé Slovensko 4.537 523 12
Kraft Foods Slovakia 4.494 202 4
Rajo 3.603 138 4
Palma-Tumys 3.453 86 2
Company
Index of growth (%)
total sales (mil. SKK) expenses on advertising (mil. SKK) advertising/sales (%)expenses on 2005/2004 2005/2001 2005/2004 2005/2001 2005/2004 2005/2001
Heineken Slovensko 109.76 119.84 57.84 158.04 57.14 133.35
Nestlé Slovensko 100.09 111.83 102.55 152.48 100.09 150.00
Kraft Foods Slovakia 103.22 146.48 93.9 128.66 80.00 93.09
Rajo 113.70 – 170.7 55.00 133.33 –
Palma-Tumys 95.41 103.51 61.87 62.77 50.00 50.00
advertising volume in the media; we can say that the invested financial means grow every year – in the inter-year comparison – in 2003 by 0.31% in 2004 by 57.89% and in 2005 by 2.55%.
As a result of increasing the invested financial means on advertising during the monitored years, Nestle Foods achieved the 1st place. In 2005, it spent on advertising by 190 mil. SKK (57.06%) more than Wrigley’s and Opavia-LU, which gained the 2nd and 3rd position in the TOP 10 chart, respectively.
The Coca-Cola company took the 2nd position in 2000–2001. In 2002, it fell to the 3rd position, which
has not changed despite the increased volume of expenses on advertising in 2003. Lower expenses on advertising in 2004 in comparison to 2003 (decrease by 64%) moved the company down to the 8th posi-tion in the TOP 10 among of the food companies. In 2005, by the means of the increased volume of the financial means into advertising (by 186 mil. SKK), the company moved up to the 4th position.
[image:7.595.68.533.84.304.2]As a result of reducing the financial means on ad-vertising in 2005, Figaro in Bratislava, renamed to Kraft Foods Slovakia in 2001, moved down to the 8th position in 2005.
Table 5. Top 10 food producers according to the advertising volume in the media (in mil. SKK) in 2001–2005
No. Company 2001 2002 2003 2004 2005 Index of growth (%)
2005/2004 2005/2001
1st Nestlé Slovensko 343 322 323 510 523 102.55 152.48
2nd Wrigley’s 177 134 154 255 333 130.59 188.14
3rd Opavia – LU 143 133 96 172 333 193.60 232.87
4th Coca-Cola 236 219 234 145 331 228.28 140.20
5th Danone 115 96 95 132 312 236.36 271.30
6th Ferrero 83 104 118 156 247 158.33 297.59
7th Kraft Foods Slovakia 157 190 173 217 202 93.09 128.66
8th Friesland Foods n n n 32 186 581.25 n
9th Kofola n n 40 260 185 71.15 n
10th Heineken Slovensko 112 264 288 306 177 57.84 18.04
Total 1 366 1 463 1 521 2 185 2 829 129.47 27.10
Source: www.etrend.sk + own processing
2 500 2 000 1 500 1 000 500 0 0 company mil. SKK N es tlé S lo ve ns ko C oc a-C ol a H ei ne ke n Sl ov en sk o W ri gl ey ’s K ra ft F oo ds S lo va ki a O pa vi a – LU D an on e Fe rr er o K of ol a Fr ie sl an d Fo od s m ill io n SK K company
[image:7.595.78.504.529.729.2]The higher total volume of financial means spent on advertising in 2004 helped the Heineken Company to move up from the 8th position in 2002 to the 2nd position in both 2003 and 2004. In 2001–2005, Nestle Slovakia spent the highest volume of financial means on advertising. Friesland Foods and Kofola spent the lowest amount but it is necessary to say that none of these companies operated on the Slovak market during the analyzed period.
The biggest advertising sponsors from the food companies in the SR are listed in Figure 2.
Table 6 shows on the biggest clients from the food industry of the advertising agencies in SR.
It is hard to miss the coherence between the sales of the food companies, their expenses on advertising in 2001–2005 and the sales of the advertising agencies.
Creativity and quality of the Slovak advertising creators for food companies were evaluated posi-tively. The Mayer/McCann Erickson company was awarded the Golden Nail for the campaign “Zlatý bažant” – The waiters' run for the Heineken company in the contest of the most creative Slovak commercial Golden Nail 2006 and Silver Drum award in the in-ternational contest in creativity Golden Drum 2005 in Portorose.
CONCLUSIONS
The fact that production and distribution mar-keting workers know the customers´ behavior well is also approved by the opinion of the experts who agree with the fact that the advertising market can
increase by another 7–8% which can bring another 400–500 million SKK into the advertising business. The increase of advertising expenses in 2005 in com-parison with 2004 slowed down. The 11-percent rise in 2005 refers to a strong rise of TV, printed media and of course, the outdoors.
The engine of the communication evolution in the field of advertisement is the need of permanent innovation.
REFERENCES
Bielik P. et al. (2001): Podnikovo-hospodárska teória agrokomplexu (Business-eonomic theory of the agrifood complex). 1st Edition, SPU, Nitra; ISBN 80-7137-861-5.
De Pelsmacker P., Geuens M., Van den Bergh J. (2003): Marketingová komunikace (Marketing communica-tion). Grada Publishing, a.s., Praha,: pp. 203, 301, 357, 388, 463; ISBN 80-247-0254-1.
Horská E. (2000): Vybrané kapitoly medzinárodného marketingu (Chosen chapters from the interna-tional marketing). 1st Edition, SPU, Nitra; ISBN 80-7137-701-5.
Kotler P., Armstrong G.(2004): Marketing. Grada Publishing, Praha; ISBN 80-247-0513-3.
Kretter A. et al. (2007): Marketing. SPU, Nitra; ISBN 978-80-8069-849-2.
Nagyová Ľ. (1999): Sociálna komunikácia (Social com-munication). SPU, Nira; ISBN 80-7137-636-1. Šimo D. (2006): Agrárny marketing (Agrarian
[image:8.595.63.532.82.290.2]market-ing). SPU, Nitra; ISBN 80-8069-726-4. Table 6. The biggest clients (food companies) of the advertising agencies in the SR in 2001–2005
Agency The biggest food companies clients
CD Ogilvy & Mather Heineken Slovensko (Kelt, Heineken, Gemer), Trenčín Mineral Waters Creo/Young& Rubicam Danone, Hubert, Podravka
Istropolitana D‘Arcy Syráreň Bel Slovensko (Karička, Syrokrém, Kiri, Veselá krava, Mini Babybel) JandL, marketing and advertising Podravka International, Pivovar Šariš
Mayer/McCann-Erickson Coca-Cola ČR a SR, Friesland Slovensko, Heineken Slovensko (Corgoň, Martiner, Zlatý Bažant) MUW / Saatchi & Saatchi Rajo, SAB (Velkopopovický Kozel, Šariš)
Soria & Grey Pivovar Šariš Vaculik Advertising Nestlé/Carpathia
VYV Advertising Agency Julius Meinl, Palma Tumys
Wiktor Leo Burnett Slovak Wells and Springs (Budiš, Budiš Light, Fatra), St.Nicolaus Trade (Vodka St. Nicolaus, Demänovka)
Vysekalová J. (2004): Psychologie spotřebitele. Jak zákazníci nakupují (Consumer psychology. How the customers buy). Grada Publishing, Praha; ISBN 80-247-0393-9.
Vysekalová J., Komárková R. (2002): Psychologie reklamy (Psychology of advertising). Grada Pub-lishing, Praha; ISBN 80-247-0402-1.
Vysekalová J., Mikeš J. (2003): Reklama – Jak dělat reklamu (Advertisement. How to advertise). Praha: Grada Publishing, Praha; ISBN 80-247-0557-5.
Stratégie (2000–2006).Sanoma Magazines Slovakia, Bratislava; ISSN 1335-2016.
Trend (2000–2006). Trend Holding, Bratislava; ISSN 1335-0684.
www.etrend.sk
Arrived on 6th June 2007
Contact address:
Ľudmila Nagyová, Mária Kročanová, Ľudmila Maďarová, Slovak University of Agriculture in Nitra, Tr. A. Hlinku 2, 949 01 Nitra, Slovak Republic