Food demand having a long history is very important in the economic research. There has been a focus on the availability of food since Malthus (1798) whose particular concern was that the population growth would ultimately create demands for an exceeding food supply. About 309 million of around 850 million world malnourished people live in India, Pakistan and Bangladesh according to the State of Food Insecurity in the World (SOFI 2011). So these countries are much concerned regarding the problem of food.
Low domestic production and incapacity to buy in the international currencies on the world markets are important causes of the insufficient food consumption in developing countries but mainly the lack of access is due to the low income compared to food prices (World Bank 1981). Therefore, the effect of income and price on the demand for food in the developing countries has been the focus of many studies to explore the further causes of the problem; e.g. Mellor (1983), Behrman and Deolalikar (1987), Alderman (1988). So in this following part of the study, the effect of price and income (expenditure) on the consumption of different animal products is calculated and the different relations between products (substitutes or complements) are presented.
In this paper, the objective is to analyze the animal products consumption pattern and its reaction to the expenditures and prices changes in Pakistan, India and Bangladesh. In these three countries, having same colonial past, a growing place of animal products can be observed in diets, but the levels consumed for the total meat remained very low compared to the world mean (FAO). The FAOSTAT tells about the sources of these countries for the protein and calorie intake. Pakistan is the largest consumer of animal products for the protein intake among the three with 23.5 gram/capita/day (40% of the total proteins). India and Bangladesh are behind with 10.2 gram and 7.8 gram, respectively (18% and 15% of the total proteins respectively). For calories, the pattern is the same with Pakistan consuming 468 kcal/capita of animal products per day (20% of the total calories). India and Bangladesh are consuming 197 kcal/capita (8% of the total calories) and 83 kcal/capita (9% of the total calories) respectively. It shows the animal products consumption share in every country’s diet pattern. This kind of results is necessary to calculate the future demand of animal products to attain food security in these countries. This study is an effort with focus on the demand parameters estimation of
C omparative analysis of the animal products
consumption in developing countries: the case study
of the South Asian countries
Muhammad Rizwan YASEEN, Imran QAISER, Nabeela KOUSAR
Government College University, Faisalabad, Pakistan
Abstract: Being the most populous countries of South Asia, Pakistan, India and Bangladesh represent about 37% of the world total undernourished population. In these three countries, the growing place of animal products can be observed in the diets, but the levels consumed for animal products remained very low as compared to the world mean. Th e consumpti-on behaviour of animal products for three countries is presented in the study. Expenditure elasticities, own and cross com-pensated as well as non-comcom-pensated price elasticities of main animal products of these countries are calculated by using a LA/AIDS model applied to yearly data. Milk is income as well as price elastic in Pakistan while all other animal products in all three countries are relatively price inelastic. On the other hand, chicken and eggs are relatively income elastic. Th e re-sults are compared with other authors in detail. Th e impact of some government policies to improve the protein and calorie intake by the actions on income and prices for the most vulnerable consumers (low income group) in these countries is also evaluated for Pakistan.
doi: 10.17221/138/2014-AGRICECON
the main animal products towards this direction. The calculation of the animal products demand elasticities aids to forecast their future demand under different scenarios of prices and income and may be worthy for the policy planners on important policy decisions.
METHODOLOGY
The LA/AIDS approach
The Almost Ideal Demand System (AIDS) having considerable advantages over all other models was developed by Deaton et al. (1980a, b). Th e linear ap-proximation version of the AIDS model called LA/AIDS Alderman (1988) is used in this paper. This model is based on a following particular form of the cost function (Holt and Goodwin 2009):
ܥሺǡ ܷሻ ൌ ሺͳ െ ܷሻ ܽሺሻ ܷܾሺሻ (1)
while p is the vector of prices of the n products and U denotes the utility index. The value of this index is between 0 (subsistence) and 1 (bliss).
There the expenditure share is:
ݏൌ ߙ ɀ
ୀଵ
Ⱦܯ
ܲ
where i, j = 1, 2, …, n (2)
where pi and xi are the price and consumption of ith good, respectively, while M is the total spending of the n goods.
The price index P is defined by
ܲ ൌ Ƚ Ƚ
ୀଵ
ͳ
ʹ ɀ
ୀଵ
ୀଵ
(3)
with
ɀൌ
ͳ
ʹ൫ɀ
כ ɀ
כ൯ (4)
Linear homogeneity of the cost function, the sym-metry of the second-order derivatives, and adding up across the share equations implies the following set of restrictions:
Ƚ
ୀଵ
ൌ ͳǡ ɀ
ୀଵ
ൌ ɀ
ୀଵ
ൌ Ͳǡ Ⱦ
ୀଵ ൌ Ͳǡ
ɀൌ ߛ (5)
In the LA version of AIDS, the price index is ap-proximated by the linear function:
ܲ ൌ σ ୧ൈ (6)
and the elasticities are calculated by the following expressions:
For the Marshallian (or uncompensated) elasticity of product i consumption relative to price of product j.
ܯܽݎݏ݄݈݈݈ܽ݅ܽ݊݁ܽܿݐ݅ܿ݅ݐݕ ൌ ܧெൌ െɁ ɀ
ݏ െ Ⱦ ݏ ݏ (7)
where δij is the Kronecker delta term (that is 1 when i = j or 0 when i ≠ j
For the expenditure (income) elasticity of product i consumption
ൌܧோൌ ͳ
ஒ
௦ (8)
For the Hicksian (or compensated) price elasticities
ܧுൌ ܧெ ܧோݏ (9)
For Allen substitution elasticities1
ܣൌ ܧȀܵ (10)
INTERPRETATION AND USES OF THE LAGGED VARIABLES
In general, the changes in price or income do not influence the food market immediately and completely in the year in which they took place. In fact the impact on consumption of each product is felt over several periods and depends on the situation during the previous period. To model this, we introduced the lagged value of the share of expenditure in the second member of the various expenditure share equations. For example a simplified equation is:
ݏሺݐሻ ൌ ݃ ܽݏሺݐ െ ͳሻ ܿൈ ሺݐሻ
݀ൈ ܯሺݐሻ ܲሺݐሻΤ (11)
The parameter ai measures the importance of the “memory” effect. In term of variation between year t and year t – 1, one can write:
οݏሺݐሻ ൌ ܽൈ οܵሺݐ െ ͳሻ ܿൈ ο ሺݐሻ
݀ൈ ο ܯሺݐሻ
ܲሺݐሻ (12)
1Allen elasticity measures substitution level between two products. More precisely its value represents percentage
That can be written as:
ο୧ሺሻ ൌ ୧୬οܵሺݐ െ ݊ሻ ܿൈ ሺͳ െ ܽሻ ሺͳ െ ܽΤ ሻ ൈ ݔ (13)
when for n periods: Δlnpi(t) = x is constant and real income is constant: M(t)/P(t) = constant
If ai is inferior to 1 (and very small), then the term ܽ become negligible and the variation of expendi-ture share is equal to ci × x (expression without the lagged variable) multiplied by a specific coefficient
݇ൌ ሺͳ െ ܽሻȀሺͳ െ ܽሻ ൎ ͳȀሺͳ െ ܽሻ that permits to
pass from short term elasticity ESTto the long term
elasticity ELT.
Generally (for the Hicksian, Marshallian and income elasticity), one can write:
ܧ்ൌ ݇
ܧௌ் (14)
In the “normal case” (|ai| < 1), the long-run elas-ticities have the same sign as the short-term elastici-ties and are greater in the absolute value when ai is positive. The data (consumption and price) used in LA/AIDS model for the three countries are taken from the FAOSTAT database2 from 1991 to 2009. Regarding the food taken into account, we selected six products3 (eggs, milk, bovine meat, chicken meat, goat/sheep meat and other meat).The LA/AIDS model estimated a system of five (or four) equations with six (or five) products for each country by the FIML (Full Information Maximum Likelihood) method. It is conventional to introduce some “dummy variables” that are intended to counteract problems due to the possible economic conjectural events unrelated to the changes in prices and incomes (outliers).
ANALYSIS OF MAIN RESULTS FOR DEMAND OF ANIMAL PRODUCTS
Different results of the estimations for demand of animal products for the three counties are indicated in Tables 1 to 6.
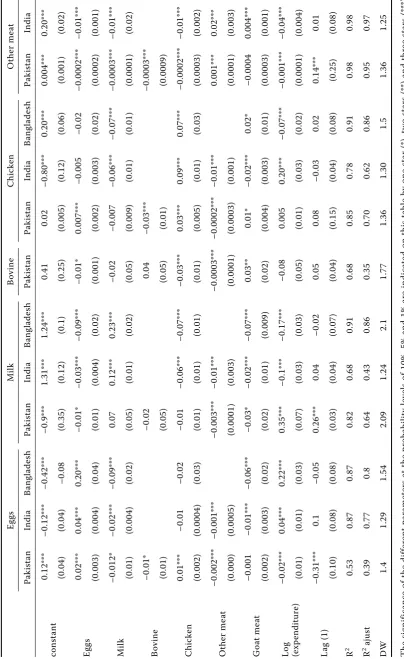
The coefficients of the five (or four) equations of the AIDS system for Pakistan, India and Bangladesh respectively are represented in Table 1. The R2 value for
eggs of Pakistan is the weakest among the three coun-tries, while R2 values for all other products of three countries are more than 0.60. The R2 adjusted values represent the same trend as R 2 values. Concerning the Durbin-Watson, values are generally near to 2. So we can consider that the forms of equations with a lagged variable control the autocorrelations. For the coefficients of the own price value in the equation of many animal products (in fact of each si which is the part of total expenditure due to this product), the sign is mostly negative. Many coefficients corresponding to cross effects are also significant.
Table 2 represents the Hicksian (compensated) short term elasticities for six animal products (eggs, milk, bovine meat, chicken meat, goat/sheep meat and other meat) of India, Pakistan and Bangladesh respectively. For eggs and milk, Pakistan has the largest absolute values showing the greater effect of the price change on its consumption followed by India and Bangladesh. So, one unit increase of the price of eggs and milk reduces their consumption considerably more in Pakistan as compared to other countries. In Pakistan and India, the poultry sector has been evolved very quickly as a result of the grow-ing production and the consumption is increased due to the increased supply instead of price changes, so the elasticities are positive for these products. All values (< 1) show that all other products are relatively inelastic in the short run.
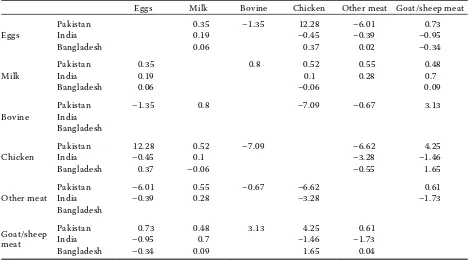
From the Hicksian elasticities matrix, it is possible to calculate the Allen substitution matrix which is a symmetric matrix and indicates the intensity of relations between two products. When the sign is negative, the products are complements and vice versa. When two products are complement, then the price decrease of one product increases the other product consumption. A substitute good, in contrast to a complementary one, is a good with a positive cross-elasticity of demand. The matrix of the Allen substitution elasticities for different products is pre-sented in Table 3.
Table 4 is used to present the relations between different animal products. Milk and eggs are sub-stitute products for all three countries. Bovine meat is the complement of all products except milk for
2The producer prices given by FAOSTAT are used as proxy for consumer prices.
3Though fish and aquatic products are very important in these three countries, it was not possible to take in account
doi: 10.17221/138/2014-AGRICECON
[image:4.595.80.485.99.759.2]T
able 1. Co
ef fi cien ts of e q ua
tions of t
he animal pr
o duc t demand Egg s Milk B o v ine Chicken O ther me at Pak ist an India B anglade sh Pak ist an India B anglade sh Pak ist an Pak ist an India B anglade sh Pak ist an India const an t 0.12*** –0.12*** –0.42*** –0.9*** 1.31*** 1.24*** 0.41 0.02 –0.80*** 0.20*** 0.004*** 0.20*** (0.04) (0.04) –0.08 (0.35) (0.12) (0.1) (0.25) (0.005) (0.12) (0.06) (0.001) (0.02) Egg s 0.02*** 0.04*** 0.20*** –0.01* –0.03*** –0.09*** –0.01* 0.007*** –0.005 –0.02 –0.0002*** –0.01*** (0.003) (0.004) (0.04) (0.01) (0.004) (0.02) (0.001) (0.002) (0.003) (0.02) (0.0002) (0.001) Milk –0.012* –0.02*** –0.09*** 0.07 0.12*** 0.23*** –0.02 –0.007 –0.06*** –0.07*** –0.0003*** –0.01*** (0.01) (0.004) (0.02) (0.05) (0.01) (0.02) (0.05) (0.009) (0.01) (0.01) (0.0001) (0.02) B o v ine –0.01* –0.02 0.04 –0.03*** –0.0003*** (0.01) (0.05) (0.05) (0.01) (0.0009) C hicken 0.01*** –0.01 –0.02 –0.01 –0.06*** –0.07*** –0.03*** 0.03*** 0.09*** 0.07*** –0.0002*** –0.01*** (0.002) (0.0004) (0.03) (0.01) (0.01) (0.01) (0.01) (0.005) (0.01) (0.03) (0.0003) (0.002) O ther me at –0.002*** –0.001*** –0.003*** –0.01*** –0.0003*** –0.0002*** –0.01*** 0.001*** 0.02*** (0.000) (0.0005) (0.0001) (0.003) (0.0001) (0.0003) (0.001) (0.0001) (0.003) G o at m e at –0.001 –0.01*** –0.06*** –0.03* –0.02*** –0.07*** 0.03** 0.01* –0.02*** 0.02* –0.0004 0.004*** (0.002) (0.003) (0.02) (0.02) (0.01) (0.009) (0.02) (0.004) (0.003) (0.01) (0.0003) (0.001)
Log (ex
p endit ur e) –0.02*** 0.04*** 0.22*** 0.35*** –0.1*** –0.17*** –0.08 0.005 0.20*** –0.07*** –0.001*** –0.04*** (0.01) (0.01) (0.03) (0.07) (0.03) (0.03) (0.05) (0.01) (0.03) (0.02) (0.0001) (0.004) L ag (1) –0.31*** 0.1 –0.05 0.26*** 0.04 –0.02 0.05 0.08 –0.03 0.02 0.14*** 0.01 (0.10) (0.08) (0.08) (0.03) (0.04) (0.07) (0.04) (0.15) (0.04) (0.08) (0.25) (0.08) R 2 0.53 0.87 0.87 0.82 0.68 0.91 0.68 0.85 0.78 0.91 0.98 0.98 R
2 a
just 0.39 0.77 0.8 0.64 0.43 0.86 0.35 0.70 0.62 0.86 0.95 0.97 DW 1.4 1.29 1.54 2.09 1.24 2.1 1.77 1.36 1.30 1.5 1.36 1.25 T he sig nif ic anc
e of t
he dif fe re n t p arame ters a t t he pr ob ability le ve
ls of 10%, 5% and 1% ar
e indic at e d on t h is t
able by one st
a
r (*), two st
ars (**) and t
Pakistan. Chicken meat is the complement of all other meat products for all three countries. The common relations are eggs-milk (S), goat meat-milk (S), goat meat-eggs (C), other meat-milk (S), other
meats-eggs (C), other meats-milk (S) and other meat-chicken (C).
[image:5.595.63.532.112.374.2]The long- term Hicksian demand elasticities of three countries are represented by Table 5. These elasticities Table 2. Hicksian short-term elasticities for the animal products
Eggs Milk Bovine Chicken Other meat Goat/sheep meat
Eggs
Pakistan –0.37 0.24 –0.23 0.3 –0.01 0.06 India –0.03 0.15 –0.04 –0.01 –0.08 Bangladesh –0.02 0.03 0.06 –0.07
Milk
Pakistan 0.01 –0.2 0.14 0.01 0.00 0.04 India 0.01 –0.08 0.01 0.01 0.06 Bangladesh 0.01 –0.02 –0.01 0.02
Bovine
Pakistan –0.04 0.55 –0.62 –0.17 0.00 0.28
India
Bangladesh
Chicken
Pakistan 0.34 0.36 –1.22 0.15 –0.01 0.38 India –0.02 0.08 0.13 –0.07 –0.12 Bangladesh 0.08 –0.02 –0.38 0.32
Other meat
Pakistan –0.17 0.38 –0.11 –0.16 0.01 0.05 India –0.02 0.21 –0.27 0.22 –0.14
Bangladesh
Goat/sheep meat
Pakistan 0.02 0.33 0.54 0.1 0.00 –0.99 India –0.05 0.53 –0.12 –0.04 –0.33 Bangladesh –0.07 0.04 0.26 –0.22 .Source: Own calculation
Table 3. Allen short-term substitution elasticities
Eggs Milk Bovine Chicken Other meat Goat/sheep meat
Eggs
Pakistan 0.35 –1.35 12.28 –6.01 0.73
India 0.19 –0.45 –0.39 –0.95
Bangladesh 0.06 0.37 0.02 –0.34
Milk
Pakistan 0.35 0.8 0.52 0.55 0.48
India 0.19 0.1 0.28 0.7
Bangladesh 0.06 –0.06 0.09
Bovine
Pakistan –1.35 0.8 –7.09 –0.67 3.13
India
Bangladesh
Chicken
Pakistan 12.28 0.52 –7.09 –6.62 4.25
India –0.45 0.1 –3.28 –1.46
Bangladesh 0.37 –0.06 –0.55 1.65
Other meat
Pakistan –6.01 0.55 –0.67 –6.62 0.61
India –0.39 0.28 –3.28 –1.73
Bangladesh
Goat/sheep meat
[image:5.595.62.530.481.742.2]doi: 10.17221/138/2014-AGRICECON
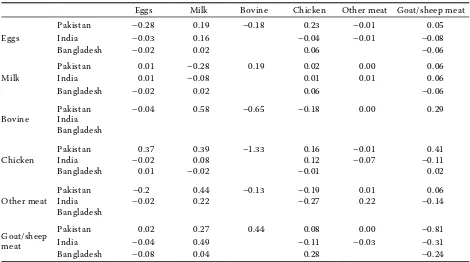
strictly follow the pattern of the Hicksian short-term elasticities. The difference between signs for poultry meat of all three countries may be explained by the
[image:6.595.64.533.113.369.2]change of the dietary pattern toward poultry in the long run independent on price. In Pakistan and India, the poultry sector has been evolved very quickly as a Table 4. Matrix of the substitution and complimentary relationship
Eggs Milk Bovine Chicken Other meat Goat/sheep meat
Eggs
Pakistan S C S C S
India S C C C
Bangladesh S S S C
Milk
Pakistan S S S S S
India S S S S
Bangladesh S C S
Bovine
Pakistan C S C C S
India
Bangladesh
Chicken
Pakistan S S C C S
India C S C C
Bangladesh S C C S
Other meat
Pakistan C S C C S
India C S C C
Bangladesh
Goat/sheep meat
Pakistan C S S S S
India C S C C
Bangladesh C S S S
C for complementary and S for substitution relationship Source: Own calculation
Table 5. Hicksian long-term elasticities
Eggs Milk Bovine Chicken Other meat Goat/sheep meat
Eggs
Pakistan –0.28 0.19 –0.18 0.23 –0.01 0.05 India –0.03 0.16 –0.04 –0.01 –0.08 Bangladesh –0.02 0.02 0.06 –0.06
Milk
Pakistan 0.01 –0.28 0.19 0.02 0.00 0.06 India 0.01 –0.08 0.01 0.01 0.06 Bangladesh –0.02 0.02 0.06 –0.06
Bovine
Pakistan –0.04 0.58 –0.65 –0.18 0.00 0.29
India
Bangladesh
Chicken
Pakistan 0.37 0.39 –1.33 0.16 –0.01 0.41 India –0.02 0.08 0.12 –0.07 –0.11 Bangladesh 0.01 –0.02 –0.01 0.02
Other meat
Pakistan –0.2 0.44 –0.13 –0.19 0.01 0.06 India –0.02 0.22 –0.27 0.22 –0.14
Bangladesh
Goat/sheep meat
[image:6.595.64.534.479.741.2]result of the growing demand and consumption. All values are less than one making all animal products relatively inelastic even in the long run, too.
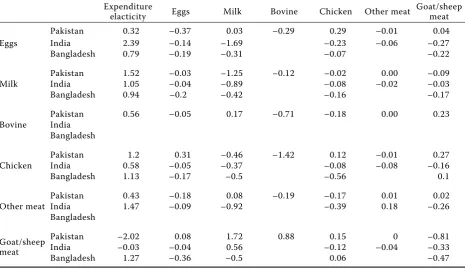
The expenditure elasticities are indicated in Table 6. They are generally positive (normal goods) except for the goat/sheep meat of Pakistan and India. Eggs, other meat and milk are superior goods in India (> 1) while milk and chicken are also superior goods (> 1) in Pakistan. That means when the income (more pre-cisely the expenditure on animal products) increases, the Indian consumer buys more eggs, chicken, other meat and milk among all animal products. Likewise, the chicken and goat meat are superior products in Bangladesh. One surprising result is the fact that the goat/sheep meat is “inferior good” in Pakistan and India. This can be explained by the fact that in these countries, the poultry meat is preferred to the cattle/ sheep meat due to the difference of price, so when the income increased, people used more other animal products. This could also be explained for Pakistan by the fact that the goat/sheep meat consumption is more tied to religious reasons than to prices
The Marshallian price elasticities for six (or five) products (eggs, milk, bovine meat, poultry meat, other meat and goat/sheep meat) of Pakistan, India and Bangladesh, respectively, are presented in Table 6. Like the Hicksian ones, these elasticities have not
been calculated for a specific year but for the mean values for the period 1991–2008. The values of the expenditure shares si and sj appearing in the share and the elasticities equations have been replaced by their mean of the time period.
Milk is price elastic in Pakistan (> 1) while all other animal products in all three countries are relatively price-inelastic (< 1). That means that when the price of milk increases by one percentage point, then the Pakistani consumer decreases its consumption by 1.25%. For other products in all three countries, the consumption of other products decreases by less than one percent as a result of the increase of its price by one percent.
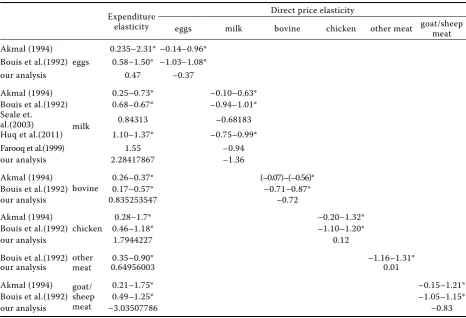
It is important to compare our results with other authors for each country even if we can expect an important difference due to the important differences in methodology and data for different time period for each country.
[image:7.595.64.530.115.383.2]The comparison of our results with the result of other authors who took animal products for these countries is represented in Table 7. These authors used the household income and expenditure survey. Haq et al.(2011) used the LA/AIDS model for the household data for rural and urban Punjab while all other authors used extended the linear and food characteristics demand system. So the present study Table 6. Marshallian short-term elasticities
Expenditure
elacticity Eggs Milk Bovine Chicken Other meat
Goat/sheep meat
Eggs
Pakistan 0.32 –0.37 0.03 –0.29 0.29 –0.01 0.04 India 2.39 –0.14 –1.69 –0.23 –0.06 –0.27 Bangladesh 0.79 –0.19 –0.31 –0.07 –0.22
Milk
Pakistan 1.52 –0.03 –1.25 –0.12 –0.02 0.00 –0.09 India 1.05 –0.04 –0.89 –0.08 –0.02 –0.03 Bangladesh 0.94 –0.2 –0.42 –0.16 –0.17
Bovine
Pakistan 0.56 –0.05 0.17 –0.71 –0.18 0.00 0.23
India
Bangladesh
Chicken
Pakistan 1.2 0.31 –0.46 –1.42 0.12 –0.01 0.27 India 0.58 –0.05 –0.37 –0.08 –0.08 –0.16 Bangladesh 1.13 –0.17 –0.5 –0.56 0.1
Other meat
Pakistan 0.43 –0.18 0.08 –0.19 –0.17 0.01 0.02 India 1.47 –0.09 –0.92 –0.39 0.18 –0.26
Bangladesh
Goat/sheep meat
doi: 10.17221/138/2014-AGRICECON
took data for 19 years and used the LA/AIDS ap-proach by taking only animal products. For Pakistan, our expenditure elasticities are positive like in other
[image:8.595.64.531.111.429.2]authors (Bouis 1992; Akmal 1994; Farooq et al.1999; Seale et al. 2003; Haq et al. 2011), but our values are higher for other livestock products. That shows the
Table 8. Table of comparison with other authors for India (Marshallian short-term elasticities)
Expenditure elasticity
Direct price elasticity
eggs milk chicken other meat goat meat Dastagiri (2004) eggs 1.56 –1.8–2.85
our analysis 3.36 –0.082
Dastagiri (2004)
milk
1.50 –2.8–2.9*
Mittal (2006) 1.19 –0.78
Kumar et al.(2011) 0.043 –0.62
our analysis 1.48 –0.451
Dastagiri (2004) chicken 1.16 –0.32–0.43*
our analysis 0.81 0.11
Dastagiri (2004) other meat 0.32 –0.50–3.17*
our analysis 2.06 0.20
Dastagiri (2004) goat meat 2.26 –0.030–3.3*
our analysis –0.039 –0.33
*shows values for range for different income groups
[image:8.595.63.530.531.727.2]Source: Own calculation, Mittal (2006), Kumar et al. (2011), Dastagiri (2004).
Table 7. Table of comparison with other authors for Pakistan (Marshallian short-term elasticities)
Expenditure elasticity
Direct price elasticity
eggs milk bovine chicken other meat goat/sheep meat Akmal (1994)
eggs
0.235–2.31* –0.14–0.96* Bouis et al.(1992) 0.58–1.50* –1.03–1.08*
our analysis 0.47 –0.37
Akmal (1994)
milk
0.25–0.73* –0.10–0.63* Bouis et al.(1992) 0.68–0.67* –0.94–1.01* Seale et.
al.(2003) 0.84313 –0.68183 Huq et al.(2011) 1.10–1.37* –0.75–0.99* Farooq et al.(1999) 1.55 –0.94 our analysis 2.28417867 –1.36 Akmal (1994)
bovine
0.26–0.37* (–0.07)–(–0.56)* Bouis et al.(1992) 0.17–0.57* –0.71–0.87* our analysis 0.835253547 –0.72 Akmal (1994)
chicken
0.28–1.7* –0.20–1.32* Bouis et al.(1992) 0.46–1.18* –1.10–1.20* our analysis 1.7944227 0.12 Bouis et al.(1992) other
meat
0.35–0.90* –1.16–1.31* our analysis 0.64956003 0.01 Akmal (1994) goat/
sheep meat
0.21–1.75* –0.15–1.21* Bouis et al.(1992) 0.49–1.25* –1.05–1.15* our analysis –3.03507786 –0.83 *shows values for range for different income groups
change in the dietary pattern of the Pakistani consum-ers shifting their more expenditure to the livestock products. When we compared our Marshallian direct price elasticities with the same authors, then all signs are the same except for chicken and other meat. That means that when the chicken and other meat price increases, then their consumption also increases.
Table 8 is used to compare our results with the results of other authors (Dastagiri 2004; Mittal 2006; Kumar et al. 2011) for India. The first two authors used the QUAIDS approach for data from the na-tional sample survey (2004/2005) for different groups and the last author used the classical regression method for the data from the national sample survey (1993/1994) for livestock products. So the present study took data for 19 years and used the LA/AIDS approach by taking only animal products. Our values of the expenditure elasticities for all products have the same signs except for the goat/sheep meat, but our values are relatively higher for other meat, milk and eggs which are expenditure-elastic. That means that when the expenditures rise, their consumption also rises. Our values for the Marshallian direct price elasticities have the same signs except for chicken and other meat, but other absolute values are rela-tively lower.
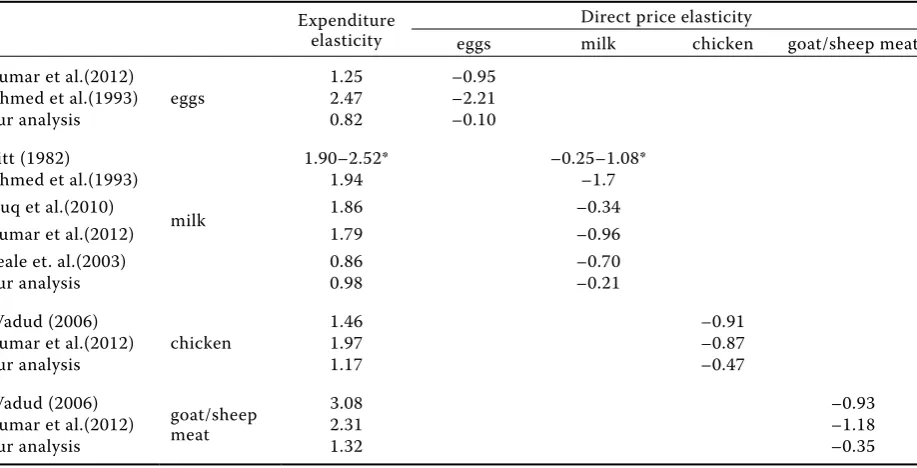
Table 9 is also used to compare our results with the results of other authors (Pitt 1983; Ahmed et al.1993;
Wadud 2006; Kumar et al. 2012; Huq et al. 2010) for Bangladesh. Ahmed and Shamas (1993) and Huq and Arshad (2010) used the AIDS approach for the data from the household income and expenditure survey for different income groups. Kumar et al. 2012 used QUAIDS approach for the household income and expenditure survey 2005/2006. While Pitt (1983) used Tobin variable model for data from household economic survey 1973/1974. So the present study took data for 19 years and used the LA-AIDS approach by taking only the animal products. Our values of the expenditure elasticities for all products have the same signs, but our values are relatively higher for the chicken and goat meat, which are expenditure-elastic. That means that when the expenditures rise, their consumption also rises. Our values for the Marshallian direct price elasticities have the same signs, but the values are relatively lower. Our results show that in the long run, the consumption pattern in Bangladesh is more driven by the expenditure as compared to price.
CONCLUSION AND DISCUSSION
[image:9.595.70.529.496.730.2]The six animal products taken in account in our analysis represent an important share of the total protein and caloric intakes in these three countries if we exclude the marine products.
Table 9. Table of comparison with other authors for Bangladesh (Marshallian short-term elasticities)
Expenditure elasticity
Direct price elasticity
eggs milk chicken goat/sheep meat Kumar et al.(2012)
eggs
1.25 –0.95
Ahmed et al.(1993) 2.47 –2.21
our analysis 0.82 –0.10
Pitt (1982)
milk
1.90–2.52* –0.25–1.08* Ahmed et al.(1993) 1.94 –1.7
Huq et al.(2010) 1.86 –0.34
Kumar et al.(2012) 1.79 –0.96 Seale et. al.(2003) 0.86 –0.70
our analysis 0.98 –0.21
Wadud (2006)
chicken
1.46 –0.91
Kumar et al.(2012) 1.97 –0.87
our analysis 1.17 –0.47
Wadud (2006)
goat/sheep meat
3.08 –0.93
Kumar et al.(2012) 2.31 –1.18
our analysis 1.32 –0.35
doi: 10.17221/138/2014-AGRICECON
Considering the FAO statistics, the consumption of major food has revealed a structural shift in the dietary pattern due to the changes in tastes, an easier access, income increase, the changes in the relative price and the urbanization pattern, but still animal products occupy a limited position in the dietary pat-tern of Pakistan, India and Bangladesh even if they are appreciated for their nutritional value.
Our results can contribute to the evaluation of some public policies, but our calculations are limited by some problems: the producer prices used as a proxy of consumer prices, the availability of data for the limited numbers of years (19), some questions on accuracy of the FAO data. It is important to notice that, contrary to many other studies, our work, based on econometric estimations of the yearly data, is limited to animal food, while other authors used the panel data on a specific year for all food products (and eventually some non-food products). Due to these differences of methodology, it is evident that the values of the main calculated parameters (elas-ticities) are different
According to our results, eggs and milk in India are expenditure-elastic like in others (Dastgiri 2004; Mittal 2006). This implies that as the expenditure or the income level increases, the proportion of the ex-penditure or income on eggs and milk is much higher than for other products in our analysis. However, all other products are expenditure-inelastic for India. On the other hand, the price-inelastic animal prod-ucts in India show that the increase in price will not have much impact on their consumption. Our results coincide with the previous studies of (Dastagiri 2004; Mittal 2006; Kumar et al. 2011). So, if the Indian government increases the income of the poor (with low income), it will lead to an important increase in their protein and caloric intake, as the income augmentation will create a manifold increase in the consumption in eggs and milk. On the contrary, a subsidy on the prices of these prices would not generate any important effect in the consumption of both these products.
For Pakistan, all the products taken into the analysis are price -inelastic, like in other studies (Bouis 1992; Haq et al.2011). However, the signs of elasticity are positive for the chicken and other meat in Pakistan. The expenditure elasticities for chicken, goat meat and milk are (> 1), making them expenditure elastic products. Our results are different for the chicken and goat meat elastcities, which were previously calculated by (Bouis 1992; Akmal 1994). Thus, the
Pakistan government should increase the income of the poor to increase the nourishment level by giving subsidies as it would increase the consumption of the chicken and milk more than the income increase.
Whereas in Bangladesh, all the products in our analysis are price inelastic. These results are in line with the previous studies of (Wadud 2006; Huq and Arshad 2010; Kumar et al. 2012). Therefore, the ex-penditure elasticities for chicken and goat meat are (>1) making them the expenditure elastic products in Bangladesh. The results of our study are in line with the previous studies of (Wadud 2006; Kumar et al. 2010). However, the elasticities for milk and eggs in our studies are in contrast with the previous ones making them expenditure inelastic products (Pitt 1982; Ahmed and Shams 1993; Huq et al. 2010; Kumar et al. 2012). The Bangladesh government should also concentrate on increasing the income level of the poor which will ultimately increase the consumption of the chicken and goat meat in their diet leading to boosting their protein and caloric intake.
Our results exhibit more or less the same pattern like in other authors. The respective governments can pursue the policy of enhancing the nourishment of their citizens through considering the share of every food sector. As in Pakistan, animal products are making the big share so the government should focus on this sector more.
All our six animal products are price-inelastic in all three countries. So, it would not be rational for the governments to decrease the prices of the products to boost the nourishment level. However, in every country two or more of the animal products are ex-penditure elastic. Thus, the respective governments can consider the option to increase the income level (by giving subsidy to consumer) or to achieve the target of better protein and calories intake by decreasing prices (by price subsidy).
REFERENCE
Ahmed A.U., Shams Y. (1993). Demand Parameters in Rural Bangladesh. International Food Policy Research Institute, Bangladesh Food Policy Project, Dhaka Funded. Akmal M. (1994): The production and consumption of
livestock foods in Pakistan: a look into future. The Pa-kistan Development Review, 33: 19–39.
Behrman J.R., Deolalikar A.B. (1987): will developing coun-tries nutrition improve with income? A case study from rural South India. Journal of Political Economy, 95: 492–507.
Bouis H.E. (1992): Food demand elasticities by income group by urban and rural populations for Pakistan. The Pakistan Development Review, 31: 997–1017.
Deaton A., Muellbauer J. (1980a): An almost ideal demand system. Economic Review, 70: 312–326.
Deaton A., Muellbauer J. (1980 b): Economics and Con-sumer Behavior. Cambridge University Press, Cambridge. FAO (1966–2008): FAO Agro Statistical Database. Food and
Agriculture Organization of United Nations. Available at http://faostat.fao.org/site/339/default.aspx
Farooq U., Young T., Iqbal M. (1999): An investigation into the farm households consumption patterns in Pun-jab, Pakistan. The Pakistan Development Review, 38: 293–305.
Haq U.Z., Nazli H., Meilke K., Ishaq M., Khattak A., Hashmi A.H., Rehman F.U. (2011): Food demand patterns in Pakistani Punjab. Sarhad Journal of Agriculture, 27: 305–311.
Holt M.T., Goodwin B.K. (2009): The almost ideal and translog demand systems. In: Slotje D. (ed.): Contribu-tions to Economic Analysis, Quantifying Consumer Preferences. Emerald Group Publishing Limited, Brad-ford: 37–59.
Huq A.M., Arshad F.M. (2010): Demand elasticities for different food items in Bangladesh. Journal of Applied Sciences, 10: 2369–2378.
Kumar P., Kumar A., Parappurathu S., Raju S.S. (2011): Estimation of demand elasticity for food commodities in India. Agricultural Economic Review, 24: 1–14. Malthus T. (1798): An Essay on the Principal of Population.
J. Johnson, London.
Mellor J.W. (1983): Food Prospects for the Developing Countries. IFPRI. Reprinted from the American Eco-nomic Review, 73: 241.
Mittal S. (2006): Structural Shift in Demand for Food: Projections for 2020. Indian Council for Research on International Economic Relations, Working Paper No. 184. Available at http://www.eldis.ids.ac.uk/vfile/up-load/1/document/0708/DOC23553.pdf
Pitt M.M. (1983): Food preferences and nutrition in ru-ral Bangladesh. Review of Economics & Statistics, 65: 105–114.
Seale J., Regmi A., Bernstein J. (2003): International Evi-dence on Food Consumption Patterns. Technical Bulletin No. 1904, United States Department of Agriculture. SOFI (2011): The State of Food Insecurity in the World
2011. FAO Corporate Document Repository. Available at www.fao.org/docrep/014/i2330e/i2330e.pdf
UNCTAD price database. Available at http://www.unctad. org/templates/Page.asp?intItemID=1889&lang=1 Wadud M.A. (2006): An analysis of meat demand in
Bang-ladesh using the almost ideal demand system. The Em-pirical Economics Letters, 5: 29–35.
World Bank (1981): World Development Report. World Bank, Washington.
Received: 27th August 2014
Accepted: 29th January 2015
Contact address: