Consumption of beef in the Czech Republic
Milan PALÁT, Šárka DVOŘÁKOVÁ, Naděžda KUPKOVÁ
Department of Economics, Faculty of Business and Economics, Mendel University
in Brno, Brno, Czech Republic
Abstract: The paper is aimed at the demand for beef. its objective is to evaluate the development of beef consumption in the market of the czech republic, and particularly to identify the factors affecting the level of demand for beef. it refers to the analysis of the development of beef consumption in the czech republic depending on its price and costs of the selected kinds of its near substitutes, when their relationships are evaluated through their relationships are evaluated methods of re-gression and correlation analysis. The paper proves statistically the existence of relations among these crucial factors deter-mining the demand. There are, of course, other factors affecting the position and tendency of a demand curve. it refers, for example, to various tastes, customs, traditions, the degree of urbanization, the possible health benefits or risks, legislation or the expected decline or increase of prices of the particular kinds of meat. All factors mentioned above cannot be, howev-er, included into the analysis because their values are not available and many of them cannot be even quantified. results of the statistical analysis prove the fundamental role of final consumers in forming the demand for beef, when they are above all affected by prices of beef and its substitutes.
Keywords: consumption, beef, czech republic, statistical methods
numerous factors of the external environment affect agricultural production. Economic, politic, technological and social and many other factors rank among them. The state (government) plays an im-portant role in the field of policy when it, through its measures, affects the agrarian market. The state uses the following tools: grants, customs measures, quantitative restrictions (quotas), taxes and activities of funds. international trade plays also an indispen-sable role as well as the process of globalization and the integration processes in the world. The long-term development of economics and the whole society, which formed the agrarian sector to the present ap-pearance, cannot be also ignored. czech agriculture passed through a number of changes from the period of the Austrian-hungarian Empire. Several reforms passed, from a growing feudal estate into a capitalist estate, through the first land reform in 1919, from the directive management in the period of german occupation, land reforms after 1945 (confiscation of the property of germans, hungarians and collabora-tors), the period of the collectivization of agriculture (the origin of Unified Agricultural cooperatives), the system of centrally planned economy, the economic reform in the agrarian sector after 1989
(transfor-mation processes: restitution of the expropriated property, transformation of agricultural cooperatives, state property privatization) up to the present state of agriculture affected by the admission preparation and then the actual admission of the czech republic into the European Union (EU) in 2004.
The year 1989 was, of course, an important mile-stone. At that time, liberalization of prices was carried out and the subsidy support from the state budget was reduced. After the admission of the czech republic into the European Union, all its conceptions of agrar-ian policy had to be brought into harmony with the principles and measures of the common Agricultural Policy of the EU and other measures of the EU in relation to agriculture, food safety, environment and the countryside development. All these changes also considerably affect the development of food consump-tion and thus the total level of the czech populaconsump-tion nourishment. After 1989, huge changes occurred in the behaviour of consumers. People could choose from the markedly broader spectrum of food as compared to the period before the Velvet revolution. As for the consumption of food, a long-term trend of the increase of food consumption of animal origin turned totally. The consumption of food of the animal origin
decreased and, on the contrary, the consumption of food of the vegetable origin increased. The steady decline of the consumption becomes evident e.g. regarding beef. Bečvářová (2005) mentions that the consumption of food shows the limits of minimum and maximum consumption (physiological limits) and after achieving a certain limit of consumption, the demand is affected only by the population increase.
The paper is aimed at the demand for beef. its objective is to evaluate the development of beef con-sumption in the market in the czech republic and to identify the factors affecting the level of demand for beef with the help of statistical methods. it refers to the analysis of the beef consumption development in the czech republic in the selected reference period depending on the price of beef and its substitutes. Moreover, through methods of regression and cor-relation analysis, the cor-relationships are evaluated of the beef consumption and prices of the selected kinds of near substitutes.
MATERIAL AND METHODS
With respect to the fact that the data concerning the demanding amount of beef are not available, they were replaced by the data on the consumption of beef. consumption is the really purchased amount of a particular commodity whereas demand expresses a wish and willingness of customers to purchase the commodity. Although there is a certain difference between these conceptions, under our conditions, we can consider them as identical. if a consumer is willing to buy a certain amount of food for a certain price, he/she can buy it without problems because the offer in the market is sufficient. The original inten-tion was to choose consumer prices of the particular kinds of meat as independent variables (prices of beef /rear/, prices of beef /front with bone/, prices of pork roast, prices of pork fatback, prices of whole disembowelled chicken). however, after a careful consideration, we came to the conclusion that we could choose the prices of the carcass meat. if we include consumer prices into the model, we could not cover the whole consumption because not only households rank among consumers, but also e.g. school dining rooms, restaurants etc.
To carry out the regression analysis, it is necessary to find the sufficient amount of data. if the exam-ined sample of values is not sufficiently extensive, the result of the analysis is without the correspond-ing informative (predicative) value. The data are based on the published Statistical Yearbooks of the czech Statistical office (1985–2007) or the historical
Statistical Yearbook of the cSSr (1985). The data in these sources were available in yearly intervals. Monthly or quarterly values are not mentioned in the yearbooks. Thus, the set of data consists of a time series of 56 years in the determined reference period 1952‒2007.
The use of statistical methods was described by Aczel (1989), Mason and Lind (1990) or Studenmund (2006). The factual data processing comes from the methodology published by Seger et al. (1998), hušek (1999), Dirschedl and osteermann (2001), hindls et al. (2003) and Palát (2010). Minařík (1996, p. 97) states, that the statistical dependence of two charac-teristics (numeric figures) can be expressed as their functional relation by a formula, table or graph. We recognize the following types of statistical depend-ence: fixed, functional alias deterministic dependence and free, statistic alias stochastic dependence. The stochastic dependence makes itself felt like more or less significant repeatable tendency, which realizes in a different form in a different place and in a dif-ferent time. it is characteristic of its variability of the individual causes and makes itself felt under a series of noteless, variously responding factors. The stochastic dependence is referred to as a correlation dependency. For this dependency, we distinguish the dependent and independent variables. The correla-tion analysis of two variables is called the pair or simple analysis.
The graphical data presentation tool for examin-ing the dependence between two variables is a point diagram, where we mark the particular cases as points in a reference frame with coordinates, which are the values of the particular dependent and independent variables. in this paper, the particular characteristics are calculated of tightness of the dependency of vari-ables. The conjugate regression lines show the same values of the tightness dependency characteristics, the correlation coefficient ryx = rxy, determination coefficient ݎ௬௫ଶ ൌ ݎ௫௬ଶ (at the first place in this index is
stated variable thought to be dependent). correlation coefficient can also be defined as a geometrical mean of the regression coefficient values byx, bxyfor the conjugate regression equations (bisectors). correlation coefficient can vary between –1 to +1 (–1 ≤ ryx ≤ +1) whereas according to its absolute value the tightness dependency is assessed and the number sign shows the dependency “direction trend”:
(b) The “+” sign of correlation coefficient describes a linear upward-sloping dependency; the “–” sign indicates a linear downward-sloping dependency.
The correlation index Iyx is a dependency tightness characteristics for any type of regression function (for simple as well as multiple dependencies of vari-ables). its second power is determination index ���� .
Determination index multiplied by 100 presents the explanation percentage of the calculated regression function – how the changes of dependent variable Y are explained by the changes of independent variable(s).
Statistical software Unistat 5.11 for Windows and Microsoft Excel has been used for the calculation of following results.
RESULTS AND DISCUSSION
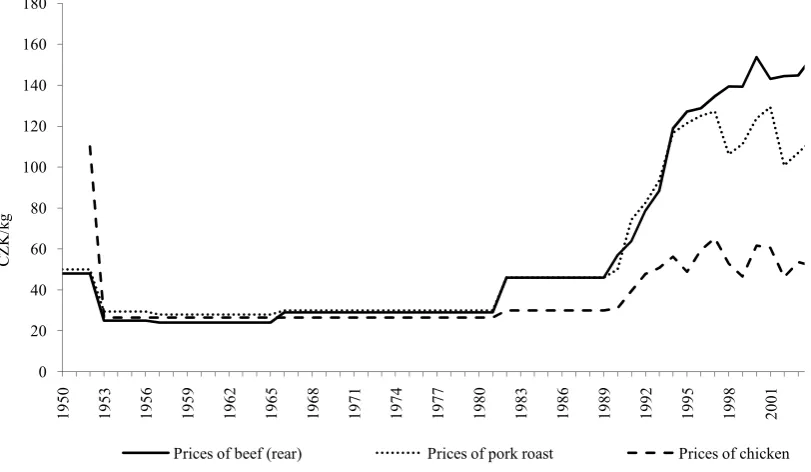
The aim of the paper is to analyse the development of the demand for beef and to determine the statisti-cally significant factors, which determine it. if we want to examine the demand for beef, it is not possible to select only one kind of meat (e.g. beef /rear/), but we have to take into consideration the whole carcass meat. Should we take into consideration consumer prices, then the fact that till 1989 consumer prices were granted would be problematic. The fact that in the period 1953 to 1989 prices of all monitored kinds of meat nearly stagnated is illustrated in Figure 1. Paradoxically, until 1965, just beef was the cheapest
commodity. nevertheless, within this time interval, we would hardly find a relationship between the de-mand and consumer prices. Then, if we compare the development of beef consumption and the develop-ment of prices that period, we can find that in spite of the nearly unchanging development of prices, the consumption of beef increased until 1989. Thus, in this period, demand for beef was not dependent on the prices of meat but on other factors.
A turning point appeared in 1991, when price lib-eralization occurred. Since this moment, we can note a marked fall of beef consumption. in this time period, the dependence of demand for prices of the given kinds of meat could be expected. Therefore, we would have to divide the time series into two stages for the analysis of demand and to take into consideration only the period after 1989.
in the paper, we shall work with the following in-dependent variables: prices of fattening cattle (cJS), prices of fat calves (cJT), prices of fattening pigs (cJP), prices of the whole disembowelled chicken (cK), population – mid-year population (no), mean monthly wages (i).
The prices of fattening bulls are considered to be prices of fattening cattle. We can find a number of other factors, which affect the position and tendency of the demand curve. it refers, e.g., to various tastes, customs, traditions, the degree of urbanization or also the expected decline or increase of prices of the particular kinds of meat. These variables cannot be, however, included into the analysis because their
0 20 40 60 80 100 120 140 160 180
1950 1953 1956 1959 1962 1965 1968 1971 1974 1977 1980 1983 1986 1989 1992 1995 1998 2001
CZK/k
g
[image:3.595.106.512.485.721.2]Prices of beef (rear) Prices of pork roast Prices of chicken
Figure 1. The development of prices of the selected kinds of meat (beef /rear/, pork roast, chicken) in the period 1950–2007
values are not available and some of them cannot be quantified. if some subject in the market of a certain commodity carries out the analysis of demand for this commodity, e.g. for its investment intention, it should take into account also the facts mentioned above and to perform a survey in the given region. Key factors include the prices of beef and the prices of its substitutes. Their development from 1950 to 2007 is illustrated in Figure 2.
in contrast to consumer prices, prices of carcass meat (bodies) were not constant in the period 1950 to 1989, because the governmental subsidies did not reflect in them. nevertheless, there is always evident only a slight increase of prices in this time period. it
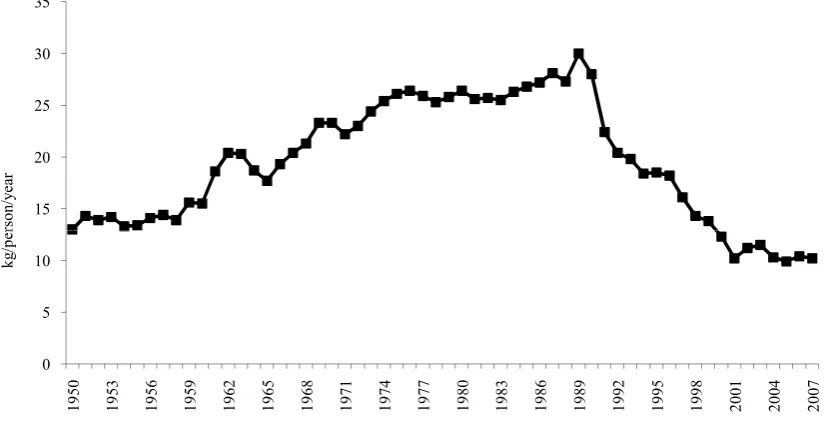
was caused by the centrally planned economy when market prices were not formed by the market, but all prices were centrally set and controlled. only at the prices of chicken, it is possible to note the constant development from 1989 because only the data on prices of the whole disembowelled chicken are available, in which the government subsidies are reflected. however, in all cases, an abrupt increase of prices occurred after the year 1989 as mentioned above. The development of beef consumption in the particular years during the reference period is illustrated in Figure 3.
it is evident that until 1989, the consumption of beef increased. it was particularly caused by low
20 40 60 80 100 120 CZK/ kg 0 20 195 0 195 3 195 6 195 9 196 2 196 5 196 8 197 1 197 4 197 7 198 0 198 3 198 6 198 9 199 2 199 5 199 8 200 1 200 4 200 7
[image:4.595.106.518.69.263.2]Prices of fatstock Prices of fat calves Prices of fattening pigs Prices of chicken
Figure 2. The development of the prices of fattening stock (cattle, calves, pigs and chicken) in the period 1950–2007 Source: our processing according to the Statistical Yearbook of the czech republic
15 20 25 30 35 rson/ year 0 5 10 19 50 19 53 19 56 19 59 19 62 19 65 19 68 19 71 19 74 19 77 19 80 19 83 19 86 19 89 19 92 19 95 19 98 20 01 20 04 20 07 kg /p er
Figure 3. The development of beef consumption
[image:4.595.95.510.517.729.2]prices of beef as evident from the previous Figure 2. After 1989, a turning point occurred and the con-sumption rapidly declined. in the period of 18 years (1989–2007), it decreased by about 20 kg/person/year. Thus, it was not an accident that in 1989, when the governmental subsidies for the particular prices of meat were cancelled, we could note a considerable increase of prices. At the primary analysis without the use of statistical tools, it is possible to state that the price of beef is an important factor affecting the demanded amount of meat. it will evidently show the highest effect on the consumer decision making. The following statistical analysis will show if the hypothesis mentioned above is correct.
Thus, we shall try to determine the relationships between independent variables and the dependent variable of beef consumption (Bc). if we reveal a certain significant dependence among some of these variables, we can suppose that these factors affect the demand for beef. A test by the means of correlation was carried out, which examined mutual dependences at 56 values of the monitored indicators during the selected reference period.
The results of the analysis are given in Table 1. The correlation coefficient reaches the highest val-ues at the chicken meat price (cK) and monthly wages (i) variables. p-value tests the statistical significance of estimated correlation. p-value smaller than 0.05 indicates a statistically significant non-zero correla-tion at 95% significance level. it is evident that both variables mentioned above are statistically significant in this case. The value of fattened cattle surprisingly
did not show any statistically significant correla-tion. comparing the diagram of the development of beef consumption at Figure 3 with the diagram where the prices of carcass kinds of meat are plotted (Figure 2), it is evident that till 1989, the fattening cattle price did not play a significant role in forming the consumption of beef. if we take into account the time interval until 1989, we can see that the meat consumption showed a rapid growth although meat prices changed only slightly due to the political situa-tion in the czech republic at that time. Moreover, we could expect that at the price growth, the amount of the consumed commodity will decrease. of course, it increased here even more quickly than the particular prices. it follows that, at least in this case, the price of fattening cattle did not show a significant effect on the consumed amount of meat.
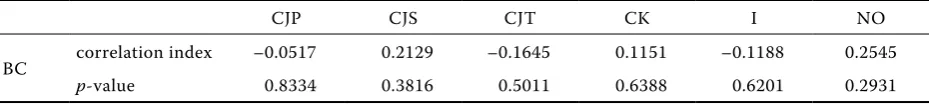
[image:5.595.63.533.97.150.2]A turning point occurred after 1989, when the price liberalization happened. Since this moment, we can note a marked decline of the beef consumption. We cannot ignore the fact that in the same period, a more intense increase of prices occurred in the czech republic than before. Particularly the liberalization of prices was an evident reason of this fact. We can hypothesize that after 1989, the consumption of beef in the czech republic depends on the beef price. To prove this hypothesis, we shall carry out another analysis. This time, we shall aim only at the period after the Velvet revolution. in Table 2, the results of the correlation analysis are given. They are based on 19 values of the selected population sample in the czech republic in the period after 1989.
Table 1. correlation between the independent variables and a dependent variable (consumption of beef ) during the reference period
cJP cJS cJT cK i no
Bc correlation index –0.2183 0.0626 0.0965 –0.2676 –0.3945 0.1305
p-value 0.1093 0.6496 0.4834 0.0482 0.0029 0.3421
Bc = beef consumption, cJS = fattening cattle prices, cJT = fat calf prices, cJP = prices of fattening pigs, cK = prices of whole disembowelled chicken, no = population - mid-year population, i = average monthly wages
Source: own calculations
Table 2. correlation between the independent variables and a dependent variable (beef consumption) in the period after 1989
cJP cJS cJT cK i no
Bc correlation index –0.0517 0.2129 –0.1645 0.1151 –0.1188 0.2545
p-value 0.8334 0.3816 0.5011 0.6388 0.6201 0.2931
[image:5.595.66.531.680.732.2]The best values are provided by the correlation coefficient at the variable population (no) and the variable fattening cattle price (cJS), where the exist-ence of dependexist-ence was already supposed in the pre-vious calculation carried out for the whole reference period. We stemmed from the annual values of beef consumption; however, statistically more significant results could be achieved if the quarterly or monthly data were available. Another problem is represented by a relatively small extent of the sample (population) after 1989, when it is clear that the model shows higher informative values with a longer reference period. nevertheless, in economics, weighty changes occur during years and the data from distant periods may not be fully comparable. Therefore, the used reference period appears to be a certain compromise. in spite of certain relations, which have been already statisti-cally demonstrated within this paper, it is necessary to accept the results obtained carefully with respect to other factors affecting the demand for beef, such as taste of the consumers, the effects of advertising, the expected changes of prices, various reductions in prices, the effects of health and nutrition education where white meat and fish are often propagated. All these effects can influence the demand formation. Moreover, unexpected events or calamities both of political or health character can affect the development of consumption. For example, in 2001, the occurrence of the bovine spongiphorm encephalopathy (BSE) was such a disaster for demand. This disaster suppressed the demand for beef because the disease transferred from cattle to man evokes the so-called creutzfeldt-Jakob disease. Similar effects used to be, however, temporary and from the aspect of long-term effects, they do not show any fundamental importance. The results of the statistical analysis confirm a basic role of final consumers in forming the demand for beef when the consumers are particularly affected by the prices of beef and its substitutes.
CONCLUSIONS
The paper is aimed at the evaluation of the devel-opment of beef consumption on the market in the czech republic and identification of factors affecting the level of demand for beef with the help of statisti-cal methods. Key factors include prices of beef and prices of its substitutes.
in the paper, we work with the following independent variables: fat cattle prices, prices of fat calves, prices of fattening pigs, prices of whole disembowelled chicken, mid-year population, mean monthly wages and we tried to determine relationships between these
independent variables and the dependent variable of beef consumption. if we reveal a certain signifi-cant dependence among some of these variables we can suppose that these factors affect demand after beef. A test by means of correlation was carried out, which examined mutual dependences at 56 values of monitored indicators during the selected refer-ence period. The correlation coefficient reaches the highest values at chicken meat price and monthly wages variables. it is evident that both variables are statistically significant in this case. The value of fat cattle surprisingly did not show statistically signifi-cant correlation.
it is evident that till 1989, the fat cattle price did not play a significant role in forming the consump-tion of beef. if we take into account a time interval until 1989 meat consumption shows rapid growth although meat prices changed only slightly due to the political situation in the czech republic at that time. Moreover, we could expect that at the price growth the amount of consumed commodity will decrease. of course, it increases here even more quickly than particular prices. it follows that, at least in this case, the price of fat cattle does not show a significant effect on the consumed amount of meat. A turning point occurs after 1989, when price liberalization happened. Since this moment, we can note a marked decline of the beef consumption. We cannot ignore a fact that in the same period, a more intense increase of prices occurred in the czech republic than usually. Particularly liberalization of prices was an evident reason of this fact. We can hypothesize that after 1989, consumption of beef in the czech republic depends on the beef price. To prove this hypothesis we carried out another analysis. This time, we aim only at a period after the velvet revolution. The best values provides a correlation coefficient at a variable population and a variable fat cattle price, where the existence of dependence was already supposed in the previous calculation carried out for the whole reference period.
Contact address:
Milan Palát, Mendel University in Brno, zemědělská 1, 613 00 Brno, czech republic e-mail: mpalat@mendelu.cz
consumers are particularly affected by prices of beef and its substitutes.
REfERENCES
Aczel A. (1989): complete Business Statistics. irwin, Bos-ton; iSBn 0-256-05716-8.
Bečvářová V. (2005): zemědělství v agrobyznysu. (Agricul-ture in Agribusiness.) MzLU, Brno; iSBn 80-7157-891-6. hušek r. (1999): Ekonometrická analýza. (Econometric
Analysis.) 1st ed. EKoPrESS, s.r.o., Praha; iSBn 80-86119-19-X.
Dirschedl P., ostermann r. (2001): computational Stati-stics. Physica-Verlag, heidelberg; iSBn 3-7908-0813-X. hindls r., hronová S., Seger J. (2003): Statistika pro ekono-my. Professional Publishing, Praha; iSBn 80-86419-34-7. historická statistická ročenka ČSSr(historical Statistical
Yearbook of the cSSr.) (1985). 1st ed. SnTL/ALFA, Praha.
Mason r., Lind D. (1990): Statistical Techniques in Business and Economics. irwin, Boston; iSBn 0-256-07696-0. Minařík B. (1996): Statistika iii. (Statistics iii.) MzLU,
Brno; iSBn 80-7157-189-X.
Palát M. (2010): Evaluation of relation between invest-ments and savings in central European countries. Acta Universitatis Agriculturae et Silviculturae Mendelianae Brunensis, 58: 175–182.
Seger J., hindls r., hronová S. (1998): Statistika v hospo-dářství. (Statistics in the Economy.) EcT Publishing, Praha; iSBn 80-86006-56-5.
Statistical Yearbooks of the czech republic, czech and Slovak Federative republic and cSSr (1985–2007). czech Statistical office, Prague.
Studenmund A.h. (2006): Using Econometrics: A Practical guide. 5th ed. Pearson Education, inc., Prentice hall; iSBn 0-321-31649-5.