Annual
Competitiveness
Report 2010
Volume 1
Benchmarking
Ireland’s Performance
NCC
Annual Competitiveness Report
2010 Volume 1
July 2010
Forfás
Wilton Park House Wilton Place Dublin 2
Annual
Competitiveness
Report 2010
Volume 1:
Introduction to the NCC
The National Competitiveness Council was established in 1997 as a Social Partnership body. It reports to An Taoiseach on key competitiveness issues facing the Irish economy, together with recommendations on policy actions required to enhance Ireland's competitive position.
Each year the NCC publishes the two-volume Annual Competitiveness Report.
Volume One, Benchmarking Ireland’s Performance, is a collection of statistical indicators of Ireland’s competitiveness performance in relation to 17 other economies and the OECD or euro area average.
Volume Two, Ireland’s Competitiveness Challenge, uses this information along with the latest research to outline the main challenges to Ireland’s competitiveness and the policy responses required to meet them.
As part of its work, the NCC also publishes other papers on specific competitiveness issues. The work of the NCC is underpinned by research and analysis undertaken by Forfás – Ireland’s policy advisory board for enterprise, trade, science, technology and innovation.
This report is Volume 1, Benchmarking Ireland’s Performance. This report analyses Ireland’s competitiveness performance using 135 competitiveness indicators. These range from measures of the successes of past competitiveness, such as economic growth and quality of life, to the policy inputs that will drive future competitiveness, such as the education system and the delivery of infrastructure. Drawing primarily on data from international sources (e.g. OECD, Eurostat, UN etc.) this report benchmarks Ireland’s performance, comparing and ranking it to that of our economic peer group and tracing its evolution over time.
The National Competitiveness Council hopes that this report will, as a reference document, stimulate further debate and discussion on the competitiveness challenges that face Ireland.
Council Members
Dr Don Thornhill Chairman
Rory Ardagh Telecom Property Holdings Limited
Brendan Butler Director of Strategy, Trade, EU and International Affairs, IBEC Donal Byrne Chairman, Cadbury Schweppes Ireland Limited
Shay Cody General Secretary, IMPACT
Pat Delaney Director of Sectors and Regions, IBEC
Clare Dunne Assistant Secretary, Department of Enterprise, Trade and Innovation
Marcus Hewson Senior Vice President, McDonalds Corporation Annette Hughes Director, DKM Economic Consultants
Seán Murphy Martin Shanahan
Deputy Chief Executive, Chambers Ireland Chief Executive, Forfás
William Slattery Executive Vice President and Head of European Offshore Domiciles, State Street International (Ireland) Limited Paul Sweeney Economic Adviser, Irish Congress of Trade Unions
John Travers Consultant and Founding Chief Executive Officer, Forfás and Science Foundation Ireland
Prof Ferdinand von Prondzynski President, Dublin City University
Council Advisers
Paul Bates Assistant Secretary, Department of Tourism, Culture and Sport Department of the Taoiseach
Mark Griffin Assistant Secretary, Department of Environment, Heritage, and Local Government
Kevin McCarthy Assistant Secretary, Department of Education and Skills Eamonn Molloy Assistant Secretary, Department of Communications, Energy
and Natural Resources
David Moloney Assistant Secretary, Department of Finance John Murphy Assistant Secretary, Department of Transport Liam Nellis Chief Executive, InterTrade Ireland
Research and Administration
Adrian Devitt Forfás
Caoimhe Gavin Eoghan O’Briain
Wilton Park House, Wilton Place Dublin 2
Mary Twomey Tel: 01 607 3000 Fax: 01 607 3030
Foreword by the Taoiseach
We live in one of the most dynamic and challenging times in economic history. It is a time defined by great change and upheaval not just in Ireland but also throughout Europe and across the world. Over the past year, the Government has taken significant steps to return the economy to sustainable growth. This strategy includes re-establishing public and international confidence, repairing the banking system, regaining competitiveness, supporting enterprises to create and retain jobs and building the innovation or ideas component of the economy.
Confidence in Ireland is rising and the decisive action we are taking means our economic outlook has improved. The European Commission is predicting that Ireland will grow at double the euro area average next year. However, that does not mean we should be complacent as we face major challenges in the period ahead. The global economy has undergone a seismic change. The lesson from recent events is that we are in a very competitive global market-place and we need to continue to adopt brave and ambitious solutions if we are to provide the basis for sustainable growth, job creation and improvements in living standards.
Growing our exports and raising productivity across the economy is the only sustainable path to reducing unemployment and securing long term prosperity. Significant opportunities exist to grow export markets if we can provide a competitive business environment that allows Irish exporters to compete successfully in difficult global markets. We are continuing to make significant investment in infrastructure which increases the productive capacity of the economy and generates jobs. This year we will invest €6.5 billion, which is in the region of five per cent of GNP, proportionately one of the largest capital programmes in the EU.
We also need to be more productive in all areas of the economy - as set out in our Framework for Economic Renewal: Building Ireland's Smart Economy. The Smart Economy is relevant to everyone, not just those in high-tech employment. It applies to small indigenous firms as well as high-tech multi-nationals. It means being open to new ideas and new ways of doing things, and building links between the education system and the wider economy. It is about the public sector as well as the private sector. We have already made significant progress in implementing the Smart Economy Framework and are currently placing particular emphasis on ‘building the ideas element of the economy’.
This innovation strategy aims to make Ireland the best place in Europe to turn research and
knowledge into products and services; the best place to start and grow an innovative company or to relocate, expand and scale a small business; and the best place for research-intensive
Although our economy is turning a corner, we need to acknowledge that the international outlook is not yet as secure as we might like. That is why we must keep a clear focus on those factors that are ours to control. The National Competitiveness Council continues to make an important contribution to our understanding of a rapidly changing global environment and to identify those areas where Ireland needs to concentrate its efforts. I would like on behalf of my colleagues in Government, to thank the Council for its important work and am pleased to introduce Benchmarking Ireland’s Performance 2010.
Chairman’s Preface
While the Irish economy has contracted very considerably in the past two years, we continue to have significant competitiveness strengths and opportunities. Ireland’s trade performance remains resilient which has offset some of the sharp impact of the domestic recession. This report highlights that our international competitiveness is improving in a range of areas. Enhancing our competitiveness is a necessary part of our recovery strategy – irrespective of the prevailing conditions in the world economy.
Competitiveness is underpinned by stable public finances, a working banking system and a broad vision for the economy and society. We have made significant progress in improving our
competitiveness in the past 18 months. Costs have fallen, skills availability has improved and the pressures on infrastructure have eased. Developing an inclusive vision for the economy and society is critical.
Continuing action to repair the public finances and restore the solvency of our banking system must be matched by an ambitious agenda of reform to enhance competitiveness. Robust economic growth is necessary to fix the public finances and banking system. Solutions cannot be viewed in isolation – by prioritising actions to support the enterprise base to compete in increasingly competitive global markets we will go a long way towards resolving our fiscal and banking challenges.
The economy is burdened by very high levels of private debt and growing levels of public debt which will continue to limit the degree to which the domestic economy can ignite a return to sustainable economic growth. Improving Ireland’s attractiveness as a location to do business and export from are vital to restore confidence in our economic prospects and reverse the severe decline in domestic consumption and investment since 2008. Improving the competitiveness of the domestic economy will also be critical for our future economic prospects for two reasons - its recovery is essential to reduce unemployment and create jobs and its costs impinge on the exporting sectors.
Cost competitiveness is beginning to improve, but for the most part, recent price falls here have been a cyclical response to the severe Irish and international recession rather than to structural and sustainable changes in the cost of doing business. Continued, focused action is required to reduce the costs of doing business in Ireland and enable Irish exporters to compete successfully in difficult global markets.
of innovation across the entire economy. Higher productivity is the glue which sustains prosperity, high living standards and competitiveness. Improving productivity growth across all sectors of the economy – private and public, locally and internationally trading, manufacturing and services, indigenous and foreign owned - is central to our future success. We must also bring essential infrastructures up to world class standards – e.g. education, research, broadband, energy and public transport. While the crisis in the public finances necessitates cuts in capital expenditure, it is critical that capital expenditure is not excessively reduced to avoid difficult decisions on current expenditure and taxation.
This report provides an assessment of Ireland’s competitiveness performance against 17 other countries across a range of competitiveness factors, using 135 indicators. It provides a
comprehensive evidence base to determine the policy priorities to enhance competitiveness. If we can build on the strengths and address the weaknesses identified, we are well placed to ensure that the nascent recovery gathers momentum and delivers on Ireland’s considerable potential as a location for enterprise.
I would like to thank Council members and advisors from the relevant Government departments for their work on this report. I would also like to acknowledge the Forfás Secretariat for the work that they have done in preparing material for consideration by the Council.
Don Thornhill
Table of Contents
Chapter 1: Overview of Ireland’s Competitiveness 9
Chapter 2: Methodology 20
Chapter 3: Sustainable Growth 25
3.1 National Income 31
3.2 Quality of Life 36
3.3 Environmental Sustainability 38
Chapter 4: Essential Conditions 40
4.1 Business Performance 44
4.1.1 Business Investment 44
4.1.2 Trade 47
4.2 Productivity and Innovation 52
4.2.1 Productivity 54
4.2.2 Innovation 55
4.3 Prices and Costs 57
4.3.1 Prices 60
4.3.2 Pay Costs 62
4.3.3 Non-Pay Costs 65
4.4 Employment and Labour Supply 73
4.4.1 Employment and Unemployment 75
4.4.2 Labour Supply Characteristics 79
Chapter 5: Policy Inputs 82
5.1 Business Environment 83
5.1.1 Taxation 87
5.1.2 Finance 91
5.1.3 Regulation and Competition 95
5.1.4 Social Capital 98
5.2 Physical and Economic Infrastructure 99
5.2.1 Investment in Physical Infrastructure 103
5.2.2 Transport, Energy and Environmental Infrastructure 105 5.2.3 Information and Communications Technology Infrastructure 109
5.3 Knowledge Infrastructure 112
5.3.1 Overview of Education 116
5.3.2 Pre-Primary and Primary Education 117
5.3.3 Secondary Education 118
5.3.4 Tertiary Education and Lifelong Learning 121
Chapter 1
1.
Overview of Ireland’s Competitiveness
1.1
Introduction
Ireland is experiencing one of the deepest recessions in the developed world - economic activity has slumped (Fig. 3.02), unemployment has risen sharply (Fig. 4.45), government borrowing is increasing rapidly (Fig. 3.05) and private household debt remains very high (Fig. 3.07). However, the rate of contraction is slowing as the economy adjusts to the recent domestic and international crises; while GNP declined by 11.3 per cent in 2009, the ESRI predicts that it will decline by 0.5 per cent in 2010 and grow by 2.25 per cent in 20111. Nonetheless, the OECD expects our domestic adjustment will
be prolonged and the economic recovery weak given the significant gap in the public finances, growing national debt, high and increasing unemployment, falling disposable incomes and weak household consumption2.
Growing exports and raising productivity across the economy is the only sustainable path to reducing unemployment and securing long term economic growth and prosperity. Supported by moderating prices, Ireland’s exporting sectors performed relatively well in 2009 compared to other developed economies. During 2009, total exports fell by 1.8 per cent in Ireland compared with 13.6 per cent in the OECD3. Export growth in Ireland (1.1 per cent) is expected to be weak in 2010 and to lag the
OECD average (six per cent), as OECD exports bounce back from steep declines in 20094. Irish
productivity levels (GNP-based) are lower than the OECD average and average annual Irish
productivity growth rates were significantly below the OECD average over the period 2005-2009.
Exports are likely to be the main driver of economic growth as the retrenchment in private and public consumption and investment continues to depress economic activity and employment in Ireland. The pace of recovery in our key trading partners will be critically important for Ireland’s future export performance. Although the latest forecasts from the IMF suggest that the world economy is recovering from the global crisis better than expected, the speed of that recovery varies across the world. World economic output is now expected to increase by 4.6 per cent in 2010. Growth in the euro area (one per cent) and the UK (1.2 per cent) is expected to lag other developed economies, such as the US (3.3 per cent) and developing economies like China (10.5 per cent), India (9.4 per cent) and Brazil 7.1 per cent)5. While it is good news for Irish exporters that our main
markets are gradually returning to growth, the extent of recovery remains fragile and significant risks remain. Many of our main trading partners are tackling large government budget deficits and are seeking to unwind generous monetary and fiscal stimulus measures without damaging the fledgling recovery. The euro area faces particular challenges in restoring growth and reducing public and private debt levels.
As a small open economy, Ireland is well placed to benefit from an international recovery – if we are competitive. While increasing exports will not provide a panacea for all the challenges facing the
1 ESRI, Quarterly Economic Commentary, July 2010. 2 OECD, OECD Economic Outlook, May 2010.
3 Export growth for Ireland is sourced from the CSO - External Trade, March 2010 (merchandise exports) and Balance of Payments, March 2010 (services exports). The OECD figure is from the OECD Economic Outlook, November 2009.
4 OECD, OECD Economic Outlook, November 2009. The ESRI forecasts export volume growth of five per cent for Ireland in 2010.
Irish economy, improving Ireland’s attractiveness as a location to do business and export from will be important for restoring the levels of confidence necessary to halt the decline in domestic consumption and investment seen since 2008. Improving the competitiveness of the domestic economy will also be critical for our future economic prospects for two reasons - its costs impinge on the exporting sectors and its recovery is essential to reduce unemployment and create jobs. The remainder of this chapter sets out the key messages in Benchmarking Ireland’s Performance, 2010.
1.2
Domestic adjustment is underway but significant debt challenges loom
Although Ireland is experiencing one of the deepest recessions in the developed world, the rate of contraction is slowing and the current account balance of payments improved significantly in 2009, suggesting that Ireland is paying back borrowings by reducing investment and consumption and growing net exports (exports less imports). A current account surplus of 0.5 per cent is forecast in 2010 and 1.5 per cent in 2011 (Fig. 3.04).
However, Ireland is facing a major debt challenge. The economy is burdened by very high levels of private debt (Fig. 3.07) and growing levels of public debt (Fig. 3.05). High levels of private debt are being slowly unwound as net saving rates have increased significantly but with three quarters of household debt mortgage-related, this adjustment will take some time (Fig. 3.08). With steep falls in house prices (Fig. 4.35) and reduced incomes arising from growing unemployment levels (Fig. 4.45), debts held by householders are increasingly distressed – a trend that is likely to be
accentuated as euro area interest rates rise in future with further implications for bank stability and consumer demand. Irish banks are also particularly reliant on funding from international wholesale markets and emergency liquidity funding from the European Central Bank.
Public debt levels (Fig. 3.05) have grown significantly as a result of a very sharp decline in exchequer tax revenues (from a peak of €47 billion in 2007 to €33 billion in 2009) arising from the collapse in the construction sector (i.e. falling revenue from property transaction related taxes) and the general recession (falling revenue from taxes on incomes and sales) while government
expenditure has continued to increase – albeit more slowly (Fig. 5.01)6. In addition to dealing with
the current debt crises, Ireland needs to prepare for the longer term, with pension expenditure as a percentage of GDP forecast to double to 10.5 per cent by 2050 as Ireland’s working population ages (Fig. 3.09 and Fig. 3.10).
Actions to support the banks will greatly increase the State’s liabilities but they have not caused the current government deficit. The full implications of the measures taken to resolve the banking crisis for the public finances and the taxpayer remain unclear. Spreads on the costs of servicing government bonds remain high and volatile (Fig. 3.06). We also face significant interest payments over the medium term. Debt servicing costs amounted to €2.5 billion in 20097. This means that
about one in every €12 collected in tax went to service the national debt in 2009. By the end of 2014, the Department of Finance estimates that more than €1 in every €5 collected in tax will be required to pay the interest on Ireland’s debt. Containing our public debt levels is critical to
6 Department of Finance, Exchequer Statements (various).
ensuring fiscal stability and supporting ongoing investment in economic and social infrastructure (e.g. transport, energy, environmental and ICT infrastructure, education, research and health) which enhance our national competitiveness.
1.3
Mixed fortunes for Ireland’s exporting sectors
Although strong growth in the domestic economy replaced exports as the key driver of economic growth in recent years, Ireland remains a major trading nation. While GDP declined sharply in 2009, net exports contributed positively by 4.9 percentage points to GDP8. The increased contribution of
net exports to GDP is primarily driven by a sharp fall in imports (Fig. 4.07). The decline in Ireland’s exports (1.8 per cent) in 2009 was modest compared to the sharp declines experienced by other countries (Fig. 4.08). Exports fell by 14.1 per cent in the euro area and by 13.6 per cent in the OECD9.
World trade growth is recovering following a sharp decline in late 2008 and early 2009, led by a strong rebound in trade volumes in many Asian economies. This has particularly helped trade in OECD economies with strong trading links with Asia while the pick-up in trade in many European countries has been more sluggish than elsewhere. A weak euro will support exports to countries outside of the euro area. The pace of recovery in Europe is critically important for Ireland’s export performance given that almost two thirds of our exports are to markets within the EU (Fig. 4.06). Stronger growth in the volume of exports is predicted in 2010 for the OECD (8.7 per cent) and the euro area (7.9 per cent) than for Ireland (3.6 per cent) but this needs to be seen in the context of significantly larger declines in trade in 2009 in the OECD and the euro area than in Ireland10. The
ESRI forecasts a 5.25 per cent increase in Irish exports in 2011 as global demand improves.
Ireland’s world share of goods has declined but the share of services has continued to grow (Fig. 4.09). Overall Irish exports declined by 1.8 per cent to €152 billion in 2009 with merchandise exports contributing 55 per cent and services exports 45 per cent11. While services exports
increased marginally (0.2 per cent), merchandise exports declined by 3.4 per cent. Within merchandise exports, medical and pharmaceutical products now make up 23 per cent of total merchandise exports, having grown by 17 per cent in 2009 to €19.6 billion. Other chemical products (€27.7 billion) accounted for 33 per cent of merchandise exports in 2009. The largest declines in goods exports were in electrical machinery (-31 per cent) and computer equipment (-29 per cent). In terms of services exports, business services exports increased by 12 per cent while tourism and travel declined by 18 per cent and financial services by 11 per cent12.
While Ireland’s trade performance has offset some of the sharp impact of the domestic recession, it is a concern that our export success is largely based on the performance of a small number of sectors and that our export performance is dominated by foreign owned firms (Fig. 4.13). While foreign owned companies accounted for almost 90 per cent of total Irish exports in 2008, this
8 CSO, Quarterly National Accounts, March 2010.
9 Figure for Ireland is based on actual data for 2009 while the comparative figures are based on based on OECD estimates for 2009. The OECD has estimated that exports in Ireland declined by 2.2 per cent in 2009.
10 OECD, OECD Economic Outlook, May 2010.
overstates their economic impact. The contribution of indigenous and foreign owned trading sectors to employment and direct expenditure on goods and services within the local economy is similar.
In terms of export performance, there are some sectoral variations; Irish owned companies make up a significant share of the agriculture, food, drink and tobacco sector (53 per cent), business,
financial and other services sectors (46 per cent) and traditional manufacturing (41 per cent). The destination markets also vary by ownership. Exports from Irish owned companies are more
concentrated in the UK, while over half of foreign owned companies’ exports go to EU markets other than the UK13. Overall, Irish exporters are more exposed to exchange rate risks (euro –
sterling, euro – dollar) than exporters in other euro area economies. Outward direct investment from Ireland remains strong (Fig. 4.05).
Given our reliance on foreign direct investment, it is of concern that, in spite of Ireland’s continued success as a location for foreign investment, a range of indicators suggest that our performance is weakening - the rates of return on US investment here have fallen (Fig.4.04) and other countries have aggressively targeted new overseas investment (Fig. 4.02 and Fig. 4.03). In light of our export dependence, and particularly our reliance on exports of foreign owned companies, restoring
investment levels in productive capacity (rather than property) and maintaining our attractiveness as a location for inward investment are major challenges. Ireland retains important strengths as a location for foreign direct investment - including a long track record as a successful location for overseas investors, a modern internationally trading enterprise base and growing levels of research and development activity
1.4
Cost competitiveness is improving – but not enough
Ireland experienced a significant loss in cost competitiveness (real harmonised competitiveness indicator (HCI)) over the past decade reflecting a combination of an appreciation of the euro against the currencies of many of our trading partners and higher price inflation in Ireland (Fig. 4.23). Since January 2008, Ireland has regained some of its competitiveness as domestic inflation remains below that of our main trading partners and the euro weakened – in May 2010, Ireland’s real HCI had fallen 6.1 per cent below its January 2005 position. However, Ireland’s real HCI is still 16 per cent above its 2000 level.
Improving our relative cost competitiveness requires the cost of doing business in Ireland to fall relative to that of our trading partners. Although prices in Ireland have moderated in the past year, particularly property and energy prices, a range of key business inputs in Ireland remain relatively expensive. The data suggests that prices have remained high in sectors that are not exposed to international competition and are sheltered from the full rigours of domestic competition (e.g. administered prices such as waste water costs, legal fees, education and health costs).
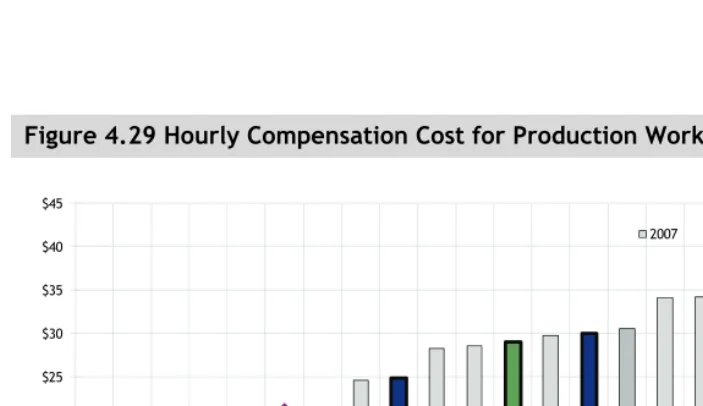
Ireland has the tenth highest total labour costs level in the OECD and is in line with a number of western European countries. Ireland has the fifth highest net wage level in the OECD-28, 35.5 per
cent above the OECD-28 average. This is due, in part, to Ireland’s low tax wedge on labour (Fig. 4.24).
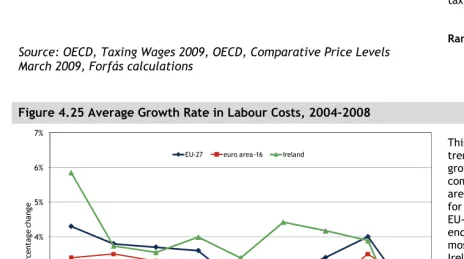
Labour cost growth rates show the change in the cost of employing workers over time. Ireland’s growth rates exceeded the euro area average between 2004 and 2007. However, growth rates in Irish labour costs slowed significantly in 2008 and the first half of 2009 and were lower than the EU-27 and euro area-16 average (Fig. 4.25).
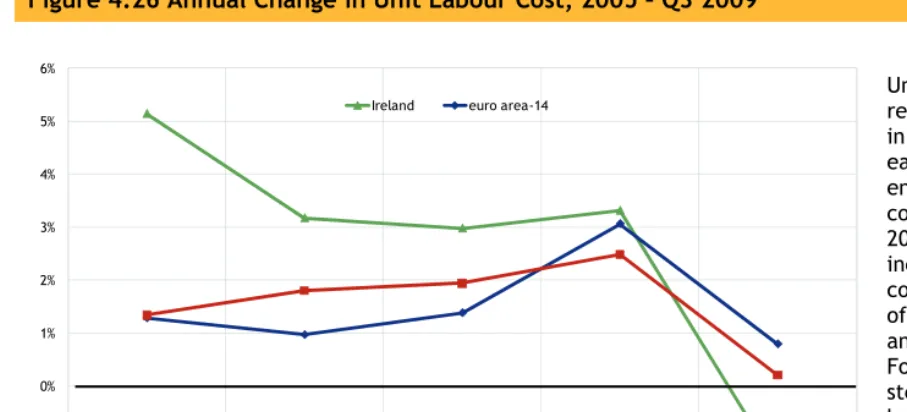
Unit labour costs measure the average cost of labour per unit of output. Declining unit labour costs mean that productivity has increased faster than earnings – thus indicating an improvement in competitiveness. While the rate of growth in Irish unit labour costs significantly exceeded the OECD and euro area averages between 2005 and 2008, unit labour costs in Ireland fell by 1.5 per cent during the first three quarters of 2009. Meanwhile, average OECD and euro area unit labour costs continued to grow, albeit slowly – the OECD average grew by 0.2 per cent and the euro area average rose 0.8 per cent (Fig. 4.26). Therefore, at an economy wide level, Irish labour wage rates – when adjusted for productivity – are becoming more cost competitive. Again, the data highlights that unit labour costs are improving fastest in the internationally trading manufacturing sector rather than more closed sectors of the economy (Fig. 4.27).
There have been significant declines in the cost of constructing or renting a prime industrial site or prime office space in Ireland since 2008. While the cost of renting prime office space in Ireland is relatively competitive (Fig. 4.34), other property related costs remain among the highest of the benchmarked countries (Fig. 4.31 - Fig. 4.33).
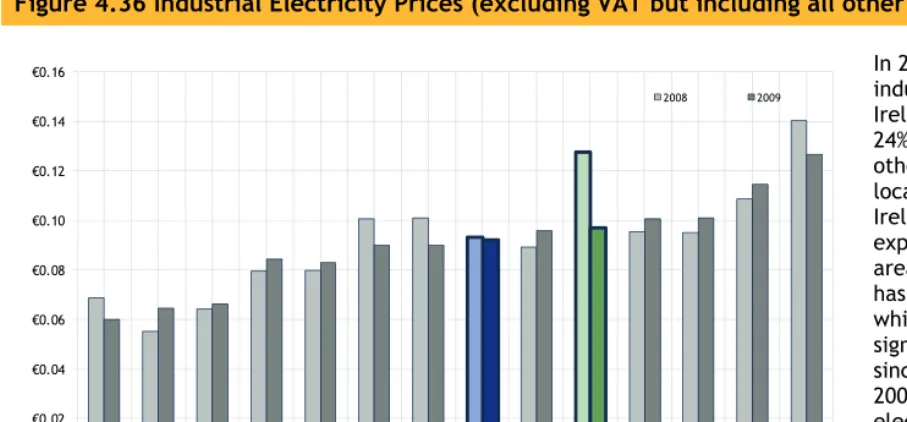
Ireland’s cost competitiveness performance on utilities is mixed. The gap between the industrial price of electricity in Ireland and the euro area average has narrowed significantly in 2009; it is now five per cent above the euro area average. This downward adjustment is largely due to the steep decline in global fuel prices (gas and coal) and temporary rebates for large business users which are to be phased out by the end of 2012 (Fig. 4.36).
The cost of water services in Ireland compares favourably with our main trading partners.
Comparative data is not available for waste water services but Ireland’s waste water services costs increased by 18.8 per cent during 2009 (Fig. 4.40).
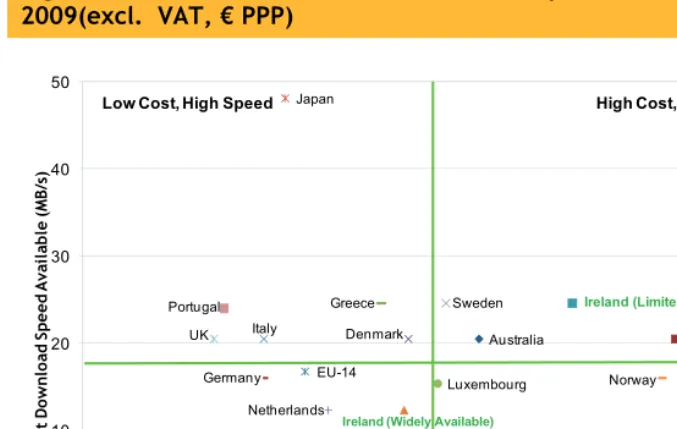
The cost of the most widely available (fixed) broadband service in Ireland compares favourably with the EU average. However, it offers relatively low speeds. Where higher speeds are available, the costs compare poorly with the EU-14 average (Fig. 4.38). The challenge for Ireland is to increase the quality of broadband services. In 2008, Irish businesses faced the highest waste costs (landfill) of the benchmarked locations (Fig. 4.39). Although market prices in Ireland have fallen recently due to the recession, international data is not available to ascertain whether our relative cost competitiveness has improved. The Eunomia review of waste policy noted that it is extremely difficult to reconcile the costs of providing the service with the charges levied, unless one assumes very high levels of inefficiency, or high levels of profit14.
14 A consortium of consultants (led by Eunomia Research and Consulting) was commissioned to undertake a review of Irish waste policy in 2008. Their report, which was published in November 2009, is available at:
Based on experimental data from the CSO, the cost of accounting services fell significantly from their Q1 2008 peak15. There have only been marginal declines in legal fees in Ireland during 2009
(Fig. 4.42). While it is difficult to accurately compare legal fees internationally because of different national legal systems, based on the cost of enforcing a contract following a commercial dispute, Ireland ranks fourth most expensive (Fig. 4.43).
For the most part, recent price falls in Ireland are a cyclical response to the Irish and international recession (e.g. reduced demand leading to spare capacity, falling interest rates, falling
international fuel and food prices) rather than a response to structural changes in the Irish economy.
1.5
Significant room for improvement in Ireland’s productivity performance
In spite of moderating price levels, Ireland remains an expensive country in terms of the costs of doing business. A reduction in our cost base can play an important role in restoring our
competitiveness but we also need to increase productivity across the economy.
Using the more appropriate GNP per hour measure, Irish productivity levels remain below the OECD average (Fig. 4.15). In addition to the weak performance on productivity levels, Ireland’s
productivity growth rates are also a cause for concern (Fig. 4.16). Not only were average annual Irish GNP-based productivity growth rates significantly below the OECD average over the period 2005-2009, they had fallen considerably from the earlier period, 2001-2005. Ireland ranked 24th in
the OECD in terms of GNP-based productivity growth between 2008 and 2009.
Innovation is critical to improving our productivity performance. In terms of innovation performance (based on a composite indicator which includes knowledge intensive exports as a percentage of total exports, and levels of business R&D and IT expenditure), Ireland ranks above the euro area average. However there has been little change in Ireland’s score since 2005 (Fig. 4.17). Meanwhile most other countries with which we compete in international markets have improved their performance. The percentage of turnover attributed to innovative activity in Ireland declined between 2006 and 2008 (Fig. 4.19).
Investment in technology and better use of technology can also play a key role in enhancing
productivity across the economy. Ireland’s investment in ICT was 5.7 per cent of GNP (and five per cent of GDP) in 2008 which is ahead of the euro area average (five per cent) but behind leading countries such as the UK (6.9 per cent of GDP), US (6.6 per cent) and Japan (6.3 per cent) (Fig. 5.35). A greater proportion of enterprises’ total turnover is generated from ecommerce in Ireland than the euro area average (Fig. 4.14).
1.6
Tackling unemployment/creating jobs is the most pressing challenge
Nowhere is the severity of the recession more evident than in the huge numbers of people who have lost their jobs. Unemployment has risen sharply and is now a key challenge (Fig. 4.45). Outward migration is growing (Fig. 4.53) and participation rates in the labour force are falling (Figs. 4.55 and 4.56) – potentially a result of a lack of job opportunities and in part the disincentive effect of the increase in Ireland’s tax wedge on labour. More positively, it could indicate that people are returning to education. From a competitiveness perspective, skills availability is a growing strength.
While almost all countries are experiencing high unemployment, in May 2010, Ireland has the third highest unemployment rate in the OECD at 13.3 per cent (Fig. 4.47). The unemployment rate in the OECD-28 averaged 8.5 per cent in May 2010, while it was 9.7 per cent in the US, 7 per cent in Germany and 5.2 per cent in Japan. The UK had an unemployment rate of 7.9 per cent in Q1 201016. The ESRI forecasts that unemployment in Ireland will increase to 13¼ per cent by the end
of 2010, which means that about a quarter of a million people will have lost their jobs between 2007 and 201017.
While the steep rise in unemployment has affected people across society, those with lower
educational attainment are more likely to be unemployed (Fig. 4.50). In Q1 2010, 21.5 per cent of people with no more than lower secondary education were unemployed compared to 6.1 per cent of those with a third level degree or above. Unemployment rates are also higher among younger workers (Fig. 4.49). Almost one third of 15-19 year olds and one quarter of 20-24 year olds were unemployed in Q1 2010 compared to the national rate of 12.9 per cent18. According to Eurostat,
youth unemployment (under 25’s) in Ireland in Q1 2010 was higher (26 per cent) than the euro area average (22.5 per cent) (Fig. 4.48). The increase in long-term unemployment is also of concern – it accounted for 41 per cent of total unemployment in Q1 2010 compared with 22.2 per cent a year earlier19.
In addition to higher unemployment among younger workers, Ireland is also seeing a steeper drop in participation rates among younger workers (Fig. 4.56). The decline in participation levels in the under-25 age groups was much steeper than the fall in total participation rates between Q3 2007 and Q1 2010. This is likely to be due to those who left school/college early during the boom years returning to full time education or to outward migration. The percentage of 21 years olds in education increased from 27 per cent in Q3 2007 to 36 per cent in Q3 2009 while CAO applications are up ten per cent in 2010. Returning to education has the potential to boost long term national competitiveness as people re-skill. Outward migration is also expected to increase significantly – the ESRI estimates net outward migration of 70,000 people in 201020.
According to the OECD, countries in which there has been an unusually large downward adjustment in hours, but relatively little adjustment in employment levels, employment growth will likely be
16 OECD, Labour Force Statistics, June 2010. 17 ESRI, Quarterly Economic Commentary, July 2010.
more subdued as activity recovers as there will be considerable scope for expanding hours worked per employee. Relatively fast employment growth in the recovery phase might be expected in countries in which there have been unusually large employment losses, but a less pronounced downturn in hours worked21. Ireland falls into the latter category as up to Q2 2009 (latest data
available), the decline in hours worked was less than three per cent. While there are risks of workers disengaging from the labour force as they enter long term unemployment, the quantity and quality of people available for work provides significant potential for recovery if we can enhance our competitiveness.
1.7
Access to and cost of credit remains a major concern
The availability of credit has become more restrictive in Ireland than internationally and it remains more expensive across most loan/credit categories. As credit growth in Ireland falls from the unsustainable levels of recent years, it is critical that viable businesses do not face obstacles to access credit through the tightening of credit standards or the high cost of capital. Developing new lending products and practices (e.g. software/IP based companies) to support exporting SMEs is a particular challenge.
Access to finance and its cost are critical issues for enterprise as international markets return to growth and exporters require greater access to credit – especially at a time when euro area interest rates are likely to increase. Irish borrowers continue to pay more for lending services than their euro area counterparts. Interest rates for loans to non-financial companies fell in Ireland during 2009, but they also declined by a similar amount in the euro area (Fig. 5.09). Irish companies also face consistently higher interest rates for overdraft facilities than the euro area average (Fig. 5.10). In addition, credit standards in Irish banks remain tighter than for their euro area counterparts (Fig. 5.12). The tightening of credit standards have been attributed to increases in the costs of funds for the banks and balance sheet constraints.
Access to early stage finance and venture capital is essential to enable the development of new businesses. Ireland performs well in terms of the amount of venture capital investment as a percentage of GDP in 2008; it ranked seventh in the OECD (Fig. 5.13). In terms of total private equity investment as a percentage of GDP, Ireland ranks 14th of the EU-14, reflecting the limited sources of private equity available for businesses in Ireland outside of venture capital (Fig. 5.14).
1.8
Prioritising investment to support the smart economy is critical
Ireland has made significant progress in terms of improving our physical, educational and research infrastructure. Despite progress, we remain behind leading countries on a range of important metrics. It is a major challenge to maintain progress in the context of significant but tightening public investment levels. In 2009, direct capital expenditure by Government amounted to €7.22 billion. This is set to fall to €6.45 billion in 2010 and €5.5 billion per annum for the years 2011-2013 which represents a significant reduction on funding allocations set out in the National Development Plan 2007-201322. The distribution of the reduction in capital spending is not yet clear.
21 OECD, OECD Economic Outlook, November 2009.
Although Ireland invested heavily in infrastructure in the past decade, perceptions of the overall quality of infrastructure remain poor (Fig 5.28)23. The upgrading of the main urban routes from
Dublin to the other main cities is leading to reduced journey times and safer journeys on our busiest roads. Nonetheless, Ireland continues to face a range of infrastructure challenges. For example, there are significant weaknesses in terms of broadband speeds, distribution infrastructure, public transport and cycle lanes, water and waste infrastructure and natural gas storage capacity.
Advanced communications networks and services are essential to support the development of the smart economy. In spite of significant progress in recent years on coverage and take-up, Ireland still lags other developed economies in terms of the price (Fig. 4.38) and quality/speed of service available (Fig. 5.36 and Fig. 5.37). The proportion of broadband connections above 10 megabits per second in Ireland increased from five per cent in July 2009 to nine per cent in January 2010, but this is still significantly lower than the leading EU countries such as Portugal (61 per cent), Belgium (41 per cent) and Denmark (35 per cent) (Fig 5.36). Ireland remains behind leading countries in terms of upgrading to fibre and offering very fast broadband speeds - only 0.6 per cent of connections in Ireland are fibre compared to 11.3 per cent in the OECD-28 (Fig. 5.37).
Ireland’s waste management performance compares poorly to other countries. Irish businesses have more limited waste infrastructure options (e.g. there are no commercial incineration facilities available) compared to their international competitors (Fig. 3.17).
In terms of broader environmental performance, although Ireland has made strong progress in the share of renewable electricity despite limited hydro opportunities (Fig. 5.32), the overall share of energy from renewables remains low and Ireland is among the highest carbon emitters in the OECD (Fig. 3.16). Dublin ranked 16th among 30 European cities in terms of a composite index of ‘green’
water performance and 30th in terms of ‘green’ transport (Fig. 5.33).
Ireland’s younger population is considerably better qualified than older workers, with 44 per cent of the 25-34 age cohort possessing a third level qualification compared to the OECD average of 39 per cent (Fig. 5.49). Ireland produces significantly more maths, science and computing graduates per 1,000 of population aged 20-29 than the euro area average (Fig. 5.51). However, in Ireland science and computing dominate this category which means that Ireland is producing a limited supply of mathematics graduates.
Although there has been a significant increase in R&D activity in recent years in terms of R&D expenditure and number of researchers, Ireland continues to lag competitor countries. The recently published Europe 2020 Strategy sets a target for EU countries to invest three per cent of GDP in R&D by 2020 (Box 1 below). Irish R&D expenditure as a percentage of GNP was 1.7 per cent in 2008 compared to an OECD average of 2.4 per cent of GDP (Fig. 5.54). The number of researchers per 1,000 in employment in Ireland in 2008 was six which remains substantially below the OECD-27
average of 8.5 (Fig. 5.55). Data is not available on the rates of return on R&D investment across countries.
1.9
Conclusions
Ireland has made significant and real economic progress in recent decades. Broader measures of quality of life have also improved markedly. Despite the bursting of the property bubble and its hugely damaging implications for the wider economy, Ireland remains a relatively wealthy country with significant competitiveness strengths and opportunities. Exporting sectors are already contributing to the turnaround in the economy. While dealing with the economic and social ramifications of the collapse in the property bubble, Ireland must remain ‘open for business’ by improving the competitiveness of both the exporting sector and the domestic economy which is essential to restoring economic growth and jobs.
Box 1. EU Competitiveness Priorities24
The main objectives of the Europe 2020 Strategy are to:
develop an economy based on knowledge and innovation;
promote a more resource efficient, greener and more competitive economy; and
foster a high-employment economy delivering social and territorial cohesion. To achieve these objectives, the European Commission proposes five specific targets:
invest three per cent of EU GDP in R&D;
increase labour participation to 75 per cent;
reduce the early school dropout rate to ten per cent and ensure at least 40 per cent of 30 - 34 year olds have tertiary education;
reduce greenhouse gas emissions by at least 20 per cent, increase the share of
renewable energy to 20 per cent of energy consumption and increase energy efficiency by 20 per cent; and
reduce the number of Europeans living below the national poverty lines by 25 per cent. Ireland performs relatively well on the early school dropout rate (11.3 per cent) and the
percentage of 25 - 34 year olds with a tertiary degree is also significantly higher in Ireland (43.9 per cent) than in the euro area (29.7 per cent). Ireland’s environmental performance is mixed – we are one of the highest carbon emitters on a per capita basis but we are on target to meet our 2010 renewable energy target. Ireland’s labour market participation is considerably lower than the EU 2020 target as is the percentage of GDP Ireland invests in R&D.
24 Europe 2020 Strategy:
Chapter 2
2.
Methodology
Competitiveness refers to the ability of firms to compete in markets. Ireland’s national
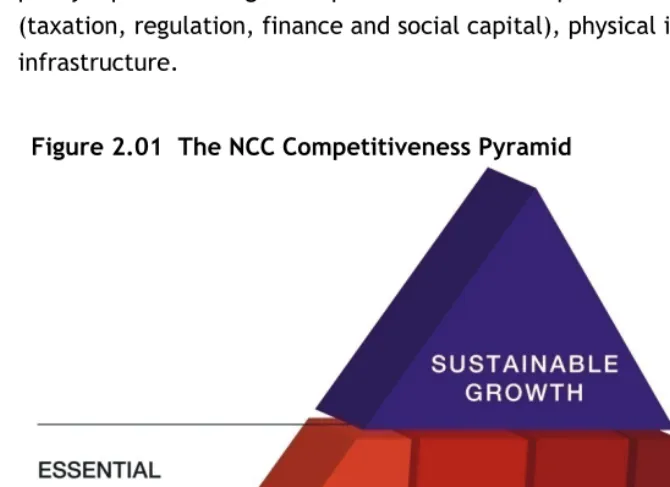
competitiveness refers to the ability of the enterprise base in Ireland to compete in international markets. The NCC uses a competitiveness pyramid to outline the framework within which it assesses Ireland’s competitiveness (Figure 2.01).
At the top of the pyramid is sustainable growth in living standards – the fruit of past
competitiveness success. Below this are the essential conditions for achieving competitiveness, including business performance (such as trade and investment), productivity, prices and costs and labour supply. These can be seen as the metrics of current competitiveness. Lastly, there are the policy inputs covering three pillars of future competitiveness, namely the business environment (taxation, regulation, finance and social capital), physical infrastructure and knowledge
[image:22.729.78.413.328.572.2]infrastructure.
Figure 2.01 The NCC Competitiveness Pyramid
Source: National Competitiveness Council
2.1
How to read this report
The rest of this report is divided into three main sections - sustainable growth (chapter 3), essential conditions for competitiveness (chapter 4) and policy inputs (chapter 5) - which correspond to the segments of the competitiveness pyramid.
This report uses internationally comparable metrics, with the OECD, the EU, the UN, IMF and the WTO, as the sources for the majority of indicators. Indicators from specialist international
25 The OECD is the preferred comparator group. However, in some cases depending on data availability, rankings are provided relative to the group of countries shown or to the EU-15. Where the sample is incomplete for the comparator group due to data availability, the countries omitted are detailed in the footnotes. OECD rankings and averages are based on a maximum of 28 countries. Turkey and Mexico are not included in the analysis, in part due to how their size and income levels affect averages and in part due to data availability. The OECD-28 countries are as follows: Australia, Austria, Belgium, Canada, Czech Republic, Denmark, Finland, France, Germany, Greece, Hungary, Iceland, Ireland, Italy, Japan, Korea, Luxembourg, Netherlands, New Zealand, Norway, Poland, Portugal, Slovak Republic, Spain, Sweden, Switzerland, UK and the US.
Where further depth is of benefit, national sources such as the Central Bank, the CSO, the ESRI and Forfás are used.
Ireland’s performance is benchmarked against 18 other countries. Countries have been chosen to provide a mix of euro area members (Finland, France, Germany, Italy, the Netherlands and Spain), other non-euro area European countries (Denmark, Sweden, Switzerland and the UK), and two newer EU member states (Hungary and Poland). Six non-European countries which are global leaders or are of a similar size or pace of development to Ireland are also included. These countries are Israel (where data is available) Japan, South Korea, New Zealand, Singapore, the US This allows for a detailed comparison between Ireland and many of its closest trading partners and competitors. Ireland is also compared to a relevant peer group average, the OECD-28, or the euro area-16 average where possible or else compared to as wide a group of countries as possible25.
Averages are weighted by each country’s population or GDP average where relevant.
Benchmarking competitiveness is useful - it informs the policymaking process and raises awareness of the importance of national competitiveness to Ireland’s wellbeing. Nonetheless, there are limitations to benchmarking:
While every effort is made to ensure the timeliness of the data, there is a natural lag in
collating comparable official statistics across the selected countries. There are also factors that are difficult to benchmark (e.g. the benefit of being in the GMT time zone or of speaking English fluently);
Secondly, given the different historical contexts and economic, political and social goals of various countries, and their differing physical geographies and resource endowments, it is not realistic or even desirable for any country to seek to outperform other countries on all measures. There are no generic strategies to achieve national competitiveness; and
26 F denotes forecast for 2010.
2.2
Interpretation of the charts
We have endeavoured to ensure that all charts are self-explanatory. However, with reference to the sample chart below, the following points may be of value when interpreting the charts:
[image:24.729.84.535.173.427.2]Figure 3.01: Sample Chart
Fig. 3.01 Levels of GDP per capita in constant prices (US$ PPP), 2010F26
In terms of GDP per capita, Ireland ranks as one of the wealthiest countries in the OECD. In terms of GNP per capita, a better measure of Irish living standards, Ireland ranks below the OECD-28 average and is close to the euro area-16 average. Irish GNP per capita is forecast to fall by 3.3% between 2005 and 2010 by this measure.
OECD-28 ranking: GDP: 9th (↓5) GNP 18th (↓7) Source: IMF, World Economic Outlook, April 2010
The best performing country is located at the left of the chart (in vertical bar charts) or at the top of the chart (in horizontal charts). In a limited number of charts, it is not possible to designate a best performer.
In charts that assess output/income or other factors relative to these, Irish figures are provided in GDP and GNP terms. GDP (national output) is significantly greater than GNP (national
income) in Ireland due to the repatriation of profits and royalty payments by multinational firms based here. Other countries are assessed in GDP terms.
The text at the right of the chart provides additional information and commentary on Ireland’s performance across each indicator.
The majority of chart titles are given a traffic light colour, green, orange or red, in order to provide a general indication of Ireland’s performance. Green indicates a strong performance (top third of OECD-28, euro area, or comparator group), orange signals an average performance, while red means that Ireland is ranking within the bottom third of the OECD-28, euro area, or comparator group. Certain indicators, which are not ranked, are also given a traffic light colour, in which case the colour is determined (somewhat subjectively) based on Ireland’s performance over time.
Rankings are provided where appropriate, but in a limited number of charts, it is not possible to designate a best performer - these chart titles are coloured grey. In charts with both GDP and
$10,000 $15,000 $20,000 $25,000 $30,000 $35,000 $40,000 $45,000 $50,000 $55,000
Si
ng
ap
o
re US
Swi
tz
er
la
nd
Ne
th
er
la
nd
s
OE
C
D
-2
8
Ir
el
an
d G
D
P
Swed
en
Denm
ar
k
UK
Ger
m
any
Fr
an
ce
Fi
nl
an
d
Ja
pa
n
eur
o
a
rea
-1
6
Ire
la
nd
G
N
P
Sp
ai
n
So
ut
h K
o
re
a
It
al
y
Is
ra
el
N
ew
Z
eal
an
d
H
ung
ar
y
Po
la
nd
GNP performance for Ireland, Ireland’s ranking is based on the GNP ranking, with the exception of tax related indicators which are based on the GDP ranking.
In interpreting the ranking for each indicator, a low ranking (i.e. close to 1st) implies a
healthy competitiveness position, while a high ranking implies an uncompetitive position.
Changes in rankings refer to the change in Ireland’s position, generally since 2005. Exceptions to this base year are highlighted in footnotes.
( ) refers to an improvement in Ireland’s competitive position, so 4 means an
improvement of four places in Ireland’s ranking. (--) means that there has been no change in Ireland’s ranking, while ( ) refers to a fall in ranking.
Chapter 3
3. Sustainable
Growth
Sustainable Growth
National Income
Quality of Life
Environmental
Sustainability
Fig 3.01: Levels of GDP per capita in constant prices
OECD-28 GDP:9 (5) ; GNP:18 (7)
Fig 3.02: Average Growth Rate in GDP per Capita
OECD-28: GDP: 28 ; GNP: 28
Fig 3.03: Contribution of Net Exports to GDP
Fig 3.09: Old Age Dependency Ratio
OECD-28: 2nd in 2007, 8th in 2050
Fig 3.04: Balance of Payments on Current Account
Fig 3.10: Public Expenditure on Pensions (as a % of GDP)
euro area-16: 1st in 2007 and 3rd in 2060.
Fig 3.11: At Risk of Poverty Rate
euro area-16: 11(↑3)
Fig 3.12: Inequality of Income Distribution
euro area-16: 11 (↑1)
Fig 3.14 Life Expectancy
OECD-28: Males: 13 (↑5) Females: 20 (↑2)
Fig 3.16: % of Energy from Renewable Sources and per
capita CO2 Emissions from
Fuel Combustion
OECD-28: Renewable: 22(--) C02 emissions: 21(--)
Fig 3.15: Environmental Performance Index
OECD-28: 20 (--)
Fig 3.05: General Government Consolidated
Debt (as % of GDP)
Traffic Light Colours:
Green = a strong performance.
Orange = an average/stable performance.
Red = a poor performance.
Grey= no traffic light colour is applicable Fig 3.06: Spread on 10 Year
Government Bond Yields over the German Benchmark
Fig. 3.08 Household Savings Ratio
Fig. 3.07 Household Borrowing per capita
euro area-13: 12 (--)
Chart 3.A
Fig. 3.13 UN Human Development Index
OECD-28: 5 (↑13) Fig 3.17 Municipal Waste
euro area-16: Waste generated: 15 highest
National Income
Good living standards are a key measure of the success of national competitiveness. The indicators in this section cover the level, growth and drivers of Ireland’s national income.
Irish living standards have fallen significantly, but in terms of GNP per capita (the most relevant measure of living standards) Ireland remains close to the euro area average. Ireland experienced a severe contraction in GNP per capita in 2008 (-2.6 per cent) and 2009 (-10.5 per cent) and Irish living standards in 2010 will have fallen back to 2004 levels. Despite the severe recession, Ireland remains a relatively high-income country (Fig. 3 .01). The ESRI forecasts GNP per capita (in constant prices) to rise by 0.25 per cent in 2010 and 2.5 per cent in 201127.
It is also important to consider the drivers of economic growth. Investment collapsed in 2008 and 2009 and consumption has also declined sharply leading to severe declines in GDP/GNP. While the collapse of the construction bubble has reduced Irish income levels, growth in net exports in 2009 and Q1 2010 (exports minus imports) has offset some of this collapse. The growth in net exports has been primarily driven by a sharp fall in imports (Fig. 3.03). The ESRI forecasts a 4.75 per cent rise in the value of exports of goods and services in 2010 and a 5.25 per cent increase in 2011 as global demand recovers28. Ireland’s current account performance improved significantly in 2009 – the
deficit narrowed from 6.1 per cent of GNP in 2008 to 3.7 per cent in 2009. The sharp reduction in the balance of payments on the current account indicates that Ireland is paying back borrowings by reducing investment and consumption and growing net exports (Fig. 3.04). The ESRI forecasts that the current account will move into balance in 2010 and that there will be a surplus of 0.25 per cent of GNP in 2011 which suggests that, while painful, the country is better placed to return to
sustainable economic growth29.
While very high private debt levels in Ireland are beginning to fall, there has been a very significant increase in government debt due to the sharp decline in revenues arising from the collapse in the construction sector (i.e. falling revenue from property taxes) and the general recession (falling revenue from taxes on incomes, sales and profits). Ireland’s general government debt as a percentage of GDP has risen sharply from 25 per cent at the end of 2007 to an estimated 64.5 per cent at the end of 2009. Irish government debt as a percentage of GDP is converging rapidly on the euro area average and is expected to reach 87 per cent by the end of 2011 (Fig. 3.05). The cost of borrowing for the Irish Government remains at a significant premium over German levels (Fig. 3.06). The risk premium on Irish bonds reflects uncertainty about the sustainability of public finances at European level as well as ongoing uncertainty internationally over Ireland’s ability to restore the public finances to stability and the economy to the growth levels required to repay our borrowings.
Ireland is the second most indebted euro area country in terms of private household debt30.
Ireland’s household debt per capita peaked at €37,464 in 2008 but has since moderated to €33,760 by the end of March 2010 as households reduce consumption, increase savings and pay back debt
27 ESRI, Quarterly Economic Commentary, July 2010. 28 Ibid.
29 Ibid.
(Fig. 3.07). Over the 2005-2008 period the annual average household savings rate in Ireland was 4.6 per cent. In 2009, the savings rate was 12.3 per cent in Ireland which is significantly higher than the OECD average (Fig. 3.08).
In addition to the current challenges Ireland must face, we also need to be aware of longer term challenges. Ireland is currently benefiting economically from a relatively young population but will face significant population ageing in the decades to come. To maintain current living standards in the future means that we need to start planning for this now. Population ageing will put upward pressure on public expenditure on pensions in many developed countries. Dependency ratios measure the number of people over 65 relative to the number of working age. Ireland had a favourable demographic position with a dependency ratio of 17.4 per cent in 2007 compared with the OECD average of 26 per cent (Fig. 3.09). In Ireland, public expenditure on pensions is set to rise to 10.5 per cent of GDP by 2050 (up from 5.2 per cent in 2007) which will put pressure on the public finances (Fig. 3.10).
Quality of Life
A key objective of competitiveness is to support a high quality of life, which is broader than material living standards or measures of national income.
At risk of poverty rates and income inequality levels in Ireland have improved and are converging on the euro area average (Fig. 3.11). In 2008, those in the top 20 per cent of the income distribution earned 4.5 times more than those in the bottom 20 per cent (Fig. 3.12). While the recession has lowered material living standards in Ireland significantly, data is not yet available on the impact of the recession across income groups. From an employment perspective, young men with low levels of educational attainment are most likely to be at risk of unemployment (Fig. 4.51 and Fig. 4.52).
To capture multifaceted quality of life, the United Nation’s Human Development Index measures economic, educational and health outcomes globally. Ireland is ranked among the highest countries in 2007 (fifth in the world), indicating a high quality of life (Fig. 3.13). Average life expectancy for Irish males and females was 77.4 and 82.1 years respectively in 2007. Life expectancy in Ireland has increased by five years over 1990 levels and is now similar to the OECD average (Fig. 3.14).
Environmental Sustainability
The essence of environmental sustainability is a stable relationship between human activities and the natural world which does not diminish the prospects for future generations to enjoy a quality of life at least as good as our own. This section examines Ireland’s broad environmental performance and also focuses specifically on energy, carbon emissions and waste management.
Ireland’s environmental performance is mixed. The composite environmental performance indicator ranks Ireland 20th in the OECD-28 (Fig. 3.15). Despite significant progress in recent years, Ireland’s
reflecting our high dependence on imported fossil fuels and very limited hydro potential31. In 2008,
3.9 percent of Ireland’s energy consumption (this includes electricity generation, transport and heating) came from renewable sources32. Ireland will have to meet 16 per cent of total energy
needs from renewable energy sources by 2020. Ireland is among the highest carbon emitters in the OECD on a per capita basis in part due to our transport and agriculture sectors (Fig. 3.16). In 2008, greenhouse gas emissions in Ireland were 67.44 Mt CO2 equivalent - a reduction of 0.3 per cent on 2007 but still significantly above the 62.84 Mt CO2-equivalent annual average target for the 2008-2012 period under the Kyoto Protocol.
Ireland generates significantly more waste than the euro area average. In 2008, Ireland landfilled 62 per cent of municipal waste which compares poorly with the euro area average of 32 per cent (Fig. 3.17). Ireland recycles 32 per cent of waste compared to the euro area average of 25 per cent.
31 Fig. 5.32 shows the share of renewable energy technologies in electricity generation.
3.1
National Income
Fig. 3.01 Levels of GDP per capita in constant prices (US$ PPP), 2010F
In terms of GDP per capita, Ireland ranks as one of the wealthiest countries in the OECD. In terms of GNP per capita, a better measure of Irish living standards, Ireland ranks below the OECD-28 average and is close to the euro area-16 average. Irish GNP per capita is forecast to fall by 3.3% between 2005 and 2010.
OECD-28 ranking: GDP: 9th (↓5) GNP: 18th (↓7) Source: IMF, World Economic Outlook, April 2010
Fig. 3.02 Average Annual Growth Rates in GDP per capita ($ PPP), 2010F33
This chart shows the average annual growth rate in GDP per capita for the period 2005-2009 and the latest forecast for 2010. Ireland experienced a long period of rising living standards until 2007. However, there was a severe contraction in GNP per capita in Ireland in 2008 (-2.6%), 2009 (-10.5%) and 2010F (-1.2%). As a result, Irish living standards in 2010 will have fallen back to 2004 levels.
OECD-28 ranking34: GDP: 28th
GNP: 28th Source: IMF, World Economic Outlook, April 2010
33 Growth rates are calculated based on gross domestic product per capita in purchasing-power-parity (PPP) adjusted in international dollar terms.
34 Base year for ranking change is 2010 relative to 2005. $10,000 $15,000 $20,000 $25,000 $30,000 $35,000 $40,000 $45,000 $50,000 $55,000 Si ng ap o re US Swi tz er la nd Ne th er la nd s OE C D -2 8 Ir el an d G D P Swed en Denm ar k UK Ger m any Fr an ce Fi nl an d Ja pa n eur o a rea -1 6 Ire la nd G N P Sp ai n So ut h K o re a It al y Is ra el N ew Z eal an d H ung ar y Po la nd
2010 F 2005
-4% -2% 0% 2% 4% 6% 8% So ut h K o rea Sing ap o re Po la nd US Ja pa n N ew Z eal an d OEC D -2 8 Sw it zer la nd Ge rm an y Fr an ce Is ra el Ne th er la nd s De nm ar k Sw ed en Fi nl an d UK eu ro a re a-16 Hu ng ar y Ita ly Sp ai n Ir el an d G D P Ir el an d G N P
Fig. 3.03 Contribution of Net Exports to GDP 2001-2010 Q1
The contribution of net exports (exports minus imports) to economic growth on a year-on-year basis was small or negative during the 2004-2007 period. Net exports however increased in 2008 and 2009, driven mainly by growth in services. Investment collapsed in 2008 and 2009 which has resulted in sharp declines in GDP and living standards. The contribution of net exports has improved in 2009 and Q1 2010, primarily driven by a steep fall in imports.
Ranking: N/A
Source: Forfás calculations, CSO National Accounts.
Fig. 3.04 Balance of Payments, Current Account Balance, (€millions), 2000-2011F
The current account balance is a measure of national income less expenditure. Ireland’s current account performance improved significantly in 2009 – the deficit narrowed from 6.1 per cent of GNP in 2008 to 3.7 per cent in 2009. The sharp reduction in the current account balance suggests that Ireland is paying back borrowings by reducing investment and consumption and growing net exports. The ESRI forecasts that the current account will move into balance in 2010 and that there will be a surplus of 0.25% of GNP in 2011.
Ranking: N/A
Source: Central Statistics Office; ESRI, Quarterly Economic Commentary, July 2010. -15%
-10% -5% 0% 5% 10%
2001 2002 2003 2004 2005 2006 2007 2008 2009 2010 Q1
Fig. 3.05 General Government Consolidated Debt (as a % of GDP), 2000-2011F
Ireland’s gross general government
consolidated debt as a percentage of GDP has risen sharply since 2007 to an estimated 64.5% at the end of 200935. Irish government debt as a percentage of GDP is converging rapidly on the euro area average and is expected to reach 87% of GDP by the end of 2011. The
Government has taken measures to curtail spending in an effort to restore the stability of the public finances. However the
Department of Finance forecasts a budget deficit of 11.6% in 201036.
Source: Eurostat, Economy and Finance; and European Commission, Autumn Economic Forecasts December 2009
Fig. 3.06 Spread on 10 Year Government Bond Yields over the German Benchmark, January 2008 - June 2010
This indicator measures the cost of borrowing for governments relative to the German benchmark level37. Bond yields in several euro area countries have been high and volatile recently reflecting market concerns regarding fiscal sustainability in the euro area. The cost of borrowing for the Irish Government remains at a significant premium over German levels.
Ranking: N/A
Source: Bloomberg
35 Department of Finance, Monthly Economic Bulletin, April 2010. 36 Department of Finance, Stability Programme Update, December 2009.
37 Bond markets require greater yields (effective interest rates for government debt) on assets perceived to be risky. 20%
30% 40% 50% 60% 70% 80% 90% 100%
2000 2001 2002 2003 2004 2005 2006 2007 2008 2009 2010 2011
euro area Ireland UK
0% 1% 2% 3% 4% 5% 6% 7% 8% 9% 10%
01/0
1/2008
01/0
2/2008
01/0
3/2008
01/0
4/2008
01/0
5/2008
01/0
6/2008
01/0
7/2008
01/0
8/2008
01/0
9/2008
01/1
0/2008
01/1
1/2008
01/1
2/2008
01/0
1/2009
01/0
2/2009
01/0
3/2009
01/0
4/2009
01/0
5/2009
01/0
6/2009
01/0
7/2009
01/0
8/2009
01/0
9/2009
01/1
0/2009
01/1
1/2009
01/1
2/2009
01/0
1/2010
01/0
2/2010
01/0
3/2010
01/0
4/2010
01/0
5/2010
01/0
6/2010
Fig. 3.07 Household Borrowing Per Capita, 2010 Q1
Ireland’s debt per capita increased rapidly in recent years and Ireland is the second most indebted euro area country38. Ireland’s debt per capita peaked at €37,464 in 2008 but has since moderated to €33,780 as households reduce consumption, increase savings and pay back debt. 73% of household debt in Ireland is mortgage debt and 15% is consumer credit.
euro area-13 ranking: 12th (--)
Source: European Central Bank, Aggregated Balance Sheet of euro area Monetary Financial Institutions
Fig. 3.08 Household Saving Ratio, 200939&40
The savings ratio is measured as a
percentage of household net disposable income. Over the 2005-2008 period the annual average savings rate in Ireland was 4.6%. In 2009, the savings rate was 12.3% in Ireland which is significantly higher than the OECD average. This consolidation of household balance sheets is necessary given high levels of borrowing but is having a negative impact on consumption, GDP and business confidence.
Ranking: N/A
Source: OECD, Economic Outlook Database 86, December 2009.
38 euro area minus Cyprus, Malta and Slovak Republic.
39 OECD-21 average minus Greece, Iceland, Luxembourg, New Zealand, Portugal, Spain and the UK as data is unavailable. 40 The household saving rate is calculated as the ratio of household saving to household disposable income. Saving rates may be measured on either a net or a gross basis. Net saving rates are measured after deducting consumption of fixed capital (depreciation) in respect of assets used in enterprises operated by households and in respect of owner-occupied dwellings from saving and from the disposable income of households, so that both saving and disposable income are shown on a net basis. €0 €10,000 €20,000 €30,000 €40,000 €50,000 €60,000 €70,000 Sl o venia Ita ly G reec e Be lg iu m Po rt ug al Fr an ce eu ro a re a-1 3 Au st ri a Ge rm an y Fi nl an d Sp ai n Ne th er la nd s Ir el an d Lu xe m bo urg
2010 Q1 2005
-2% 0% 2% 4% 6% 8% 10% 12% 14% 16% Sw ed en Sw it zer la nd Fr an ce Ir el an d Ger m
any Italy
Fig. 3.09 Old-Age Dependency Ratios, 2000-2050F41
Dependency ratios