DEVELOPMENT OF FENOFIBRIC ACID DRUG LOADED PELLETS
BY EXTRUSION SPHERONIZATION: A STATISTICAL DESIGN FOR
OPTIMIZATION OF PROCESS VARIABLES
Bala Vishnu Priya Mukkalaa*, Gopala Krishna Murthy Talasilab and Prameela Rani
Avulac
a
Formulation Research and Development, RA Chem Pharma Ltd, Hyderabad, Telangana,
India.
b
Department of Pharmaceutics, Bapatla College of Pharmacy, Bapatla, Guntur, Andhra
Pradesh, India.
c
Department of Pharmaceutics, Acharya Nagajuna University, Guntur, Andhra Pradesh,
India.
ABSTRACT
The objective of the present investigation was to develop a drug loaded
pellets of Fenofibric acid employing Extrusion spheronization process.
This study evaluates the impact of certain process variables of
extrusion spheronization technique in the feasability of producing
Fenofibric acid drug loaded pellets. Impact of various process variables
were assessed by using statistical interpretation such as ANOVA. A 33 (three factor, three level) face centered central composite design was
employed to study the effect of independent variables on dependent
variables. The selected process variables such as % Fluid uptake,
Spheronizer speed and Spheronization time were studied, as well as
their influences on the properties of Bulk density, % fines and %
retains were determined. Optimization was done by fitting experimental data to the software
program (Design Expert). The design space for process variables and its influence on
responses was developed. Low fluid uptake, Higher spheronization speed and time leads to
fines generation as well as high fluid uptake, low spheronization speed and time results in
agglomerates. Water content and spheronizer speed interaction influence the sphere density.
Fabricated pellets were characterized for various physico-chemical parameters. The
optimized formulation showed desired drug release profile. The information acquired in this
Volume 7, Issue 3, 1574-1588. Research Article ISSN 2277– 7105
*Corresponding Author
Bala Vishnu Priya
Mukkala
Formulation Research and
Development, RA Chem
Pharma Ltd, Hyderabad,
Telangana, India. Article Received on 18 December 2017,
Revised on 08 Jan. 2018, Accepted on 29 Jan. 2018
DOI: 10.20959/wjpr20183-10987
study recommends that the extrusion spheronization process can be effectively intended to
develop drug loaded pellets of Fenofibric acid.
KEYWORDS: Fenofibric acid, Pellets, Extrusion, Spheronization, CCD.
1. INTRODUCTION
Pharmaceutical invention and research are increasingly focusing on delivery systems which
enhance desirable therapeutic objectives while minimizing side effects. Now a days, the
multiparticulate drug delivery systems are notably relevant for attaining controlled or delayed
release oral formulations with reduced risk of local irritation, low risk of dose dumping,
increased bioavailability and less inter and intra subject variability.
Extrusion spheronization process is one of the most promising techniques for fabrication of
pellets, as it provides the pellets of uniform particle size, narrow size distribution, good
flowability, high strength and low friability. Extrusion- spheronization is a multiple-step
compaction process. The main objective of extrusion spheronization is to provide pellets of
uniform size with high drug loading capacity.[1-3]
Quality by design (QbD) is a holistic and proactive approach to support the pharmaceutical
development in a more scientific, risk based manner, by restricting the flexibility in the
manufacturing process to ensure predetermined product specifications. It helps to assess the
critical material attributes (CMAs) and critical process parameters (CPPs) that impacting the
predefined critical quality attribute (CQAs).[4]
Response surface methodology (RSM) is one of the popular methods in the development and
optimization of drug delivery systems. Central composite design (CCD), three level factorial
design, Box Behnken design and D-optimal design are the different types of RSM designs
available for statistical optimization of the formulations. Central composite design is one type
of RSM design enables, all factors to be varied simultaneously, allowing quantification of the
effects caused by independent variables and interactions between them. Face centered central
composite design contribute relatively high quality predictions over the entire design space
and do not require using points outside the original factor range. Hence face centered central
composite design was selected as design of experiment.[5]
Fenofibrate is a third-generation fibric acid derivative indicated for the treartment of primary
of fenofibric acid and is more hydrophilic than fenofibrate rapidly absorbed throughout the
gastrointestinal tract.[6,7] The literature survey reveals that the pellets were prepared by fluid bed process and mini tablets of Fenofibric acid.[8,9] Hence, the present investigation aimed to fabricate a drug loaded pellets of Fenofibric acid by employing extrusion spheronization
process. There are no reported studies available as present investigation. Preliminary studies
were carried out to freeze the process parameters which do not have any impact on product
quality, such as wet mixing time, extruder speed, extruder feed rate and drying time.
However, % fluid uptake, spheronizer speed and spheronization time are found as critical
process parameters.
2. MATERIALS AND METHODS
2.1 Materials
Choline fenofibrate was obtained from RA CHEM Pharma Ltd., Hyderabad as gift sample,
Microcrystalline cellulose (MCC PH101) (FMC Biopolymer, Mumbai), Povidone (BASF,
Mumbai), Polyethylene glycol (Clariant, Hyderabad), Hypromellose (Dow chemical’s,
Mumbai), Ethocel 45 cps (Colorcon, Goa), Eudragit L 30 D55 (Evonik), Triethyl citrate
(Merck, Mumbai), Talc (Luzenac, Mumbai), Isopropyl alcohol (Avantor, Hyderabad),
Purified water and empty hard gelatin capsule shells size 0 (ACG, Hyderabad) were used as
received.
2.2 Preparation of drug loaded pellets by Extrusion-spheronization process
2.2.1 Priliminary experimentation
Initial studies were conducted to establish viable ranges for experimental variables. Process
variables examined included all controllable equipment parameters. For the extruder, the die
orifice screen can be changed to produce extrudates of various diameters. Varying the speed
of extruder feeder drive (which controlls the feed rate) and extruder drive (which forces
material through the extruder screen) results in different extrusion pressure, and thus pellet
densification. Spheronizer crosshatch plate groove size can be selected based on the target
particle size. The shape of the pellets is influenced by spheronizer speed and residence time,
hence these two process parameters were selected as an experimental variables.
Water is critical variable which acts as a binder during wet granulation, a lubricant during
extrusion and a plasticizer during spheronization. From the preliminary trials, the effective
water concentration was found to be a function of MCC concentration. High water levels
spheronized. On the other hand, with high MCC and low water produced dry masses which
could not be extruded. Hence, the impact of % fluid uptake was studied by varying the
concentration between 17 to 23%w/w.
Throughout the study, the same composition (Table 1) was used, mainly consisting of Drug,
MCC PH 101 and povidone. Water was used as granulating agent. Preparation of drug loaded
pellets by extrusion and spheronization include sequence of multiple steps, as follows:
Wet granulation
Choline Fenofibrate, PVP K 30 and Microcrystalline cellulose PH 101 were sifted and
allowed for dry mixing for 10 minutes in Rapid mixer granulator (RMG). Binder was added
to the dry mix material and subjected for kneading. Wet mass was discharged from RMG.
Extrusion-spheronization
Wet mass was passed from 0.8mm die screen of extruder at an extruder speed of 30-40 rpm.
Extrudes were transferred immediately to the spheronizer fitted with cross-hatched plate
(groove size-1mm) with a spheronizer rotational speed of 500, 1000 and 1500 rpm. The
residence time in the spheronizer varied between 1 to 5 minutes.
Drying and Sizing
Pellets were collected and subjected for drying at 40°C-50°C till attain LOD not more than
2.5%w/w. The dried spheroids were sized to separate the desired size.
2.2.2 Preparation of Fenofibric acid delayed release (DR) pellets
Fenofibric acid DR Pellets were prepared by employing bottom – spray fluid bed (Wurster)
coating process (Glatt GPCG 1.1). The hydro alcoholic (IPA : Water 80:20) extended release
(ER) coating solution was coated over the drug loaded pellets prepared by extrusion
spheronization process, using 1.0 mm spray nozzle with a spray rate of 4-8 g/min, 1.0-1.2
Kg/cm2 of atomization air pressure, 50-65 cfm of air volume and at a product temperature of 34-38°C. The ER coated pellets were dried for 15 minutes at 34-38°C. Further, the aqueous
enteric coating dispersion was coated on to the ER coated pellets at 28-32°C as product
temperature and at a spray rate of 2-6 g/min. Enteric coated pellets were subjected for drying
at 35°C for 15 minutes. Final pellets were sifted through #14-#18 ASTM mesh to separate the
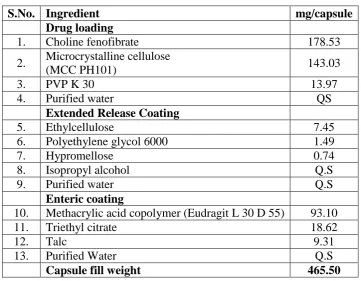
Table 1: Composition of the Fenofibric acid delayed release pellets.
S.No. Ingredient mg/capsule
Drug loading
1. Choline fenofibrate 178.53
2. Microcrystalline cellulose
(MCC PH101) 143.03
3. PVP K 30 13.97
4. Purified water QS
Extended Release Coating
5. Ethylcellulose 7.45
6. Polyethylene glycol 6000 1.49
7. Hypromellose 0.74
8. Isopropyl alcohol Q.S
9. Purified water Q.S
Enteric coating
10. Methacrylic acid copolymer (Eudragit L 30 D 55) 93.10
11. Triethyl citrate 18.62
12. Talc 9.31
13. Purified Water Q.S
Capsule fill weight 465.50
2.2.3 Experimental design
Experimental design is applied to reduce the number of trials, and is needed to attain the
maximum information on the product properties. The first step of experimental design is the
selection of parameters and the choice of responses. The variables (i.e. factors) of drug
loading process included the % fluid uptake, spheronizer speed and spheronization time. The
bulk density, percentage fines and percentage retains were used separately as the responses in
the mathematical modeling. This would help in the identification of the most significant
factor influencing the properties. A mathematical model was generated between the factors
and responses, for determining the levels of factors, which yield optimum responses.
The Face centered central composite design was used to evaluate the effect of critical process
parameters on responses/dependent variables (Bulk density (Y1), % Fines (Y2), and %
agglomerates (Y3)) of Fenofibric acid drug loaded pellets. A three factor, three level design is
used for exploring quadratic response surfaces and constructing second order polynomial
models with Design Expert (Stat-Ease).
Analysis of variance (ANOVA) is inevitably linked to experimental design, which was used
polynomial equations. The response (Y1) in each trial was estimated by carrying out a
multiple factorial regression analysis using the generalized quadratic model:
Y1 = b0 + b1X1+ b2X2+ b3X3 + b4X1X2+b5X2X3+b6X3X1+ b7X12+b8X22 +b9X32
Where Y1 is the measured response associated with each factor level combination; b0 is an
intercept; b1 and b2 are regression coefficients computed from the observed experimental
values of Y1; and X1, X2 and X3 are the coded levels of independent variables, X1 X2, X2 X3
and X3 X1 are the interaction terms and the polynomial terms (X12, X22 and X32) are used to
assess the non-linearity.
After fitting the response data in experimental design, the experimental results were analyzed
by ANOVA. It demonstrated the various statistical parameters such as b coefficients, F
values, p values of model terms and Correlation coefficient (R2) values. The suitability of model was authenticated by the predicted and adjusted R2 values.[10]
2.2.4 Optimization of Extrusion-sphronization process
The independent variables in extrusion-spheronization process were % fluid uptke,
spheronizer speed and spheronization time. These process variables were studied at three
levels (-1, 0, +1), the +1 and –1 levels were selected based on preliminary experiments and
product characteristics. Percentage fluid uptake was selected based on process feasibility,
spheronizer speed and spheronization time were adjusted based on the core size. Bulk density
(Y1), Percentage of fines (Y2) and percentage of retains (Y3) were selected as responses. The
impact of each selected process parameter on responses were studied and optimized
individually.
2.2.5 Characterization of Fenofibric acid DR Pellets
2.2.5.1 Evaluation of Fenofibric acid drug loaded pellets
2.2.5.1.1 Percentage of fines and percentage of retains were determined using following
formulae
% Fines = (Weight of passes (g)/ Total weight of pellets (g)) X100
% retains = (Weight of retains (g)/ Total weight of pellets (g)) X100
2.2.5.1.2 Bulk desnsity[11]
Bulk density of drug loaded pellets was determined using following formulae
2.2.5.2 Evaluation of Fenofibric acid DR pellets
2.5.2.1 Assay
Fenofibric acid DR pellets equivalent to 135mg of Fenofibric acid were transferred into
100mL volumetric flask, added 70mL of methanolic NaOH and sonicated for 15minutes with
intermittent shaking. Made up the volume with methanolic NaOH. The solution was filtered
through 0.45µ nylon membrane filter. Transfer 5mL of this solution into a 50mL volumetric
flask and made up the volume with diluent (Acetonitrile:pH 2.5 buffer = 700:300). The
solution was filtered through 0.45µ nylon membrane filter.
The following chromatographic conditions were employed for analysis:
Column: Kromosil 100, C18, 250 x 4.6 rnm, 5 pm or equivalent.
Injection volume: 20µL
Flow rate: 1.0 mL/min.
Detector: UV, 286nm
Run time: 10 minutes
CALCULATIONS
Assay of fenofibric acid formula:
Where,
AT = Peak area of Choline fenofibrate obtained from the Sample Solution.
AS = Average Peak area of Choline fenofibrate obtained from the standard Solution
WS = Weight of Choline fenofibrate working standard taken in mg
WT = Weight of sample taken in mg
P= Potency of Choline fenofibrate working standard used (on as is basis)
LC = Label claim
0.756 = Mol. Wt of fenofibric acid/ Mol. Wt of Choline Fenofibrate
2.5.2.2 In vitro drug release studies[12]
The Fenofibric acid DR pellets equivalent to 135mg Fenofibric acid were accurately filled
into size 0 hard gelatin capsules and evaluated for in vitro drug release studies, which were
performed using USP Type II dissolution test apparatus. The stirring speed of 50 rpm, and the
temperature was maintained at 37°C±0.5°C. These conditions were kept constant for all
pH 3.5 for 120min followed by 900 mL of 0.05M sodium phosphate buffer pH 6.8 at 30, 60,
90, 120, 240,360 and 480min. 10ml of sample was withdrawn periodically and replaced with
equal volume of fresh dissolution medium. The collected samples were filtered through 0.45µ
nylon membrane filter and analyzed to assess the % drug dissolved by employing same
chromatographic conditions as that of assay.
The % labeled amount of Choline fenofibrate dissolved at respective time intervals (Dn) was
estimated from following formulae:
Where,
AT = Peak area of Choline fenofibrate obtained from the Sample Solution.
AS = Average Peak area of Choline fenofibrate obtained from the standard Solution
WS = Weight of Choline fenofibrate working standard taken in mg
WT = Weight of sample taken in mg
P = Potency of Choline fenofibrate working standard used (on as is basis)
LC = Label claim
0.756 = Mol. Wt of fenofibric acid/ Mol. Wt of Choline Fenofibrate
2.5.2.3 Drug release kinetics[13]
The drug release kinetics and mechanism from the formulations were studied by fitting the
data obtained from the in vitro release study into several mathematical equations.
3. RESULTS
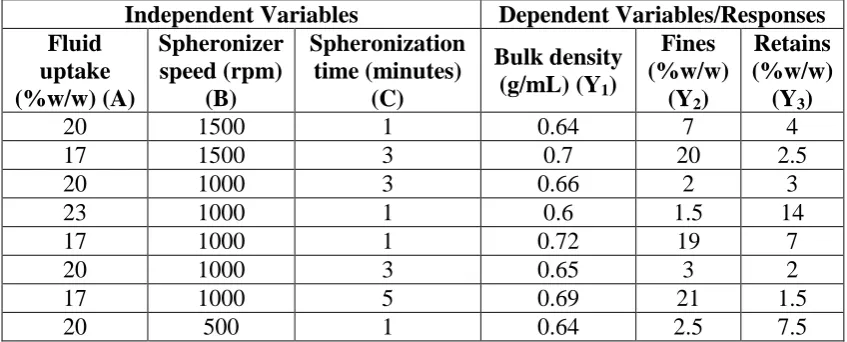
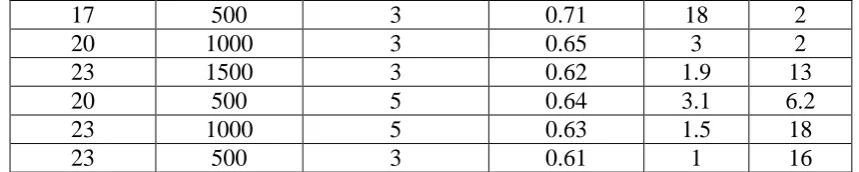
Table 2: Observed responses in Face centered central composite design for Fenofibric
acid drug loading process.
Independent Variables Dependent Variables/Responses
Fluid uptake (%w/w) (A)
Spheronizer speed (rpm)
(B)
Spheronization time (minutes)
(C)
Bulk density (g/mL) (Y1)
Fines (%w/w)
(Y2)
Retains (%w/w)
(Y3)
20 1500 1 0.64 7 4
17 1500 3 0.7 20 2.5
20 1000 3 0.66 2 3
23 1000 1 0.6 1.5 14
17 1000 1 0.72 19 7
20 1000 3 0.65 3 2
17 1000 5 0.69 21 1.5
[image:8.595.86.510.586.757.2]17 500 3 0.71 18 2
20 1000 3 0.65 3 2
23 1500 3 0.62 1.9 13
20 500 5 0.64 3.1 6.2
23 1000 5 0.63 1.5 18
23 500 3 0.61 1 16
Table 3: ANOVA results for predicting process variables.
DF SS MS F P R2
Bulk Density (g/mL) (Y1)
Model 9 0.018068 0.00201 109.505 0.00003 0.9949 Lack of Fit 3 0.000025 0.0000083 0.25 0.85757
Fines %w/w (Y2)
Model 9 843.525 93.725 114.4617 0.00003 0.9952 Lack of Fit 3 3.4275 1.1425 3.4275 0.23401914
Retains (%w/w) (Y3)
Model 9 450.587 50.065 81.3628 0.000069 0.9932 Lack of Fit 3 2.41 0.8033 2.41 0.30672603
ANOVA: Analysis of variance; df: Degrees of Freedom; SS: Sum of squares; MS:Mean sum
[image:9.595.82.512.72.158.2]of squares; *p<0.05 considered as significant.
Table 4: The Criterion for Numerical Optimization.
Parameters Goal Lower
limit Upper limit Lower weight Upper weight Importa nce Fluid uptake
(%w/w) (A) Is in range 17 23 1 1 1
Spheronizer speed (rpm) (B)
Is target =
1000 500 1500 1 1 1
Spheronization
time (minutes) (C) Is in range 1 5 1 1 1
Bulk Density (g/mL) (Y1)
Maximize 0.60 0.67 1 1 1
Fines (%w/w) (Y2)
Is in range 0 5 1 1 1
Retains (%w/w) (Y3)
Is in range 0 5 1 1 1
Solutions
Desirabi lity
Independent Variables Response Variables
Code A B C Experimental valuesa Predicted Values
Optimized formulatio
n
2
0 1000 3
Y1 0.653 ± 0.006 0.664
0.955 Y2 2.667 ± 0.577 5.0
Y3 2.333 ± 0.577 1.260 a
(A)
(B)
(D)
(E)
[image:11.595.182.419.70.664.2](F)
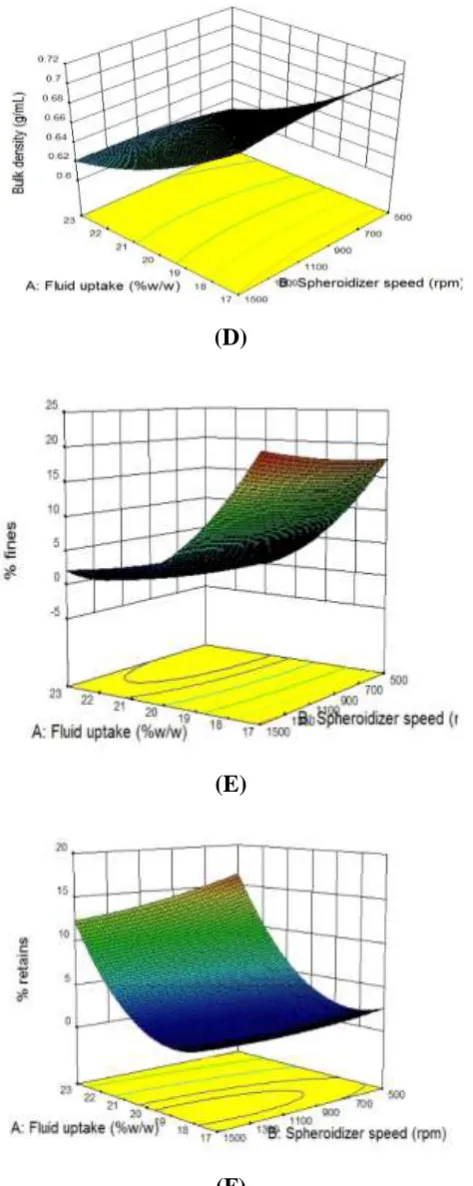
Fig 1: Contour plots (A,B,C) and response surface plots (D,E,F) showing the impact of
factors (% Fluid uptake, Spheronizer speed & Spheronization rpm) on Bulk density,
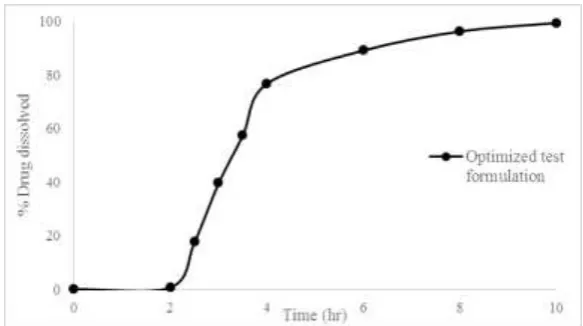
Fig 2: Dissolution profile of the optimized formulation.
4. DISCUSSION
4.1 Preparation of drug loaded pellets by Extrusion-spheronization process
Fenofibric acid drug loaded pellets were prepared by employing Extrusion-spheronization
process. The impact of process variables on pellet quality such as bulk density, % fines and %
retains evaluated in preliminary trials. From the obtained results, binder addition time (3
minutes), wet mixing time (3 minutes), extruder speed (30-40 rpm), extruder screen diameter
(0.8mm), spheronizer friction plate groove size (1 mm) and drying time (until reaches the
desired LOD) were selected.
% Fluid uptake (A), Spheronizer speed (B) and spheronization time (C) were identified as
high risk variables have a potential impact on pellet quality (Bulk density, % Fines and %
retains). Hence these factors were studied by a three factor, three level face centered central
composite experimental design, individually.
4.2 Data analysis and model validation
4.2.1 Fitting of data to the model
Three factors with three levels face centered central composite experimental design require
14 experiments, the independent variables and responses for all experimental runs are given
in table 2. Models of various responses were obtained using Design Expert (Stat-Ease). The
ANOVA results of each response were represented in table 3. Values of probability p < 0.05
represent significant model terms. The regression equations carry factors along with
coefficients (positive/ negative) which quantify response values. A positive sign of
coefficient indicates synergistic effects; whereas negative sign represents an antagonistic
effect. After elimination of non significant (p > 0.05) coefficients from the obtained results,
Y1=1.6763-0.0795*A +0.0025*AC+0.00134*A2
Y2=363.727-33.478*A+0.00311*B+0.7727*A2
Y3= 229.262 -23.030*A+0.00478*B+0.3958*AC + 0.611* A2+0.574* C2
All the responses observed for various formulations were fitted simultaneously to first order,
second order and quadratic models using Design expert. All the responses were found to
follow quadratic model. From the obtained ANOVA results (Table 3), terms AC and A2 have significant positive impact on Y1.Terms B and A2 shown a positive impact on Y2. Terms B,
AC, A2 and C2 shown a positive impact on Y3, whereas term A shown significant negative
impact on Y1, Y2 and Y3.
4.2.2 Contour and three dimensional response surface plot analysis
The design expert software (Stat-Ease) generated the contour and three dimensional surface
plots are presented in Figure 1, which are very useful to study the interaction effects of the
factors on responses. This type of the plot visualizes the effects of two factors on the response
at a time. In all the cases, the factors exhibited a curvi-linear relationship with responses Y1,
Y2 and Y3.
Among the studied range, the fluid uptake of 20 %w/w, spheronization speed of 1000 rpm
and spheronization residence time of 3 minutes were selected as optimum process parameters
for drug loading by Extrusion spheronization process.The results obtained from the
formulation executed with optimized formulation and process variables were bulk density –
0.65g/mL, % fines – 2.6 %w/w and % retains -2.6 %w/w.Assay of the optimized formulation
was observed as 99.7%w/w.
4.3 Characterization of Fenofibric acid DR pellets
4.3.1 Eavaluation of Fenofibric acid drug loaded pellets
4.3.1.1 Percentage fines and retains
Percentage fines and retains from all the batches ranges from 1.0 - 20%w/w and 1.5 –
18%w/w respectively.
4.3.1.2 Bulk density
The bulk density of the drug loaded pellets from all the batches ranges from 0.60 – 0.72
4.3.2 Eavaluation of Fenofibric acid DR pellets
4.3.2.1 Assay
The assay of the all formulations was tested and results were found in the range of 97.6 –
100.2%. Assay of the optimized formulation was observed as 99.7%w/w.
4.3.2.2 In vitro drug release studies and Drug release kinetics
The dissolution profile of optimized formulation represented in Figure 2. The dissolution data
of optimized formulation fitted into kinetic models, the obtained results concluded that the
drug release followed the first order kinetics as r2 values were higher for first order model (0.985) than zero order model (0.746). The n value is greater than 0.45 (0.584); hence the
mechanism of drug release was non-fickian diffusion.
5. CONCLUSION
Fenofibric acid drug loaded pellets were successfully fabricated by extrusion spheronization
technology. Impact of various process variables on drug loading by extrusion spheronization
process was assessed by using response surface methodology. This investigation revealed that
independent variables had a significant impact on the measured responses. The quantitative
effect of these factors at different levels on responses could be predicted by polynomial
equations. Linearity observed between the actual and predicted values of the response
variables indicated that analytical ability of the selected design. Low fluid uptake, Higher
spheronization speed and time leads to fines generation as well as high fluid uptake, low
spheronization speed and time results in agglomerates. Water content and spheronizer speed
interaction influence the sphere density. From the obtained results, 20%w/w as fluid uptake,
spheronization speed of 1000 rpm and 3 minutes as spheronization residence time were
selected as the operating ranges for robust process, desired yield and quality of the product.
The fabricated delayed release pellets using fenofibric acid drug loaded pellets prepared by
extrusion spheronization process shown desired drug release profile. The optimized batch
showed 99.7%w/w of assay. Hence, the applicability of response surface methodology to
optimize the process variables in the fabrication of Fenofibric acid drug loaded pellets by
extrusion spheronization is apt enough.
6. ACKNOWLEDGEMENTS
Authors are thankful to RA Chem Pharma Ltd, Hyderabad for providing the gift sample of
7. REFERENCES
1. Gehbre Sellasie I, Pellets: A general overview: Pharmaceutical pelletization technology,
1st ed. Newyork; Marcel Dekker, 1989; 01-43.
2. Hiren P. P, Patel J. K., Ravi R. P and Dr. Manish P.P, Pellets: A general overview, Int. J
Pharm World Res, 2010; 1(2): 1-15.
3. Shajahan A, Anil V. C and Sunil B. J, A flexible technology for modified –release drugs:
Multiple unit pellets system, J Control Release, 2010; 147(1): 2-16.
4. International Conference on harmonization (ICH). Guidance for industry: Q8 (R2)
Pharmaceutical development, ICH harmonized tripartite guideline, 2009.
5. Dayal. P, Pillay. V, Babu. R.J and Singh M., Box-Behnken experimental design in the
development of a nasal drug delivery system of model drug hydroxyurea: characterization
of viscosity, in vitro drug release, droplet size and dynamic surface tension, AAPS
Pharm. Sci. Tech., 2005; 6(4): E573–85.
6. Russell Drew Cink, Joseph B. Paterson, Jr., Yi Gao, Geoff G. Z. Zhang, Michelle A.
Long, John B. Morris, Joerg Rosenberg, US Patent, US7259186, 2017.
7. Haralampos J Milionis et al., Management of dyslipidemias with fbrates,alone and in
combination with statins: role of delayed-release fenofbric acid, Vascular Health and Risk
Management, 2010; 6: 525–39.
8. Mounika Aluru et al, Formulation and Evaluation of Fenofibric Acid Delayed Release
Mini Tablets in Capsules, International Journal of Innovative Pharmaceutical Sciences
and Research, 2015; 3(9): 1290-1304.
9. Ramakrishna. G et al, Formulation and Evaluation of Delayed and Extended Release
Choline Fenofibrate Capsules, PHARMANEST: An International Journal of Advances in
Pharmaceutical Sciences, 2015; 6(4): 2896-2901.
10.Bolton S, Statistical applications in the pharmaceutical sciences, In: Lachman L,
Lieberman HA, Kanig JL, editors. The Theory and Practice of Industrial Pharmacy, 3rd
ed. Bombay; Varghese Publishing House., 1987; 243-89.
11.Pharmacopoeia I, Indian Pharmacopoeia Commission, Ghaziabad, India, 2010; 2: 786.
12.Dsissolution methods database, compilation prepared by Center for Drug Evaluation and
Research,https://www.accessdata.fda.gov/scripts/cder/dissolution/dsp_SearchResults.cfm.
13.Suvakanta D, Padala N M, Lilakanta N and Chowdhury P, Kinetic Modeling on Drug