RP-HPLC METHOD DEVELOPMENT AND VALIDATION FOR
ESTIMATION OF BOSENTAN IN BULK AND PHARMACEUTICAL
FORMULATION
Dr. M. Sumakanth, Y. Sai Kalyani* and A. Chaitanya
Department of Pharmaceutical Analysis and Quality Assurance R.B.V.R.R Women’s College
of Pharmacy, Barkatpura, Hyderabad-500027, Telangana, India.
ABSTRACT
A simple, rapid and sensitive RP-HPLC method was developed and
validated for estimation of Bosentan in tablet dosage form.
Chromatography was carried out by using prepacked luna C18, 5µ(250
× 4.6)mm phenomex column as a stationary phase with mobile phase
containing a mixture of Acetate buffer (pH 5) : Acetonitrile in the ratio
of 68:32 v/v. The flow rate was 1ml/min. The eluent was monitored at
268nm and the retention time of drug is 3.68mins. Calibration curve
was plotted with a range of 2-6 µg/ml for Bosentan and the correlation
coefficient was found to be 0.999. The developed method was
validated in terms of linearity, precision, accuracy, specificity, limit of
quantification and limit of detection. The accuracy range was found to
be 98-102%. The % RSD value for all validation parameters was found
to be less than 2 for RP-HPLC. The developed method can be used for
routine analysis of Bosentan in pharmaceutical dosage form as well as bulk was developed
and validated according to ICH guidelines.
KEYWORDS: Bosentan, RP-HPLC, ICH guidelines.
INTRODUCTION
Bosentan is an dual endothelial receptor antagonist used in the treatment of pulmonary artery
hypertension (PAH). Bosentan is a competitive antagonist of endothelin1 at the endothelin
-A and endothelin-B receptors. Bosentan is used to treat hypertension by blocking the action
of endothelin in molecules that would otherwise promote narrowing of blood vessels and lead
to high blood pressure.
Volume 7, Issue 17, 730-744. Research Article ISSN 2277– 7105
Article Received on 24 July 2018,
Revised on 14 August 2018, Accepted on 04 Sept. 2018
DOI: 10.20959/wjpr201817-11804
*Corresponding Author
Y. Sai Kalyani
Department of
Pharmaceutical Analysis
and Quality Assurance R.B.V.R.R Women’s
College of Pharmacy,
Barkatpura,
This compound belongs to the class of organic compounds known as bipyrimidines and
oligopyrimidines. These organic compounds contain two or more pyrimidine rings directlt
linked to each other. Bosentan is chemically
4-tert-butyl-N-[6-(2-hydroxyethoxy)-5-(2-methoxyphenoxy)-2-(pyrimidin-2-yl)pyrimidin-4-yl]benzene-1-sulfonamide.
Category: Endothelial receptor antagonist.
Classification: Anti-hypertensive.
Bosentan is poorly soluble in water, solubility increases at higher pH.
MATERIALS AND METHODS
Chemicals and Reagents
Pure drug sample of Bosentan was obtained from MSN laboratories and tablet formulation
(BOSENTAS) was purchased from Medplus, Hyderabad, India, with labelclaim of 62.5mg.
Acetonitrile, methanol, HPLC grade water, glacial acetic acid was procured from SD-Fine
Chem-Limited and sodium acetate was procured from MERCK.
Instrumentation
The analysis was performed by using Schimazdu 20AD RP-HPLC instrument with
Phenomenex Luna C18 column (250×4.6mm) 5µm, it contains Rhenodyne valve with 20µ l
fixed loop injector with UV –Visible detector and UV-Visible Spectrophotometry instrument
i.e, Elico 210 with spectra treats software, analytical balance (Contech) are used for
weighing, pH (Elico), Sonicator (Labotech) was used for degassing the mobile phase, were
used during the study.
Chromatographic Conditions
RP-HPLC analysis was carried out on C18 (Phenomenex, 250 × 4.6mm, particle size 5µm)
with reversed phase column. The mobile phase consists of a mixture of acetonitrile :sodium
was 1ml/min with isocratic elution, the injection volume 20µl and run time was 10mins. The
detection was carried out at 268nm.
Preparation of pH 5 Sodium acetate Buffer
Measured accurately 13.6gms og Sodium acetate was transferred into 1000ml volumetric
flask and to this add 6ml of glacial acetic acid in sufficient water, adjust pH to 5 and make up
the volume to 1000ml. Filter through 0.45μ membrane filter.
Preparation of Mobile phase
Add 320 volume of pH 5.0 acetate buffer and 680 volume of Acetonitrile and degas it.
Preparation of Bosentan Standard stock solution
Accurately weigh and transfer 5mg Bosentan into 5ml volumetric flask, to that mixture add
3ml diluent and sonicate to dissolve, and then make up the volume by using diluent.
(1000ug/ml).
Pipette 0.5ml from 1000µg/ml into 5ml volumetric flask and make up to mark with diluent.
(100ug/ml).
Preparation of Sample Solution
Accurately weighed 10 tablets and average weight was calculated, accurately weighed and
transferred the sample equivalent to 5mg of Bosentan into 5ml volumetric flask. To this add
3ml of diluents and sonicate to dissolve it completely and make up to mark with diluent.
Further pipette out 0.5ml from 1000µg/ml into 5ml volumetric flask and make up to the mark
with diluent i.e., 100µg/ml.
Selection of Analytical Wavelength
5µg/ml solution was scanned in the wavelength range of 200-400nm in order to observe
maximum absorbance. The λmax for Bosentan is 268nm, since it shows maximum
Fig. 1: Scanned spectrum of Bosentan.
Fig. 2: Scanned spectrum of Bosentan.
Optimization of proposedmethod
Trail 1:
Diluents : Mobile phase
Column : C18 phenomenex
Mobile phase : pH 5.0 Citrophosphate Buffer: Acetonitrile (70:30)
Injection volume : 20µl
Flow rate : 1ml/min
Detection wavelength : 268nm
Fig. 3: Chromatogram of trail 1.
Name RT (mins) Area Theoretical plates Tailing factor Resolution
[image:4.595.63.539.363.776.2]Trail 2:
Diluents : Mobile phase
Column : C18 phenomenex
Mobile phase : pH 3.7, Acetate Buffer : Acetonitrile ( 50:50)
Injection volume : 20µl
Flow rate : 1ml/min
[image:5.595.74.542.74.367.2]Detection wavelength : 268nm
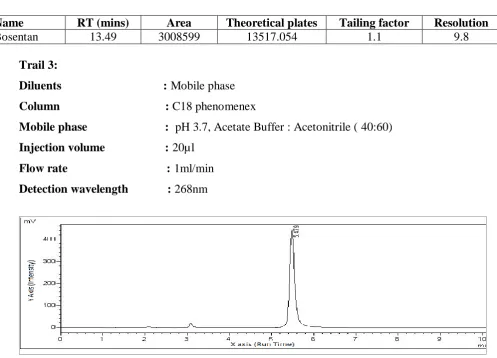
Fig. 4: Chromatogram of trail 2.
Name RT (mins) Area Theoretical plates Tailing factor Resolution
Bosentan 13.49 3008599 13517.054 1.1 9.8
Trail 3:
Diluents : Mobile phase
Column : C18 phenomenex
Mobile phase : pH 3.7, Acetate Buffer : Acetonitrile ( 40:60)
Injection volume : 20µl
Flow rate : 1ml/min
Detection wavelength : 268nm
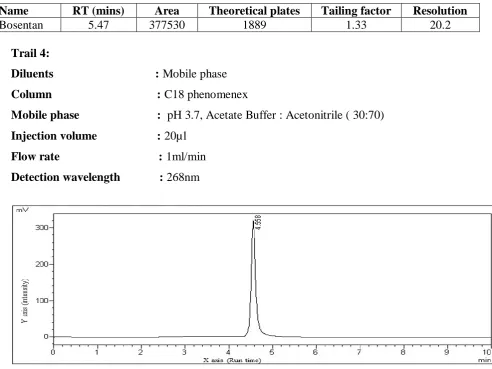
[image:5.595.53.551.393.751.2]Name RT (mins) Area Theoretical plates Tailing factor Resolution
Bosentan 5.47 377530 1889 1.33 20.2
Trail 4:
Diluents : Mobile phase
Column : C18 phenomenex
Mobile phase : pH 3.7, Acetate Buffer : Acetonitrile ( 30:70)
Injection volume : 20µl
Flow rate : 1ml/min
[image:6.595.61.554.69.438.2]Detection wavelength : 268nm
Fig. 6: Chromatogram of trail 4.
Name RT (mins) Area Theoretical plates Tailing factor Resolution
Bosentan 4.56 224948 1876 1.23 20.2
Trail 5:
Diluents : Mobile phase
Column : C18 phenomenex
Mobile phase : pH 5, Acetate Buffer : Acetonitrile ( 50:50)
Injection volume : 20µl
Flow rate : 1ml/min
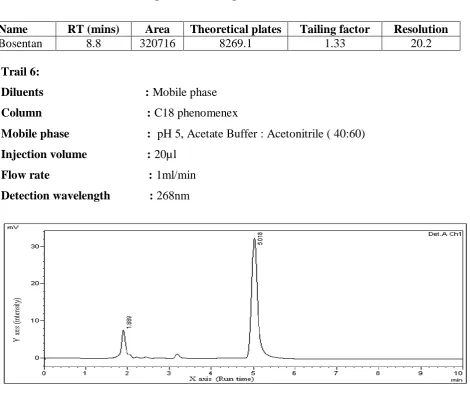
Fig. 7: Chromatogram of trail 5.
Name RT (mins) Area Theoretical plates Tailing factor Resolution
Bosentan 8.8 320716 8269.1 1.33 20.2
Trail 6:
Diluents : Mobile phase
Column : C18 phenomenex
Mobile phase : pH 5, Acetate Buffer : Acetonitrile ( 40:60)
Injection volume : 20µl
Flow rate : 1ml/min
Detection wavelength : 268nm
Fig. 8: Chromatogram of trail 6.
Name RT (mins) Area Theoretical plates Tailing factor Resolution
[image:7.595.71.542.251.644.2]CONCLUSION
Trail 1: More column wash is required for the column to get stabilized
Trail 2: Here the drug is eluted slowly
Trail 3: Theoretical plate count is below 2000
Trail 4: Theoretical plate count is below 2000
Trail 5: Here the drug is eluted slowly
Trail 6: To decrease the retention time
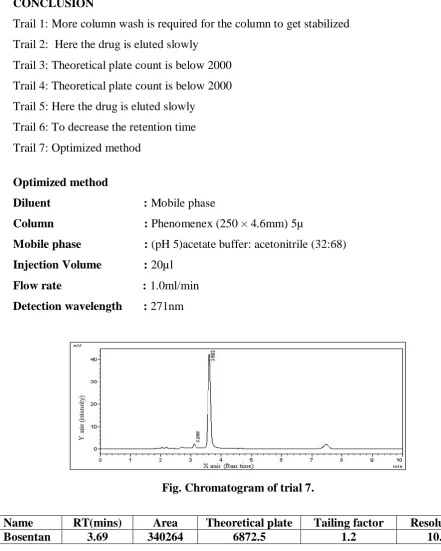
Trail 7: Optimized method
Optimized method
Diluent : Mobile phase
Column : Phenomenex (250 × 4.6mm) 5µ
Mobile phase : (pH 5)acetate buffer: acetonitrile (32:68)
Injection Volume : 20µl
Flow rate : 1.0ml/min
[image:8.595.59.501.76.628.2]Detection wavelength : 271nm
Fig. Chromatogram of trial 7.
Name RT(mins) Area Theoretical plate Tailing factor Resolution
Bosentan 3.69 340264 6872.5 1.2 10.3
Conclusion: Peak shape is symmetrical and retention time is less and all parameters are
within limits.
Method Validation
RP-HPLC method was developed and validated by using following parameters such as
System Suitability
In HPLC, it is an integral part of method development and to ensure the performance of
HPLC system. The parameters such as retention time (RT), number of theoretical plates (N),
and tailing factor (T) were evaluated for six replicate injections at a concentration of 3µg/ml.
Linearity
Linearity of an analytical procedure is its ability (within a given range) to obtain test results
which are directly proportional the concentration (amount) of analyte in the sample .
Accuracy
ICH defines the accuracy of an analytical procedure as “the closeness of agreement between
the conventional true value or an accepted reference value and the value found”.
A study of recovery was conducted from about 80%, 100% and 120% of the initial assay
concentration.
Precision
The precision of an analytical procedure “expresses the closeness of agreement between a
series of measurement obtained from multiple sampling from the same homogenous sample
under the prescribed conditions”. Precision of an analytical procedure is usually expressed
the variance standard deviation of coefficient of variation of a series of measurement.
Intraday Precision
Repeatability expresses “the precision under the same operating conditions over a short interval of time”. Repeatability is also termed intra-assay precision.
Interday Precision
The same sample prepared is checked on the next day.
Limit of Detection (LOD) and Limit of Quantification (LOQ)
Limit of detection is the “lowest concentration of analyte in a sample which can be detected,
but not necessarily quantitated, as an exact value under the stated”.
N be quantitatively determined with Limit of quantification is the “lowest concentration of
LOD and LOQ of drug were calculated using the following equations designated by
international Conference on Harmonization (ICH)guidelines.
LOD =3.3 x σ/S LOQ= 10 x σ/S
Where σ is the standard deviation of response
S is slope of the calibration curve
Robustness
The robustness of an analytical procedure is a measure of its capacity to remain unaffected by
small, but deliberate variations in method parameters and provides an indication of its
reliability during normal usage.
RESULTS AND DISCUSSION
Results of RP-HPLC
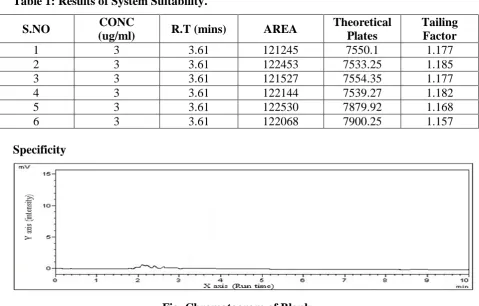
System Suitability
The six replicates of injections at a concentration of 3µg/ml were prepared separately and
[image:10.595.59.539.444.750.2]injected and all the parameters were calculated.
Table 1: Results of System Suitability.
S.NO CONC
(ug/ml) R.T (mins) AREA
Theoretical Plates
Tailing Factor
1 3 3.61 121245 7550.1 1.177
2 3 3.61 122453 7533.25 1.185
3 3 3.61 121527 7554.35 1.177
4 3 3.61 122144 7539.27 1.182
5 3 3.61 122530 7879.92 1.168
6 3 3.61 122068 7900.25 1.157
Specificity
Fig. Chromatogram of Standard 3µg/ml.
Fig. Chromatogram of Sample 3µg/ml.
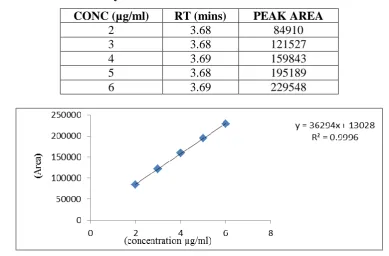
Linearity
The linearity was determined using standard solution, to establish linearity following
concentration range of 2, 3, 4, 5, 6µg/ml.
Table 2: Results of Linearity.
CONC (µg/ml) RT (mins) PEAK AREA
2 3.68 84910
3 3.68 121527
4 3.69 159843
5 3.68 195189
6 3.69 229548
Accuracy
The accuracy was developed by recovery studies which were carried out at three different
spiked levels i.e., 80%, 100%, 120%.
Table 3: Results of Accuracy.
Accuracy level % Amount pure added (µg/ml) Amount of sample added (µg/ml) Total concent ration (µg/ml)
Area %
Recovery
Avg %
Recovery Mean S.D %RSD
80
1.2 1.5 2.7 109880 100.4
100.03 97648.7 489.8 0.5
1.2 1.5 2.7 109086 99.7
1.2 1.5 2.7 109570 100.2
100
1.5 1.5 3.0 121475 99.9
99.8 121638.7 350.4 0.29
1.5 1.5 3.0 121041 99.6
1.5 1.5 3.0 121400 99.9
120
1.8 1.5 3.3 133422 99.8
99.5 145160.3 777.2 0.54
1.8 1.5 3.3 134083 100.3
1.8 1.5 3.3 134843 100.8
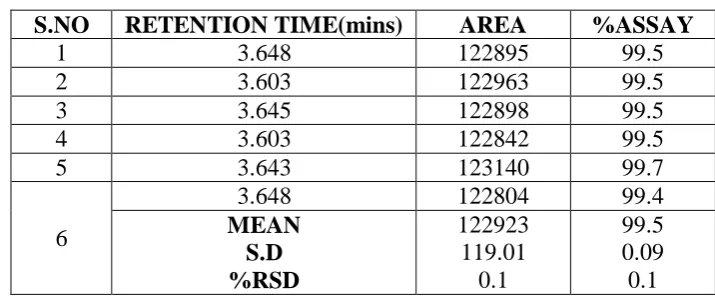
[image:12.595.116.474.404.554.2]Precision
Table 4: Intraday Precision.
S.NO RETENTION TIME(mins) AREA %ASSAY
1 3.648 122895 99.5
2 3.603 122963 99.5
3 3.645 122898 99.5
4 3.603 122842 99.5
5 3.643 123140 99.7
6
3.648 122804 99.4
MEAN S.D %RSD 122923 119.01 0.1 99.5 0.09 0.1
Table 5: Inter Day Precision.
S.NO RETENTION TIME(mins) AREA %ASSAY
1 3.648 123052 99.6
2 3.642 122996 99.6
3 3.645 123075 99.7
4 3.645 123236 99.8
5 3.643 123253 99.8
6
3.642 122729 99.4
Robustness
Change in Flow rate (± 0.2ml/min)
Table 6: Results of Change in Flow rate.
Parameter Flow Rate-0.8ml/min Flow Rate-1.2ml/min
Conc R.T Area %Assay Conc R.T Area %Assay
1 3µg/ml 3.8mins 123086 99.7 3µg/ml 3.5mins 123032 99.6
2 3µg/ml 3.7mins 122993 99.6 3µg/ml 3.5mins 123229 99.8
3 3µg/ml 3.8mins 123090 99.7 3µg/ml 3.5mins 123182 99.8
Mean 123056.33 99.66 123148 99.7
S.D 44.81 0.06 84.01 0.115
%RSD 0.04 0.06 0.07 0.12
Change in Mobile phase ratio (± 2)
Table 7: Results of Change in Mobile phase.
Parameter Ratio-Buffer : ACN (34:66) Ratio-Buffer : ACN (30:70)
Conc R.T Area %Assay Conc R.T Area %Assay
1 3µg/ml 3.74mins 122739 99.4 3µg/ml 3.5mins 123299 99.8
2 3µg/ml 3.74mins 123002 99.6 3µg/ml 3.5mins 123270 99.9
3 3µg/ml 3.74mins 123217 99.8 3µg/ml 3.5mins 123137 99.7
Mean 122986 99.6 123235.3 99.8
S.D 239.4 0.2 86.4 0.1
%RSD 0.19 0.2 0.07 0.1
Change in pH (± 0.2)
Table 8: Results of Change in pH.
Parameter pH of Buffer – 4.95 pH of Buffer – 5.05
Conc R.T Area %Assay Conc R.T Area %Assay
1 3µg/ml 3.516mins 123080 99.7 3µg/ml 3.749mins 123002 99.6
2 3µg/ml 3.516mins 122799 99.4 3µg/ml 3.749mins 122739 99.4
3 3µg/ml 3.516mins 122713 99.4 3µg/ml 3.749mins 123217 99.8
Mean 122864 99.5 122986 99.6
S.D 191.94 0.173 239.4 0.2
%RSD 0.16 0.17 0.19 0.2
LOD & LOQ
Table 9: Results of LOD & LOQ.
S.NO SAMPLE INTERCEPT SLOPE LOD LOQ
1
3µg/ml
13237 36597
3.3 × σ/S =3.3 × 1339.79/36299
=0.12
10× σ/S =10 ×1339.79/36299
=0.37
2 15446 36007
3 13028 36294
MEAN 13903.67 36299
Assay of Marketed Formulation
Table 10: Results of Assay.
Dosage form Labeled claim Amount found % Recovery % RSD
Tablet Bosentas 62.5mg
62.7mg 100.3
0.26%
62.9mg 100.7
62.6mg 100.2
CONCLUSION
The method was successfully developed for estimation of Bosentan in pharmaceutical dosage
form by using RP-HPLC and the validated parameters results have proved that the method is
selective, precise, accurate and linear.
The developed method was validated as per the International Conference On Harmonization
ICH(Q2B)guidelines, and was found to be applicable for routine quantitative analysis of
Bosentan by RP-HPLC in tablet dosage forms.
This method is more sensitive than previously reported methods, due to its high sensitivity.
Hence ablove method can be used in quality control for routine analysis of tablets of
Bosentan without any interference.
We can extend this work by performing degradation studies and simultaneous method. we
can still reduce the retention time. With high sensitive instrument we can reduce
concentration to ngs. Even LC-MS analysis can also be done with same buffer since the
buffer is suitable for LC-MS.
ACKNOWLEDGEMENT
The authors would like to thankful the management of RBVRR women’s college of
pharmacy (RBVRRWCOP), Hyderabad, for providing the necessary facilities to carry out
this research work.
REFERENCES
1. https:// pubchem.ncbi.nlm.nih.gov/compound/Bosentan
2. Chatwal.R.G; Anand K. S, (2010), High Performance Liqiud Chromatograph.
Instrumental Methods Of Chemical Analysis, 5th edition; Himalaya Publishers. Mumbai,
3. International Conference on Harmonization (ICH) of Technical Requirements for
Registration of Pharmaceuticals for Human use. 1994, Validation of Analytical
Procedures: Methodology. ICH-Q2B, Geneva.
4. L.R. Snyder, J.J.Kirkland, 1979, Introduction to modern liquid chromatography, 2nd
edition, A Wiley Interscience Publication, New York.
5. Michael W. Dong, 2006, Modern HPLC for practicising scientist, chapter 3, 6, 8. John
Wiley & sons, New York.
6. Patel.D.S,. CaptainA.D, Prajapati P.P., Shah H.G, (jan-mar 2013)Department of quality
assurance, International journal of pharmtech research coden (USA) iiprif issn :
0974-4304vol.5, no.1, pp 147-154.
7. Patel H.H et al; International journal of Pharmamedix India, 2013; I(2): 306-316.
8. Sethi P.D., HPLC-Quantitative analysis of pharmaceutical formulations; 3rd edition, CBS
publishers & distributors, 1997, Pg: 182.
9. Sharma B.K., Instrumental Methods of Chemical Analysis, GOEL Publication House,
Meerut, Pg. 133-161, 68-80, 114-165, 286-320.
10.Snyder.R, J. Kirkland, L. Glajch, Practical HPLC method development, 1997, II edition,
A Wiley International publication, Pg: 235, 266-268, 351-353, 653-600, 686-695.
11.Satinder Ahuja, Michael W. Dong, 2005, Handbook of Pharmaceutical analysis by
HPLC, Elsevier Academic Press, pp:146-187.
12.Shoog, Principles of instrumental analysis, 5TH edition, Thomson Asia Pvt Ltd, HPLC
page no:312-317.
13.Shoog, Principles of instrumental analysis, 5TH edition, Thomson Asia Pvt Ltd, HPLC
page no:725-728.
14.Sethi P.D, 2001, High performance liquid chromatography: Quantitative analysis of
pharmaceutical formulations, 1st edition: pp5-11,141.
15.Vogel’s, 2013, Text book of Quantitative chemical analysis, 6th edition, Dorlink
Kindersley (India) Pvt.Ltd, pp:244-269.
16.www.spectroscopy.wikipedia.com
17.Winslow A. and r. F. Meyer, (1997), Defining a master plan for the validation of