Manuscript version: Author’s Accepted Manuscript
The version presented in WRAP is the author’s accepted manuscript and may differ from the published version or Version of Record.
Persistent WRAP URL:
http://wrap.warwick.ac.uk/108573
How to cite:
Please refer to published version for the most recent bibliographic citation information. If a published version is known of, the repository item page linked to above, will contain details on accessing it.
Copyright and reuse:
The Warwick Research Archive Portal (WRAP) makes this work by researchers of the University of Warwick available open access under the following conditions.
Copyright © and all moral rights to the version of the paper presented here belong to the individual author(s) and/or other copyright owners. To the extent reasonable and
practicable the material made available in WRAP has been checked for eligibility before being made available.
Copies of full items can be used for personal research or study, educational, or not-for-profit purposes without prior permission or charge. Provided that the authors, title and full
bibliographic details are credited, a hyperlink and/or URL is given for the original metadata page and the content is not changed in any way.
Publisher’s statement:
Please refer to the repository item page, publisher’s statement section, for further information.
1. INTRODUCTION
Civil conflicts create a “conflict trap”. They perpetuate themselves by destroying economic
and social development, and by crippling political institutions rendering them unable to address the
underlying grievances1. In this article, we empirically demonstrate that ethnic conflicts lead to
another very important political change which we argue, should be considered among the
self-perpetuating dynamics of these conflicts. We study the Turkish case to show how an ethnic conflict
creates a polarization trap by feeding the political polarization of the society along ethnic
nationalist lines.
Turkey offers a very important opportunity to study how ethnic conflicts affect political
behavior in host societies. Since August 1984, the country has been suffering from an ethnic
insurgency campaign led by the Kurdish separatist guerilla organization Kurdistan Workers' Party
(Partiya Karkaren Kurdistan), the PKK. Despite the persistent political violence the electoral
process has continued to unfold in a context of democratic elections, and in a political arena which
hosts extreme ethnic-nationalist parties. The existence of Kurdish and Turkish ethnic nationalist
parties in the political arena enables us to specifically test the effects of the ethnic conflict on the
political salience of ethnic issues and on the political salience of ethnic identities themselves
because these parties are by definition champions of the particular interests of their ethnic brethren2.
In this study, relying on a unique casualty database that we have assembled, we analyze the
association between the conflict and the vote shares of these ethnic nationalist parties in the 1995
and 1999 general elections. The results reveal a significant positive association between the conflict
and both the Turkish-nationalist and Kurdish-nationalist vote shares, and thus, point to an
ethnic-nationalist polarization of the electorate. Given the completely opposing views these ethnic parties
hold in terms of the conflict and the ways to solve it, the polarization result is telling in terms of
We then argue that these results also tie to the constructivist argument that ethnic groups are
fluid and endogenous to a set of social, economic, and political processes, and that individuals have
multiple identities whose salience changes over time in response to their environment3. We refer to
the ecological inference method developed by King (1997) to infer ethnic Kurdish and ethnic
Turkish vote choices from aggregate election results4. Then we analyze how the ethnic conflict is
associated with these estimated ethnic votes. The results reveal the significant positive association
the conflict has with both ethnic Kurdish votes for the Kurdish-nationalist party, and ethnic Turkish
votes for the Turkish-nationalist party, and thus, indicate that in response to ethnic political violence
voters attach more political salience to their ethnic identities in their vote choices.
Our study is closely linked to some recent works which have provided some clues about the
type of the association between ethnic conflicts and electoral choice. In their studies on the
Palestinian conflict both Gould and Klor, and Berrebi and Klor find a positive association between
the attacks and the vote share of the intransigent right-wing parties in Israel5. Kibris reaches a
similar conclusion for the Turkish case6. These studies are of utmost importance because they tell us
about how people react to violent conflict, and understanding people’s reactions is crucial if we are
to figure out the dynamics of these conflicts. Nevertheless, we argue that they provide us with only
a partial understanding because they implicitly assume a structure in which a homogenous society is
exposed to violence from a single outside source. Ethnic conflicts bid ethnic groups in a society
against each other both politically and economically. In most cases civilians are exposed to violence
from both the rebels and the state. Consequently, it is difficult to talk about a single unifying threat
perception in ethnic conflicts. Moreover, ethnic conflicts activate ethnic identities in a society rather
than a common national one, and raise the salience of ethnic issues. Therefore, we expect the
association between ethnic conflicts and voting behavior to vary among different groups, and in that
expectation, and demonstrate that the association manifests itself as an array of different effects
which can not be subsumed under a turn towards the right wing. It seems, rather than unifying the
the society behind a certain ideology as suggested by the above mentioned previous studies7, the
conflict further fragments and polarizes the society behind opposing camps8. This more
comprehensive approach to the association between ethnic conlicts and vote choice is one of the
main contributions of our study to the literature.
Also important is the construction of the data set on security force causalties (SFCs). This is
the first empirical study to look into the association between the ongoing ethnic conflict and the
electoral fortunes of ethnic parties in Turkey. The dearth of studies acknowledging this association
was not due to the lack of importance or relevance of the issue but was rather due to lack of data on
which to build credible measures of the conflict. Our data set provides the first, and so far the only
detailed information on casualties. Relying on this data set, it is possible to measure the variation in
conflict intensity across time and locations.
Finally, this study contributes to the literature by offering a preliminary empirical test of the
constructivist arguments about the positive association between ethnic conflicts and the political
salience of ethnic identity. This is an association that carries great importance for the study of ethnic
conflicts. Nevertheless, it evades empirical study in most cases due to difficulties associated with
simultaneous availability of data on ethnic identity and political behavior.
In the following section, we present a brief overview of the ethnic conflict in Turkey. Then
we discuss the theoretical foundations of our study. In the fourth section, we present our model and
introduce our variables. The fifth section discusses the data. We present our results in the sixth,
2. THE CONFLICT IN TURKEY
Ethnic Kurds are the largest ethnic minority in Turkey. A recent survey study puts their
percentage in the population to around 16%9. Historically, the Turkish state’s ethnic policy has
consisted of the assimilation of the Kurdish speaking population under the rubric of the Turkish
nation and consequently, this large minority has been denied the rights to self expression in the
public sphere10. Saatci suggests that this dominant and homogenizing Turkish nationalism has in
return produced the PKK11.
The PKK (Partiya Karkaren Kurdistan) is a Kurdish separatist guerilla organization that has
been conducting armed attacks in Turkey since August 1984. The organization was first founded
with the goal of establishing an independent Kurdish state in southeastern Turkey, though by late
1999, it appeared to roll back on its goal to a federational structure that would grant more autonomy
to the Kurdish population in Turkey.
The armed conflict between the PKK and the Turkish security forces has been
geographically concentrated in southeastern and eastern Turkey which is an underdeveloped part of
the country, and which has traditionally been inhabited by ethnic Kurds. While both sides mainly
targeted each other’s forces and facilities, they have also employed repressive tactics against the
civilian populations. The PKK conducted attacks against public servants like teachers, clergymen,
administrative officers, and against civilians whom they accused of being “collaborators with the
Turkish Republic”. Also, as a result of the “village guards” system under which the state employed
civilian villagers as armed guards against the insurgents, there were numerous incidents where the
PKK attacked these guards and their villages. On the other hand, the Turkish state’s responses
included the legal persecution and intolerance of Kurdish political demands, and a more sinister
counterinsurgency campaign that involved extrajudicial killings in the 90s12. Interrupted by short
going on for almost thirty years now. It has cost the country billions of dollars, and more than 40
thousand lives13. Our knowledge about civilian and insurgent casualties is limited to aggregate
numbers sporadically released by contending sources as there is no credible and publicly available
dataset on them. Nevertheless, this study, provides us with a unique database on security force (i.e.
soldiers and police officers) casualties (SFCs).
As can be clearly seen in Chart 1 below which depicts the total number of SFCs over the
years, the 90s has been the most bloody period of the conflict. The PKK received a major blow
when its leader Abdullah Öcalan was captured in Africa in 1999, brought back to Turkey, tried and
sentenced to life in prison. Headless and divided, the PKK ceased its attacks in the early 2000s.
Unfortunately, peace in the area did not last long. The PKK resumed its armed attacks in the second
half of 2004.
Since the early 90s, the conflict has been considered by the political elite and the public as
one of the most important problems facing the country14, and the ethnic based nationalist cleavage
contrasting the Turkish and Kurdish identities has become one of the most dominant cleavages of
the ideological competition in the Turkish party system15 with two ethnic nationalist parties, one on
the Turkish and one on the Kurdish side, as the flagbearers of this competition.
The MHP (Nationalist Movement Party) is an extreme Turkish-nationalist party with the
0 375 750 1125 1500
most uncompromising, militarist position towards the Kurdish issue. The party has never
acknowledged a separate Kurdish ethnic identity16, and consequently defined the problem as one of
terrorism supported by foreign governments. Party officials have always supported military
solutions to the conflict, accused those who advocated granting political rights and freedoms to the
Kurdish minority with attempting to disintegrate the country, and threatened to spill blood to
prevent any kind of political concessions17.
HADEP (People’s Democracy Party) was a Kurdish-nationalist political party founded to
take up the Kurdish cause and work for a political solution, after its predecessors HEP and DEP
were closed down by the Constitutional Court. HEP (People’s Labor Party) was the first
pro-Kurdish party in Turkey. It was formed in 1990, but due to some legal constraints, could not enter
the 1991 general election. Instead 22 HEP members joined the left-wing Socialist People’s Party
(SHP) and were voted into the parliament within the party lists of SHP18. During its brief lifespan,
HEP criticized the policy of the Turkish state against the Kurdish minority, stating that the Kurdish
issue could not be reduced to a terrorism problem, and insisted that a political solution was urgently
needed. It condemned the military option and stressed that the PKK was not a terrorist movement,
but rather, a political organization. It argued that the government should immediately begin a
process of dialogue which would also include the PKK as one of the sides, and HEP as the
mediator. They demanded cultural rights and political freedoms for the Kurdish minority. HEP was
closed down by the Constitutional Court in 1993. Party members reorganized under the roof of
DEP (Democracy Party) whose life span turned out to be even shorter than its predecessor. The
Constitutional Court closed the party down in 1994. Expecting this closure, party members were
already organized under the banner of HADEP (People’s Democracy Party) which then lived long
3. ETHNIC CONFLICT AND VOTE CHOICE
The theoretical insights for the association between ethnic conflict and vote choice stems
from several literatures20. At the very basic level we expect political behavior to be a product of
personal characteristics and environmental factors including socioeconomic conditions and social
networks21. A large literature of empirical works which have started to accumulate as early as the
1950s supports this argument and demonstrates the impact of environmantal factors on turnout, vote
choice, partisanship and political preferences22.
Civil conflicts create profound social changes. They reverse socioeconomic development;
trigger emigration; redistribute wealth and power in the society and consequently, change the
relative status of groups; and create and intensify hatreds23. Wood categorizes these changes under
six social processes: political mobilization, military socialization, the polarization of social
identities, the militarization of local authority, the transformation of gender roles, and the
fragmentation of the local political economy24. And she specifically argues that wartime
polarization may lead to electoral polarization, segregation, and a distrustful political culture.
The theory of issue voting labels social factors as issues and presents them as important
determinants of vote choice. According to this theory people vote for those candidates whose
positions on and salience attribution to issues they find similar to their own. Accordingly, parties
benefit from the salience of issues to which they are generally viewed as attaching highest
priority25. The salience of an issue varies over time and over individuals. The more salient the issue,
the greater the expected effect of issue ownership and issue proximity on an individual’s voting
decision26.
Civil conflicts raise the political salience of security issues, and also the salience of those
issues surrounding the conflict27. Violence creates security threats. A large body of literature in
and voting tendencies towards extreme right-wing parties who support aggressive policies to deal
with these threats28. In the Israeli case empirical findings show that feelings of insecurity increase
with every terrorist attack mounted against civilians29, and that security threats are important
predictors of the vote for radical right-wing parties30.
We can also gather theoretical insights from the constructivist arguments and the related
literature about how identity varies as a function of environmental incentives and strategic
manipulation31. Chandra and Wilkinson differentiate between nominal identities which are “those
identity categories in which an individual is eligible for membership based on the attributes that she
or he possesses”; and activated identities which are those that the individual choses among her
nominal identities to guide her behavior32. An important point here is that identity activation is
endogenous: It very much depends on the salience of group-specific attributes which in turn are
determined by the social context33. Ethnic conflicts provide drastic examples of how the social
context activates certain identities. Wilkinson and Haid argue that instead of being the product of
already solid ethnic identities, ethnic conflicts are best seen as an exercise in increasing the salience
of some dimensions and agendas over others34. Wilkinson even argues that ethnic conflicts are
provoked by political entrepreneurs to mobilize constituents around one ethnic identity rather than
another35. Indeed, Appadurai analyzes the genocide in Rwanda as a form of community-building, a
strategy designed to strengthen the identity of the perpetrators36. Manning and Roy argue that
national identification is sensitive to patterns of conflict by providing empirical evidence that
Catholics from Northern Ireland rarely think of themselves as British while a majority of
Protestants do37. Shayo and Zussman show how the Palestinian conflict affects judges in Israel and
demonstrate that attacks lead Arab judges to favor Arab plaintiffs and Jewish judges to favor Jewish
plaintiffs38. Shayo and Sambanis argue that ethnic conflicts not only make ethnic attributes more
reduce perceived similarity to the nation as a whole39. These conflicts also destroy and reallocate
resources between groups, which can directly affect both national and group status. In the Turkish
case, for example, Saatci discusses how the conflict impoverished thousands of Kurds by
dislocating them from their villages40. Finally, Byman points to the role of state repression in ethnic
conflicts in terms of identity creation, and argues how the Sri Lankan government’s violent
response to Tamil Tigers has created the perception that the Sri Lankan state and army act only in
the interest of the Sinhalese41. Similarly, Saatci depicts the Turkish-Kurdish conflict as a
“double-edged sword” which has contributed to the growth of ethnic consciuosness and nationalism on both
the Turkish and the Kurdish side42.
To summarize, theory offers us three main arguments based on which we can expect to see
an association between ethnic conflicts and vote choice: civil conflicts have profound effects on the
socioeconomic and political environment which in turn impacts upon vote choice; people tend to
vote for those candidates whose position on and salience attribution to issues are similar to their
own, and civil conflicts affect the relative salience of security issues and the issues surrounding the
conflict; ethnic conflicts activate ethnic identities and activated identities are those that shape our
political behavior.
4. THE MODEL
The data set comprises two observations for each county43, one for the 1995 general election
and one for the 1999 general election. Note that the data exhibit a multilevel character: the
observations are chronologically nested within counties, which in turn are geographically nested
within provinces. The presence of layers may violate the standard OLS assumption of independent
error terms if unobserved factors at the county and province levels lead the error terms to be
correlated. Ignoring the multilevel character of data risks erroneously low coefficient standard
fact have none44. To account for that risk we use the following multilevel linear model in which
unobserved county and province level factors are incorporated as random effects:
V
{t,i,j}=
α
+
β
C
{t,i,j}+
θ
N
{t,i,j}+
φ
K
{t,i,j}+
γ
X
{t,i,j}+
ω
E
{t}+
Ω
M
{t,i,j}+
ρ
{j}+u
{i,j}+
ε
{t,i,j}where
ρ
{j} is the province level error component,u
{i,j} is the county level error component, andε
{t,i,j} is the individual observation level error component, withE(ε{t,i,j})=0, Var (ε{t,i,j}) =σ2; E(u{i,j})=0
Var(u{i,j})=τ2; E(
ρ
{j})=0, Var(ρ
{j})=ς2; and Cov [ε{t,i,j},u{i,j}]=0, Cov [ε{t,i,j},ρ
{j}]=0, and Cov [u{i,j},ρ
{j}]=0.
V{t,i,j} is the vote share of the party on whose votes we explore the effects of the ethnic
conflict. We first explore the effects of the conflict on the vote share of the Kurdish-nationalist
party HADEP, and then we explore the effects on the vote share of the Turkish-nationalist MHP. t
denotes the time of election, i denotes the county and j denotes the province. C{t,i,j} is the number of
SFCs who died in the fight against the PKK since the previous election; N{t,i,j} is the turnout rate; K
{t,i,j} is the percentage of ethnically Kurdish population; X{t,i,j} is a vector of socioeconomic, and
demographic control variables;
E
{t} is an election dummy that takes on the value 1 for the 1995general election and zero for the 1999 general election; and M{t,i,j} is a dummy variable that takes on
the value 1 if county i of province j was under state of emergency at the time of election t45.
We employ the number of SFCs who died in the fight against the PKK in each county since
the previous general election as a measure of conflict intensity46. Admittedly, our measure falls
short of the total number of casualties which is the most commonly used measure of conflict
intensity in the literature. But, as we mentioned above, there is no detailed, complete and credible
panel data available on civilian and insurgent casualties. Hence our data on the SFCs constitute the
only available measure that can be used to assess the variation in the intensity of the conflict over
time and space. Moreover, we argue that it is a good measure first because we expect it to be highly
is a good measure of PKK presence in an area. While lack of data on civilian and insurgent
casualties, and PKK attacks prevents us from studying how correlated our measure would be with
such series across counties or provinces over time, the yearly aggregate numbers reported by the
Turkish General Staff 47 and the Federation of American Scientists (www.fas.org) enable us to
present some evidence of the correlation at the country level. The yearly country-wide aggregates
we have for the number of SFCs is 84% correlated with the yearly total casualty, and 98%
correlated with the yearly total PKK attack numbers that the Turkish General Staff reported. The
correlation between the yearly total casualty numbers reported by the Federation of American
Scientists is even higher at 97.4%. These high correlations are not surprising considering the fact
that attacks by the PKK, and offensive military operations by the Turkish security forces claim lives
from both sides. Unfortunately they also claim the lives of civilians. Also, village guards make up a
significant portion of total casualties, and in many cases village guards get killed alongside security
forces in PKK attacks on their villages, or during search or pursuit missions in the area. Another
major cause of civilian casualties is landmines laid down by both sides. Needless to say, landmine
casualties among security forces and civilians are expected to be highly correlated.
Moreover, we expect SFCs to be a strong predictor of PKK casualties as offensive military
operations by Turkish security forces usually follows PKK attacks, especially so when those attacks
result in heavy casualties on the security forces’ side. Once again, lack of data prevents us from
supporting our claim by empirical evidence from the Turkish case. Nevertheless, Jaeger and
Paserman’s48 study reveals a similar dynamic in the Israeli-Palestinian conflict. They find that the
incidence and levels of Palestinian fatalities can be predicted by the incidence and levels of Israeli
fatalities in the past two months.
Most importanly, as the correlation between the number of SFCs and PKK attacks clearly
insurgents and activity in an area causes a great deal of inconvenience for the civilian residents.
Not only it means that they can get caught in crossfire, or become a landmine victim, it also means
that their daily lives are disturbed by the heightened security measures like the increased number of
security personnel in the area, and the frequent security checks and controls that are imposed on the
civilians, and also by the frequent interruption of economic activity as a result of attacks and armed
skirmishes between security forces and the PKK. In many cases it also means that they will be
pressured, threatened or even killed by combatants who may accuse them of collaborating with the
enemy. Thus, we argue that, SFCs provide a good measure of the intensity of the conflict and the
level of political violence civilians are exposed to.
The vector of socioeconomic and demographic variables X{t,i,j} includes population size,
population growth rate, level of urbanization, unemployment rate, average household size and
literacy rate.
Population measures are frequently used variables in modeling electoral behavior49.
Population size measures the total population of the county in thousands; population growth rate is
the average yearly growth rate of the county population since the last census; and level of
urbanization is the percentage of county population living in the county center. Population size and
the level of urbanization in a locality may influence vote choice through their effects on the
availability of and level of exposure to alternative sources of information. Population growth rate
reflects the migration patterns in a locality which may have an influence on the vote choice of
inhabitants.
One of the stylized facts of the economic voting literature is that voting reacts to a few
macroeconomic variables, mainly unemployment and inflation50. Unfortunately, there are no county
(nor province) level inflation data available for Turkey. Accordingly, the rate of unemployment,
macroeconomic control variable.
The average household size is a proxy to capture the center-periphery distinction in the
Turkish society. In his seminal work, which has heavily influenced the literature on electoral
behavior in Turkey, Mardin argues that the center-periphery relations provide a good explanatory
scheme to understand Turkish politics51. According to this scheme, the Turkish political system is
composed of a coherent body of nationalist, laicist, etatist, educated, urban, "elite" which
constitutes the "center; and a "periphery" constituted by the more traditional, more conservative,
more religious, more rural, "antietatist" populations. The center-periphery divide in the Turkish
politics nicely coincides with the left-right divide. Recent survey studies confirm that the
center-periphery framework still retains its validity for Turkish politics52. Çarkoğlu and Hinich based on
the results of a 2001 survey, conclude that two dimensions dominate the ideological competition in
the Turkish party system: the secularist vs. pro-Islamist cleavage which again largely overlaps with
the center versus periphery formations in Turkish politics; and the ethnic based nationalist cleavage
contrasting the Turkish and Kurdish identities53.
Household size is a good measure of conservatism as it is positively correlated with the level
of religious conservatism, and agricultural employment, and negatively correlated with the
education level of women. Thus, we argue that it can be used to capture the center-periphery
dichotomy.
Finally, literacy rate is included as a measure of political awareness, and social development
in a county.
5. DATA
5.1. Data on Security Force Casualties
The casualty data set includes the date, and place of death at the county level for a total of
period in between the 1991 and 1999 general elections, which is the period we will be focusing on
in our analyses, harbors 4794 of them. This is a unique data set that we constructed by bringing
together the information we obtained from numerous sources including the Turkish General Staff,
Ministry of Defense, Administration of Police Forces, local administrations, civil society
organizations, and newspaper archieves. We explain the data collection process and the sources we
referred to in detail in the Appendix.
Our data set constitutes the only available detailed information on the casualties of the
conflict in Turkey. Nevertheless, it has its limitations. First of all, we only have information on the
security force casualties. Admittely, a better measure would include civilian and insurgent casualties
as well, but unfortunately there is no credible and publicly available information on them. On the
other hand, we are confident in the reliability of our data on SFCs. As we explain in more detail in
the Appendix, the information for the casualties of the 1984-September 1998 period comes directly
from the Turkish Ministry of Defense personnel archieves. This is actualy the most reliable source
for this type of information, and consequently we do not expect to have any unaccounted or
misreported casualties for this period. Furthermore, to guarantee the reliability of our information
on the SFCs of the October 1998 - April 1999 period we referred to several sources simultaneously,
in many cases including the families of the deceased, and cross checked the information on each
casualty.
The second limitation of our data set is that we only have information on place of death at
the county level. While some of these casualties took place in or close to villages, towns or cities,
some of the soldiers were killed in clashes in remote mountaneous areas quite far from populated
centers. Because we do not have the exact location of death, we are not able to control for the
distance of the violent act to the nearest settlement, and consequently, we treat all casualties the
Chart 2(a) and Chart 2(b) below provide visual representations of the distribution of SFCs at
the county level in the 1991-1995, and the 1995-1999 period respectively. They reveal the
concentration of PKK attacks in southeastern Turkey54.
Chart 2(a): The Distribution of SFCs, 1991-1995
5.2. Data on Elections
We employ the county level results of the December 24th, 1995, and April 18th, 1999
parliamentary elections. The data are obtained from the Turkish Institute of Statistics. The usage of
county level data on actual vote choice is an important aspect of this study. Note that most studies in
the literature employ individual level survey data to analyze the association between conflict and
political attitudes and behavior. Individual level survey data allows researchers to more effectively
control for exposure to violence, and personal characteristics of voters including psychological and
perceptional factors, level of awareness, ideological preferences, and party identification which are
important determinants of vote choice. Nevertheless, it also raises significant concerns in terms of
representativeness of the sample, and in terms of non-response and response biases. In many cases
the intensity of the conlict, security concerns, or limitations imposed by the authorities may render
it impossible to reach certain locations and their residents. Moreover, declarations may always
differ from actual behavior, especially when respondents try to give the “appropriate” answers, or
refrain from answering certain questions. Usage of county-level actual votes eliminates such
concerns. We should also emphasize the importance of studying the actual political reaction of
people to conflict because, in nonauthoritarian societies, this reaction greatly influences government
policies.
Turkey had 7 general elections since the start of armed attacks by the PKK in 1984. We
focus on the 1995 and 1999 general elections for several reasons. First of all, a Kurdish-nationalist
party competed only in the 1995, 1999, and 2002 general elections55.
Our second reason for focusing on the 1995 and 1999 general elections is the limited
availability of county level socieconomic indicators. The only source of country-wide socieconomic
data at the county level in Turkey is the population censuses which were held every five years
censuses were completely abandoned to be replaced by a new computerized system of population
registration. Unfortunately, during the transition period which lasted until 2007, no county level
data were released. In short, we only have 1990 and 2000 values for our county level
socioeconomic controls, and this obliges us to choose two elections among the feasible three. The
choice about which elections to study is actually dictated by the cease-fire that lasted from the
second half of 1999 until 2004. The fact that the PKK ceased its attacks between the 1999 and 2002
elections renders our measure of ethnic conflict inappropriate for the period. Consequently, we use
the indicators derived from the 1990 census results as our socioeconomic controls for the 1995
general election, and the ones derived from the 2000 census results as our controls for the 1999
general elections56.
Table 1 displays the major political parties that entered the 1995 and 1999 elections, the
percentage of votes they received, and their general ideological placement57.
Table 1: Political parties that entered the 1995 and 1999 general elections, and the percentage votes they received
1995 1999
ANAP (center-right) 19.6 13.22
DSP (center-left) 14.6 22.19
DYP (center-right) 19.2 12.01
HADEP (Kurdish-nationalist) 4.2 4.75
MHP (Turkish-nationalist) 8.2 17.98
RP/FP (pro-Islamist) 21.4 15.41
CHP (center-left) 10.7 8.7
5.3. Data on Socioeconomic and Demographic Indicators
We derive our socioeconomic variables from two county-level development studies
conducted by the State Planning Agency based on the 1990 and 2000 censuses58.
The data set also contains an estimate of the ethnically Kurdish population percentage in
trying to capture the electoral response to ethnic political violence should control for the ethnic
make up of the society, the lack of data dictates their omission in many cases leading to
spuriousness concerns. The inclusion of this control eases such concerns for our analyses.
We derive our Kurdish population estimates by combining the results of the 1965 census
with those of the 1990 and 2000 censuses. The 1965 population census is the last census in Turkey
to include questions about mother tongue. Considering those who reported Kurdish as their mother
tongue in 1965 as ethnically Kurdish, and aggregating the results at the province level, Mutlu
(1993) reports the 1965 Kurdish population percentages of provinces in Turkey59. Combining these
1965 provincial percentages, and the 1990 and 2000 census results which provide information on
birthplace distribution of county residents, we derived average expected Kurdish population
percentages for counties for 1990 and 2000. To do this, we used the 1965 provincial Kurdish
population percentages as probabilities of being Kurdish for people who were born in those
provinces60. These estimates put the total of ethnic Kurds in Turkey to 14% of the population in
1990, and to little more than 15% in 2000. Note that the estimate for 2000 is very close to the result
of the 2006 survey study we have mentioned before which puts the total to 15.6%61.
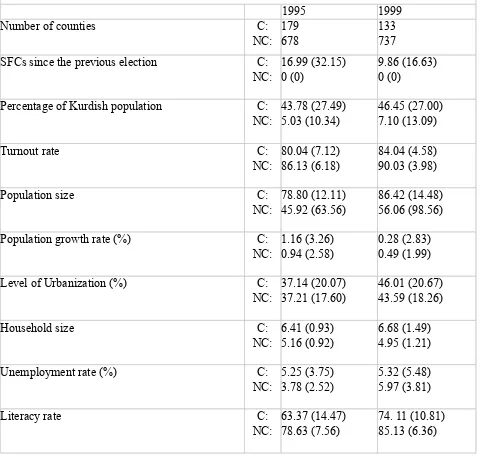
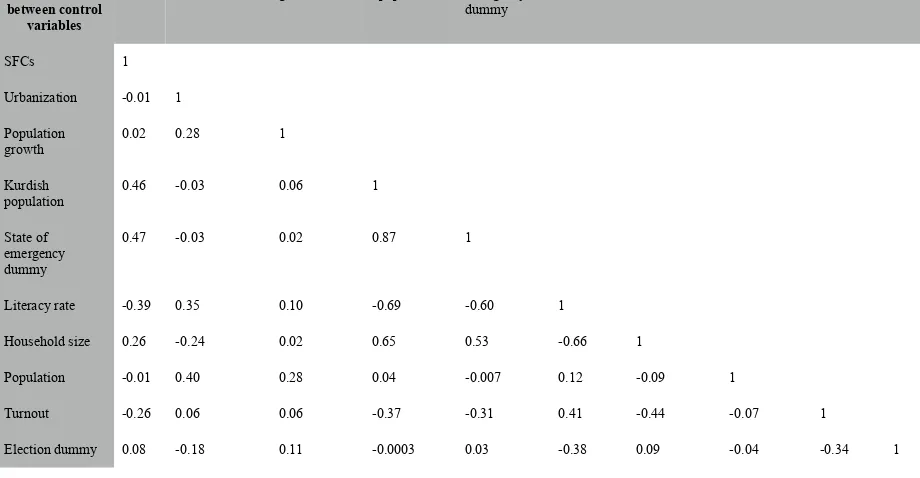
Table 2 displays the mean values and standard deviations for the control variables included
in the analyses. The table distinguishes between counties that suffered at least one SFC in the
Table 2: Summary statistics
(C) gives the mean value for counties with at least one SFC in between the general elections. (NC) gives the mean value for counties with no casualty in the same period.
Values in parentheses are standard deviations.
Table 2: Summary statistics
(C) gives the mean value for counties with at least one SFC in between the general elections. (NC) gives the mean value for counties with no casualty in the same period.
Values in parentheses are standard deviations.
Table 2: Summary statistics
(C) gives the mean value for counties with at least one SFC in between the general elections. (NC) gives the mean value for counties with no casualty in the same period.
Values in parentheses are standard deviations.
Table 2: Summary statistics
(C) gives the mean value for counties with at least one SFC in between the general elections. (NC) gives the mean value for counties with no casualty in the same period.
Values in parentheses are standard deviations.
1995 1999
Number of counties C:
NC: 179 678
133 737
SFCs since the previous election C:
NC:
16.99 (32.15) 0 (0)
9.86 (16.63) 0 (0)
Percentage of Kurdish population C:
NC:
43.78 (27.49) 5.03 (10.34)
46.45 (27.00) 7.10 (13.09)
Turnout rate C:
NC:
80.04 (7.12) 86.13 (6.18)
84.04 (4.58) 90.03 (3.98)
Population size C:
NC:
78.80 (12.11) 45.92 (63.56)
86.42 (14.48) 56.06 (98.56)
Population growth rate (%) C:
NC:
1.16 (3.26) 0.94 (2.58)
0.28 (2.83) 0.49 (1.99)
Level of Urbanization (%) C:
NC:
37.14 (20.07) 37.21 (17.60)
46.01 (20.67) 43.59 (18.26)
Household size C:
NC:
6.41 (0.93) 5.16 (0.92)
6.68 (1.49) 4.95 (1.21)
Unemployment rate (%) C:
NC:
5.25 (3.75) 3.78 (2.52)
5.32 (5.48) 5.97 (3.81)
Literacy rate C:
NC:
63.37 (14.47) 78.63 (7.56)
74. 11 (10.81) 85.13 (6.36)
6. RESULTS
6.1. The Vote Share of Kurdish-Nationalists
We estimate our model using the restricted maximum likelihood (REML)62 estimation
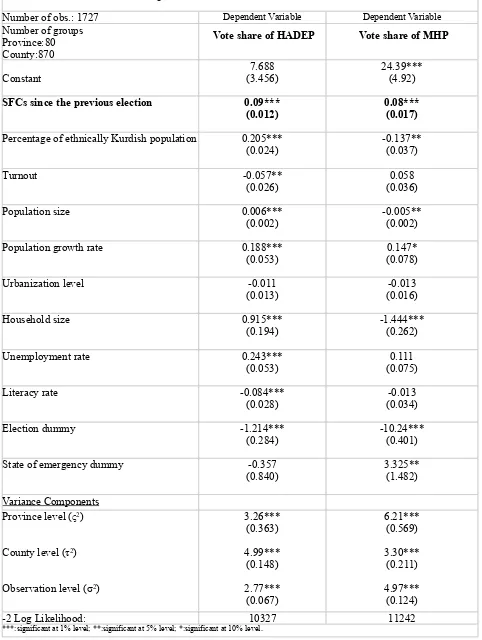
The column on the left in Table 3 below presents the results of the regression analyses
testing the effects of the conflict on the vote share of the Kurdish-nationalist HADEP. The
estimated coefficient of SFCs is positive and highly significant. Each additional SFC, on the
average is associated with a 0.09 percentage point increase in the vote share of HADEP. The
magnitude of this result is better understood by considering that the average number of SFCs in the
109 counties which were under the state of emergency in the 1991-1995 period was 24, and that
there were 23 counties with more than 50 casualties, and 6 with more than 100. In other words, the
ethnic conflict was, on the average, associated with a 2 percentage point increase in the vote share
of HADEP in the 1995 election in counties under the state of emergency, and with more than 5
percentage point increase in counties with casualties over 50. Chart 3 below visualizes the results.
It depicts what happens to HADEP votes when you move from a county with no SFCs to a county
with average number of SFCs, holding everything else constant63. The curve on the left plots the
density of expected HADEP vote share in a county with no SFCs. The curve to the right plots the
density in a county with 17 SCFs, which is the average number of SFCs in counties with positive
casualties. As the chart demonstrates, HADEP votes go up by about 2 percentage points on the
average as the number of SFCs increase from zero to 17. The simulation exercise when controls
are set at their mean values for 1999 yields a very similar picture.
Note that some of the socioeconomic controls like household size, literacy rate and
unemployment rate turn out to be highly significantly and substantially associated with HADEP
votes. One explanation for these results might the cultural differences between ethnic Kurds and
Turks, and the religious conservatism of ethnically Kurdish populations in Turkey. Consequently,
ethnic Kurds tend to have higher birth rates, live in bigger households, and have lower literacy
rates, especially among women. In fact, as can be seen in Table.A6 in the Appendix, our estimates
with literacy rate across counties for the period we are analyzing64. In other words, along with our
ethnic population estimates, these controls might be picking up the ethnic dimension of the votes
for HADEP. The significant, highly substantial and negative association between houshold size
and MHP vote share supports this argument as well. The significant association between
unemployment rate and HADEP votes might be due to the fact that HADEP, in terms of economic
policy, was a leftist party which supported socialist ideals and a welfare state. The low correlation
between unemployment rate and ethnic Kurdish population estimates across counties does not
support arguments based on ethnic discrimination in employment. Finally, one can argue that the
detrimental impacts of the conflict on economic activity might lead to higher unemployment rates
in the conflict zone, which might then impact upon vote choices. While this is a valid argument,
the near zero correlation between unemployment rate and SFCs across counties, and the fact that
we fail to see any significant impact on the vote share of Turkish nationalists lead us to think that it
can only be a partial one.
2 3 4 5 6 7 8
0.0
0.2 0.4 0.6 0.8
Chart 3:Simulated HADEP Vote Shares
Expected HADEP Votes
D
en
si
TABLE 3: Effect on the Vote Share of Ethnic-Nationalist Parties
Estimates from the mixed effects REML regressions
TABLE 3: Effect on the Vote Share of Ethnic-Nationalist Parties
Estimates from the mixed effects REML regressions
TABLE 3: Effect on the Vote Share of Ethnic-Nationalist Parties
Estimates from the mixed effects REML regressions
Number of obs.: 1727 Dependent Variable Dependent Variable
Number of groups Province:80 County:870
Vote share of HADEP Vote share of MHP
Constant (3.456)7.688 24.39***(4.92)
SFCs since the previous election 0.09***
(0.012) 0.08***(0.017)
Percentage of ethnically Kurdish population 0.205***
(0.024) -0.137**(0.037)
Turnout -0.057**
(0.026) (0.036)0.058
Population size 0.006***
(0.002) -0.005**(0.002)
Population growth rate 0.188***
(0.053) (0.078)0.147*
Urbanization level -0.011
(0.013) (0.016)-0.013
Household size 0.915***
(0.194) -1.444***(0.262)
Unemployment rate 0.243***
(0.053) (0.075)0.111
Literacy rate -0.084***
(0.028) (0.034)-0.013
Election dummy -1.214***
(0.284) -10.24***(0.401)
State of emergency dummy -0.357
(0.840) 3.325**(1.482)
Variance Components Province level (ς2)
County level (τ2)
Observation level (σ2)
3.26*** (0.363) 4.99*** (0.148) 2.77*** (0.067) 6.21*** (0.569) 3.30*** (0.211) 4.97*** (0.124)
-2 Log Likelihood: 10327 11242
6.2. The Vote Share of Turkish-Nationalists
The column on the right in Table 3 above displays the results for the second set of
regressions investigating the effects of the conflict on the vote share of Turkish-nationalists. Each
additional SFC is, on the average, associated with a 0.08 percentage point increase MHP’s vote
share. In other words, the ethnic conflict is, on the average, associated with a 2 percentage point
increase in the vote share of MHP in the 1995 election in counties under the state of emergency, and
with more than 4 percentage point increase in counties with casualties over 50. Chart 4 below
visualizes the results. It depicts what happens to MHP votes when you move from a county with no
SFCs to a county with average number of SFCs, holding everything else constant. The bell shaped
curve on the left plots the density of expected MHP vote share in a county with no SFCs, while the
curve to the right plots the density of expected MHP vote share in a county with 17 SCFs. As can
be seen, MHP votes are on the average 2 percentage points higher in counties with average number
of SFCs. The simulation exercise when controls are set at their mean values for 1999 yields a very
similar picture.
4 6 8 10 12
0.0
0.1 0.2 0.3 0.4
Chart 4:Simulated MHP Vote Shares
Expected MHP Votes
D
en
si
The results on the vote shares of the ethnic nationalist parties reveal that the ongoing ethnic
conflict in Turkey is associated with a rise in both Kurdish and Turkish nationalism in the country65.
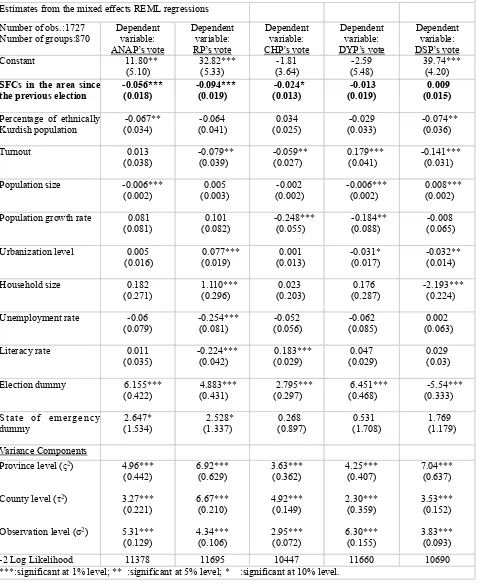
To provide a more complete picture of the effects of the conflict on the electoral landscape
we also examine the individual vote shares of the other parties that competed in the 1995 and 1999
elections. Table A1 in the Appendix reports the results of the regressions when the dependent
variable is the individual vote share of ANAP, RP, CHP, DYP, and DSP respectively. The first three
of these parties had a relatively moderate stance on the Kurdish question during the time period we
are analyzing66. The results clearly demonstrate the negative association between the ethnic conflict
and the vote shares of these moderate parties. The remaining two, DYP and DSP, ideologically
stood somewhere in between the moderates and the extreme MHP on the Kurdish-Turkish
nationalist cleavage67. Note that we fail to find any significant association between the vote shares
of these two parties and the ethnic conflict in the period under study.
The results clearly demonstrate how the ethnic conflict in Turkey increases the political
salience of ethnic nationalism, and polarizes the electorate along an ethnic nationalist cleavage. In
that sense they support the theoretical insights about the positive association between ethnic
conflicts and the salience of ethnic issues. They are also in line with the issue voting and issue
ownership arguments. The conflict is pushing the electorate towards extreme ethnic nationalists
who are perceived to be the champions of ethnic issues while hurting the political success of those
with relatively moderate stances. Moreover, they support Wood’s (2008) argument about the
electorally polarizing effects of civil conflicts68. Polarization has vast ramifications for a country’s
political system. As argued in Sartori’s seminal work, polarization causes centrifugal pressures that
shift away the support for centrist parties and inhibit the formation of stable parliamentary
majorities69. This directly leads to the fragmentation and destabilization of democratic regimes. In
policies, thus undermining the country’s political and economic performance. In the case of ethnic
conflicts, polarization along an ethnic nationalist cleavage does not really bode well for a peaceful
and timely resolution as the poles tend to have irreconcilable views on the issues surronding the
conflict and the ways to deal with them. Polarization then implies that these irreconcilable views are
taking hold in the society more and more as a result of the conflict itself. Collier et al. discuss how
civil conflicts through their adverse effects on the economy create a trap that makes peaceful
resolution even more difficult70. The results we have here point to another trap ethnic conflicts
create, namely, the polarization trap. Given the adverse effects of polarization, these results can
help us understand why civil conflicts last long; why they do not end in peaceful, negotiated
settlements more often; and why they leave societies marked for future conflict.
6.3 Ethnic Conflicts and Ethnic Identity
The task that remains now is to understand the characteristics of the observed electoral
polarization. If the constructivist insight about the endogeneity of ethnic identity to ethnic conflicts
is valid then we can expect this polarization to actually be a reflection of an ethnic polarization that
is associated with the conflict. Unfortunately, because we do not have individual level data we can
not say anything about the ethnic make up of votes. Nevertheless, the ethnic nationalist appeal of
the political parties under investigation here, the ethnic nature of the conflict, and the significant
positive (negative) association between the Kurdish population percentages and the vote share of
Kurdish nationalists (Turkish-nationalists) lead us to hypothesize that what we are seeing is in fact a
positive association between the conflict and ethnic Kurdish votes for the Kurdish-nationalists, and
similarly a positive association between the conflict and ethnic Turkish votes for the
Turkish-nationalists. And if that is the case then it means that ethnic conflicts not only raise the political
itself among ethnic groups in the society, and that the constructivists are making a valid argument.
So far, due to lack of individual level data, and the difficulty of measuring concepts like identity and
salience of identity, literature offers limited empirical evidence to support this argument. And in
many cases, the evidence does not go beyond anectodal references to the “legacy of hatred”71.
Unfortunately, the Turkish case also suffers from the lack of individual level data on ethnic
identity and vote choice. Nevertheless, King offers us a method of “reconstructing individual
behavior from aggregate data”72. King’s ecological inference (ei) methodology allows us to use the
ethnic population percentages we derived to estimate the ethnic Kurdish and Turkish73 votes for
HADEP and MHP in the 1995 and 1999 general elections74. We then use these estimates to test
whether the conflict increases the political salience of ethnic identities.
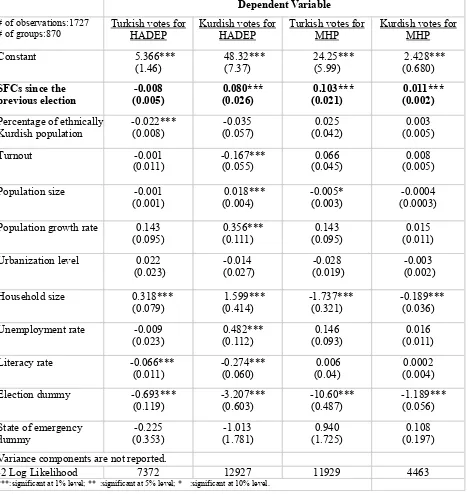
The results of this exercise are presented in Table 4 below. We reestimate our base model
using the estimated ethnic Kurdish and Turkish votes for HADEP and MHP respectively as our
dependent variable. The estimated parameters reveal the significant positive association between
the conflict and the votes the two ethnic nationalist parties receive from their coethnics. In other
words, they give support to the conjecture that the conflict increases the political salience of ethnic
identity leading ethnic Kurds to vote for Kurdish-nationalists, and ethnic Turks to vote for
Turkish-nationalists75.
Note that these results should be viewed as substantially more speculative than the main
results presented in Table 3, and should not be taken as conclusive evidence since they are not based
on a very rich set of information to begin with. Given the fact that actual ethnic votes are not
observable, and that ecological inferences expose one to the risk of ecological fallacies, we present
these results cognizant of their limitations. We argue that the results, should be read as preliminary
evidence and as a suggestion that future research should take into account the constructivist
TABLE 4: Effects of the Ethnic Conflict on Ethnic Votes for Ethnic-Nationalists TABLE 4: Effects of the Ethnic Conflict on Ethnic Votes for Ethnic-Nationalists TABLE 4: Effects of the Ethnic Conflict on Ethnic Votes for Ethnic-Nationalists TABLE 4: Effects of the Ethnic Conflict on Ethnic Votes for Ethnic-Nationalists TABLE 4: Effects of the Ethnic Conflict on Ethnic Votes for Ethnic-Nationalists
Estimates from the mixed effects REML regressions Estimates from the mixed effects REML regressions Estimates from the mixed effects REML regressions Estimates from the mixed effects REML regressions Estimates from the mixed effects REML regressions
Dependent Variable Dependent Variable Dependent Variable Dependent Variable
# of observations:1727
# of groups:870 Turkish votes for HADEP Kurdish votes for HADEP Turkish votes for MHP Kurdish votes for MHP
Constant 5.366***
(1.46) 48.32***(7.37) 24.25***(5.99) 2.428***(0.680)
SFCs since the
previous election (0.005)-0.008 0.080***(0.026) 0.103***(0.021) 0.011***(0.002)
Percentage of ethnically
Kurdish population -0.022***(0.008) (0.057)-0.035 (0.042)0.025 (0.005)0.003
Turnout -0.001
(0.011) -0.167***(0.055) (0.045)0.066 (0.005)0.008
Population size -0.001
(0.001) 0.018***(0.004) -0.005*(0.003) (0.0003)-0.0004
Population growth rate 0.143
(0.095) 0.356***(0.111) (0.095)0.143 (0.011)0.015
Urbanization level 0.022
(0.023) (0.027)-0.014 (0.019)-0.028 (0.002)-0.003
Household size 0.318***
(0.079) 1.599***(0.414) -1.737***(0.321) -0.189***(0.036)
Unemployment rate -0.009
(0.023) 0.482***(0.112) (0.093)0.146 (0.011)0.016
Literacy rate -0.066***
(0.011) -0.274***(0.060) 0.006(0.04) (0.004)0.0002
Election dummy -0.693***
(0.119) -3.207***(0.603) -10.60***(0.487) -1.189***(0.056)
State of emergency
dummy (0.353)-0.225 (1.781)-1.013 (1.725)0.940 (0.197)0.108 Variance components are not reported.
Variance components are not reported.
-2 Log Likelihood 7372 12927 11929 4463
***:significant at 1% level; ** :significant at 5% level; * :significant at 10% level. ***:significant at 1% level; ** :significant at 5% level; * :significant at 10% level. ***:significant at 1% level; ** :significant at 5% level; * :significant at 10% level. ***:significant at 1% level; ** :significant at 5% level; * :significant at 10% level.
7. ROBUSTNESS TESTS
We have performed several robustness checks on the main results presented in Table 3.
These tests show that the positive association between the ethnic conflict and the vote shares of
ethnic nationalist parties are robust to alternative specifications of the model, and the conflict
results of the tests are presented in the Appendix. Table A2 presents the results when the number of
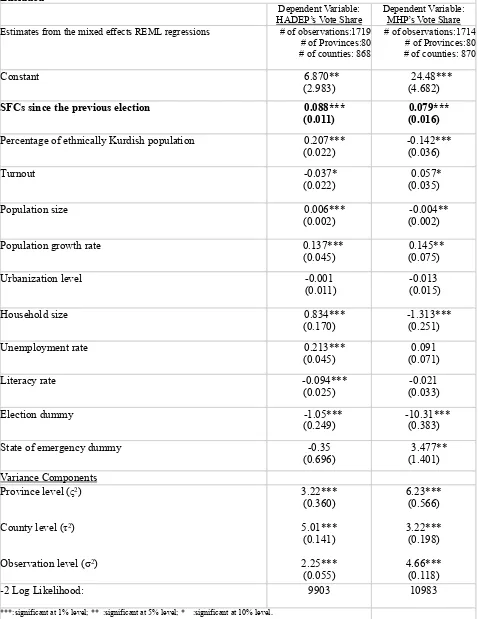
SFCs include those who died in attacks in neighboring counties as well76. Table A3 presents the
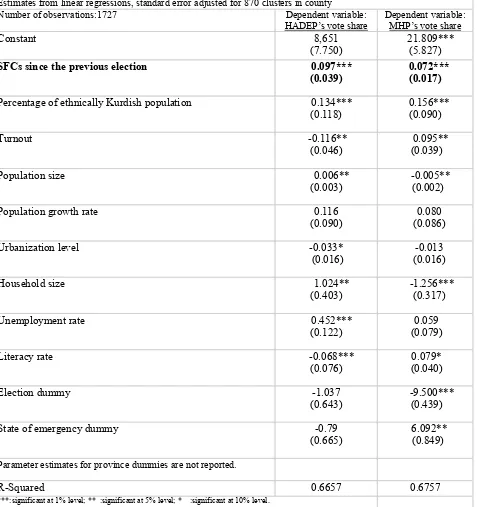
results when the model is specified with fixed province effects and county level clustered errors.
Table A4 presents the results when outlier observations are excluded from the data set77. As can be
seen, the results remain robust.
7.2 Reverse Causality
One concern in estimating the effects of political violence on vote choice is that there may be a
dynamic interaction between these two variables. In other words, while violence may influence
voting behavior, it may also be staged in response to electoral choices. In such a case, estimates of
the effects of political violence on vote choice will be biased. Note that the situation in Turkey does
not warrant such a concern. As we have already mentioned, PKK attacks have been concentrated in
southeastern Turkey. The area is chosen not because of its residents’ electoral profile but because it
was claimed as part of the Kurdish homeland by the PKK, and also because the mountainous
terrain, which borders Syria, Iraq, Iran, and Armenia, helped guerilla warfare and provided the
insurgents with shelters, and escape routes. Moreover most attacks targeted military facilities rather
than civilian targets. Nevertheless, to scientifically assess that reverse causality is not creating any
specification problems in our analyses, we estimated the coefficients of the following equation to
see if the number of SFCs in between two elections is determined by the results of the prior
election:
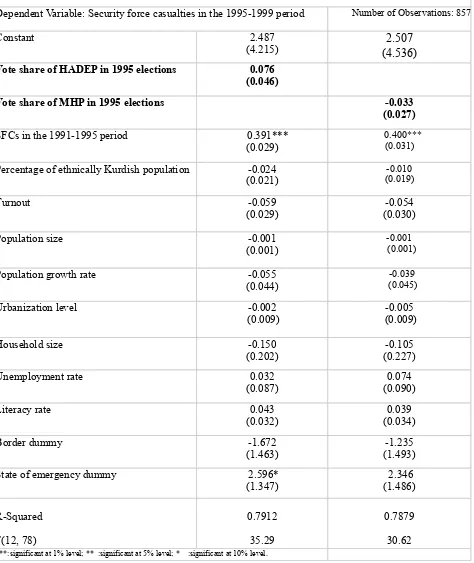
C{t,i,j}=α + βC{t-1,i,j}+ηV{t-1,i,j}+θN{t-1,i,j}+φK{t-1,i,j} + γX{t-1,i,j} +ΩM{t-1,i,j}+ ρS{i,j} +ε{t,i}
where t denotes the election year, i denotes the county, and j denotes the province. C{t,i.j} is the
number of SFCs who died in the fight against the PKK insurgency between the election at (t-1) and
against the PKK insurgency between the election at (t-2) and the election at (t-1); V{t-1,i,j} is the vote
share of the party we are interested in in the (t-1) election; N{t-1,i,j} is the turnout rate; K{t-1,i,j} is the
percentage of ethnically Kurdish population; X{t-1,i,j} is the vector of socioeconomic variables; M
{t-1,i,j} is a dummy that takes on the value 1 if the county was under state of emergency in (t-1); and
finally S{i,j} is a dummy variable that takes on the value 1 if the county has a border with Iraq, Syria,
Iran, or Armenia.
We estimate the above equation for the 1995-1999 period (t=1999) using OLS with clustered
errors at the province level78. Unfortunately we are not able to conduct a similar analysis for the
1991-1995 period to see whether the SFCs of the period was determined by the Kurdish and/or
Turkish-nationalist votes in the 1991 general election since neither MHP nor HADEP entered the
1991 general elections. Table A.5 in the Appendix displays the results. None of the estimated βs are
significant indicating that the data do not support the reverse causality hypothesis.
9. CONCLUSION
This study analyzes the effects of the Turkish-Kurdish ethnic conflict on the electoral
choices of Turkish voters in the 1995 and 1999 general elections. The results demonstrate a
significant positive association between the conflict and the vote shares of Kurdish and
Turkish-nationalist parties, and as such, they indicate the polarization of the electorate along an ethnic
nationalist cleavage. Given the completely opposing views of these parties on how to resolve the
conflict, such a polarization does not actually bode well for a peaceful and timely resolution. It
seems the conflict is leading people to mass behind two opposing groups with irreconcilable claims
about the reasons of and solutions to the conflict. What the Turkish case is presenting us here is, in a
sense, a circular structure with ethnic conflict feeding political polarization which then renders a
similar argument in his seminal work on ethnic conflicts when he talks about how ethnic parties
may exacerbate ethnic conflict by coming up with “mutually incompatible” claims to power79. We
argue that, along with the other results in the literature on the detrimental sociopolitical effects of
civil conflicts, the polarization trap can shed further light on the self-perpetuating dynamics of these
conflicts, and can help us better understand the reasons behind their resilience.
We also present some preliminary evidence that what we are observing is not just a political
polarization along an ethnic nationalist dimension, but also a rise in the political salience of ethnic
identities which then reflects on vote choice. The results of the ecological regressions reveal how
the conflict increasingly brings ethnic identities to the forefront in vote choice, and thus, further
deepens the ethnic cleavage in the society.
The observed ethnic nature of most civil conflicts has led scholars to devise and test various
hypotheses on how conflict and the number of ethnic groups in a society are related80. Interestingly,
a good portion of these failed to establish a clear association which then led scholars on a quest for
better ethnic heterogeneity measures81. Note that while these studies significantly advance our
understanding of ethnic conflicts, they all, implicitly or explicitly, assume that the salience of ethnic
identity for any two co-ethnics will be the same for both and will remain fixed. In other words, they
ignore the constructivist insight about the endogeneity of the salience of ethnic identities to ethnic
conflict itself. The results in this paper support this insight. If it is not just ethnic identity itself but
rather the salience of that identity that drives people’s behavior, then this endogeneity might
actually explain why scholars have so far not been able to establish a clear link between ethnicity
and ethnic conflict even though they strongly suspect that it exists. We therefore close by
emphasizing the need to find new and novel ways to incorporate the dynamic link between ethnic
APPENDIX
Data Sources for Security Force Casualties:
Our main source for military casualties is a publication, named "Our Martyrs (Șehitlerimiz)",
published by the Turkish Ministry of Defense in late 1998. The publication lists the names, ranks,
and place of death of all Turkish soldiers who died in the fight against the PKK insurgency in the
August 1984-September 1998 period. In total, the list contains information on 5554 soldiers. This
publication actually provides the most credible, and accurate information on military casualties as
the information is directly taken from the personnel archives of the Ministry of Defense.
Unfortunately, the list covers casualties up to mid 1998, and detailed information on place of death
is missing for gendermarie casualties. In order to bring the database up to date with detailed
information on places of death, we referred to various other sources. We contacted the Associations
of the Families of Martyrs 82 in 28 provinces. These associations are civil society organizations
founded by families of soldiers and police officers who died in service, to help each other cope with
the situation. They helped us greatly in gathering information about the SFCs from their area. We
have also contacted and obtained information from numerous military bases in different parts of the
country, and also the Gendarmerie Museum in Ankara which has an extensive database on
gendarmerie casualties. Another important source has been the archives of daily newspapers. We
searched through the daily archives of five major Turkish newspapers (Milliyet, Cumhuriyet,
Zaman, Sabah, Hurriyet) for news on PKK attacks. Even though the newspapers did not cover all
the attacks and all the casualties, they still provided information on a good deal of them. The
internet has been another important source of information. We have conducted searches using
related words like PKK, attack, Kurdish conflict, terror, martyr, etc. and skimmed through
thousands of websites that came up on these searches. We referred to some 359 of these websites83.
governorships, municipalities, village associations, and civil society organizations. Finally, we
obtained the information on the casualties of the police forces directly from the public relations
[image:33.595.63.548.158.742.2]office of the Administration of Security Forces.
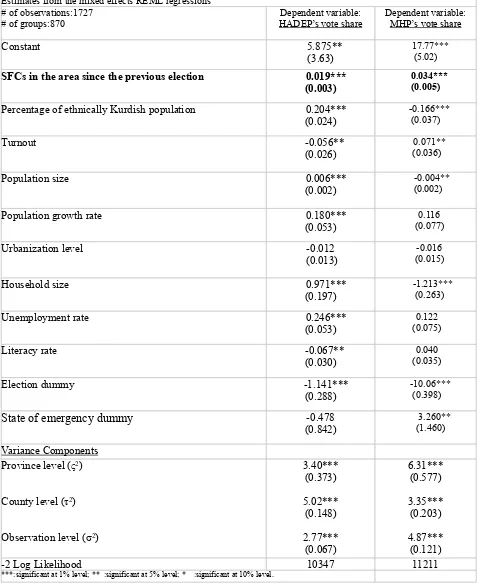
TABLE A1: Effects of the Ethnic Conflict on the Vote Share of the Other Political Parties TABLE A1: Effects of the Ethnic Conflict on the Vote Share of the Other Political Parties TABLE A1: Effects of the Ethnic Conflict on the Vote Share of the Other Political Parties TABLE A1: Effects of the Ethnic Conflict on the Vote Share of the Other Political Parties TABLE A1: Effects of the Ethnic Conflict on the Vote Share of the Other Political Parties TABLE A1: Effects of the Ethnic Conflict on the Vote Share of the Other Political Parties
Estimates from the mixed effects REML regressions Estimates from the mixed effects REML regressions Estimates from the mixed effects REML regressions
Number of obs.:1727
Number of groups:870 Dependent variable: ANAP’s vote Dependent variable: RP’s vote Dependent variable: CHP’s vote Dependent variable: DYP’s vote Dependent variable: DSP’s vote
Constant 11.80**
(5.10) 32.82*** (5.33) (3.64)-1.81 (5.48)-2.59 39.74*** (4.20)
SFCs in the area since
the previous election -0.056***(0.018) -0.094***(0.019) -0.024*(0.013) -0.013(0.019) (0.015) 0.009
Percentage of ethnically
Kurdish population -0.067**(0.034) (0.041) -0.064 (0.025) 0.034 (0.033) -0.029 -0.074**(0.036)
Turnout 0.013
(0.038) -0.079** (0.039) -0.059** (0.027) 0.179*** (0.041) -0.141*** (0.031)
Population size -0.006***
(0.002) (0.003) 0.005 (0.002) -0.002 -0.006*** (0.002) 0.008*** (0.002)
Population growth rate 0.081
(0.081) (0.082) 0.101 -0.248*** (0.055) -0.184** (0.088) (0.065) -0.008
Urbanization level 0.005
(0.016) 0.077*** (0.019) (0.013) 0.001 -0.031* (0.017) -0.032** (0.014)
Household size 0.182
(0.271) 1.110*** (0.296) (0.203) 0.023 (0.287) 0.176 -2.193*** (0.224)
Unemployment rate -0.06
(0.079) -0.254*** (0.081) (0.056)-0.052 (0.085)-0.062 (0.063)0.002
Literacy rate 0.011
(0.035) -0.224*** (0.042) 0.183*** (0.029) (0.029)0.047 (0.03)0.029
Election dummy 6.155***
(0.422) 4.883*** (0.431) 2.795*** (0.297) 6.451*** (0.468) -5.54*** (0.333)
State of emergency
dummy (1.534)2.647* 2.528* (1.337) (0.897) 0.268 (1.708) 0.531 (1.179) 1.769
Variance Components Province level (ς2)
County level (τ2)
Observation level (σ2)
4.96*** (0.442) 3.27*** (0.221) 5.31*** (0.129) 6.92*** (0.629) 6.67*** (0.210) 4.34*** (0.106) 3.63*** (0.362) 4.92*** (0.149) 2.95*** (0.072) 4.25*** (0.407) 2.30*** (0.359) 6.30*** (0.155) 7.04*** (0.637) 3.53*** (0.152) 3.83*** (0.093)
-2 Log Likelihood 11378 11695 10447 11660 10690