1
Faculty of Behavioural,
Management & Social Sciences
Data Gathering Method to Measure
the Effects of Resource Input of
on the Production Process
Mart Nijkamp - s1844598 July 2019
Management Summary
0.1 Introduction
Rodepa is a recycling company which turns industrial plastic waste and consumers plastic waste into high-quality regranulate and regrind. They can wash the contaminated waste and turn it into a product that can be extruded. The company has 2 modern washing lines that cleans hard plastics and foil.
They recently started with producing regrind, from both foil and hard plastics. The profit per batch can be different, due to the variability in the resource input for the washing lines. This is dependent on the quality of the resource input itself and also depend on the supplier. There is currently a method missing with which you can measure the performance of the washing line. In this research, we will solve the question: "What is the production perfor-mance of a resource input during a production run?". With this information you can calculate the costs of production and also keep track of the production line performance. This gives a handle to compare the quality of freights with each other.
0.2 Approach
In order to understand the washing line, a full description of the washing lines was made. Also a research was conducted on the quality standards of resource inputs and also on the quality checks that are performed during the production process. International quality standards and quality test were gathered to get an good insight in the waste market and understand the challenges.
Then a plan is made to measure the inputs and outputs, with the help of the washing line description.
0.3 Execution
In order to measure the performance of a freight, the following is needed:
based on subjective grading, on which you can grade the input. With this list you can compare different resource inputs with each other.
2. Measurement Plan for Washing Line: The performance of a resource input on the washing deviates. With this plan you can measure the total output and inputs of the washing line.
3. KPIs Tailored for Washing Line: The information gathered during the measurement plan, have to be processed. Tailor made KPIs for the washing line are made to process the production data.
4. Scoring: In order to compare the different freight with each other, a scoring mech-anism was made. This scoring mechmech-anism is called the Freight Score. This is the added value, better known as the profit, per ton output product per hour produced. In this score we also take notice of the downtime that a production line has, due to a failure caused by the resource input.
5. Ranking: With this score a ranking, and finally a recommendation, can be made on the supplier. In the ranking system we will regard the seasonality of a resource input, the technical innovations that a supplier has and the overall performance of the past year.
0.4 Results
0.4.1 PE/PP Caps
The Freight Score is 3.33. This is due to a good input to output ratio and a good through-put rate. This is due to the overall good score the freight got on the expected throughthrough-put, toughness and weight. And the overall good score the freight got on freshness and sand.
0.4.2 Cups
The Freight Score is -1.06. This is due to a good input to output ratio and a bad through-put rate. This is due to the overall bad score the freight got on the expected throughthrough-put, toughness and weight. And the good score the freight got on freshness and sand.
0.4.3 PP Mono Shred
0.5 Discussion and Recommendation
1. Production Line: Extruders:The same plan can be made for the extruders. This will give them a good insight in the material that the company produces.
2. Added Value: In order to get a better insight in the added value, a market analysis can be performed.
3. Time Series Analysis: A Time Series Analysis can be made if the data is registered an collected differently. With the help of technical innovations, a continuous and auto-mated time series analysis can be made.
4. Quality: In order to establish a quality standard, an analysis has to be made in order to compare freights and link them to the performance of the production line.
5. Improvements Measurement Plan:The slick production can’t be linked to a resource input, due to technical issues. The vitens water is not being measured, due to technical issues.
6. Sustainability AnalysisThe measurement plan has to be extended in order to do a sustainability analysis. It has to include the extruder lines.
Index
Management Summary ii
0.1 Introduction . . . ii
0.2 Approach . . . ii
0.3 Execution . . . ii
0.4 Results . . . iii
0.4.1 PE/PP Caps . . . iii
0.4.2 Cups . . . iii
0.4.3 PP Mono Shred . . . iii
0.5 Discussion and Recommendation . . . iv
Preface xi Definitions xii 1 Introduction 1 1.1 Introduction to Rodepa . . . 1
1.2 Problem Context . . . 1
1.3 Problem Cluster . . . 2
1.4 Core problem . . . 3
1.4.1 Motivation: . . . 3
1.5 Norm and Reality . . . 4
1.5.1 Norm . . . 4
1.5.2 Reality . . . 4
1.6 Research Goals . . . 5
1.7 Research Questions . . . 5
1.7.1 Phase 1: the Production Line . . . 5
1.7.2 Phase 2: The Purchasing Process and the Flow through the Company 6 1.7.3 Phase 3: Collect information about KPIs . . . 6
1.7.4 Phase 4: Parameters relevant to the KPI . . . 7
1.7.5 Phase 5: Scoring And Ranking . . . 8
1.8 Threats to Validity . . . 8
1.9 Reliability . . . 9
2 Production Process 10
2.1 Description Production Process HKW and FWL . . . 10
2.2 Manufacturing Process: Batch Processes . . . 10
2.3 Cell Layout . . . 11
2.4 Long Arrangement . . . 11
2.5 State of Production Line . . . 11
2.6 Blackbox Description of Production Line . . . 12
2.7 Full Production Line Description . . . 14
2.7.1 HKW . . . 15
2.7.2 FWL . . . 16
3 Quality Checks 17 3.1 Plastic Waste as Resource . . . 17
3.2 International Quality Benchmark . . . 18
3.2.1 Quality Benchmarks For Plastic Waste . . . 18
3.2.2 Quality Benchmark from Plastics Recyclers Europe . . . 18
3.2.3 Duales System Deutschland Quality Standard: Der Grüne Punkt . . . 18
3.3 Processed Plastic Waste Quality Standards . . . 20
3.3.1 REACH Certification . . . 20
3.3.2 EN ISO 15347 . . . 21
3.3.3 Transparent Foil Benchmark 98/2 - 95/5 - 90/10 - 80/20 - 50/50 . . . . 21
3.4 Process Flow . . . 22
3.5 Rodepa Quality Management . . . 23
3.5.1 Quality Check 1 for HKW, FWL & Extruders . . . 23
3.5.2 Quality Check 2 for both HKW and FWL . . . 24
3.5.3 Quality Check 3.1 for the HKW and FWL . . . 24
3.5.4 Quality Check 3.2 for FWL and HKW . . . 26
3.5.5 Quality Check 4 for the HKW . . . 27
3.5.6 Quality Check 5 for the HKW and FWL: End Product . . . 27
4 Key Performance Indicator 28 4.1 Data Registration . . . 28
4.1.1 Registration FWL . . . 28
4.2 Current KPIs . . . 30
4.3 Literature Review: Available KPIs . . . 31
4.3.1 Literature Review . . . 31
4.3.2 Maintenance KPIs . . . 32
4.4 Theorectival Perspective . . . 32
4.4.1 Process KPIs . . . 32
4.4.2 Equipment KPIs . . . 33
4.4.3 Measurement Elements . . . 33
4.5 Selecting KPIs from Literature . . . 34
4.5.1 KPIs not considered . . . 34
4.6 Outcome Systematic Literature Review . . . 34
4.7 Outcome Systematic Literature Review . . . 38
5 Measurement Plan 39 5.1 Index Of Measurement Plan . . . 39
5.2 People Actively Involved in Measurement Plan . . . 39
5.3 Preparation of Measurement Plan . . . 40
5.4 Incoming Material . . . 42
5.5 Before Measuring . . . 43
5.5.1 Installation Measurement Equipment . . . 43
5.5.2 Stand-0 . . . 44
5.5.3 Stand-0: Reset . . . 44
5.5.4 Stand-0: Registration . . . 45
5.6 Start Measurement . . . 47
5.7 During Measurement . . . 48
5.8 End Measurement . . . 48
5.8.1 Requirement for calling it the End of a production run: . . . 48
5.8.2 Final Registration . . . 49
5.8.3 Measurement Devices . . . 50
5.9 Measurement Intervals . . . 51
5.9.1 Reasoning For Intervals . . . 51
5.10 Implementation of Plan . . . 53
5.10.1 Overview Preparation Measurement . . . 53
5.10.2 Overview Before Measurement . . . 54
5.10.3 Overview During Measurement . . . 55
5.10.4 Overview After Measurement . . . 55
5.11 Possible Threats to Validity - Weight (or Angle Share) . . . 55
5.11.1 The Angle Share can be influenced by the following: . . . 55
5.11.2 Deviation in Waste Measurement (Also Influence on Angle Share) . . 56
5.11.3 Possible Threats to Validity Time . . . 57
6 Key Performance Indicators Measurement Plan 58 6.1 KPIs of Input . . . 58
6.1.1 Subjective test . . . 58
6.1.2 Scoring Scale . . . 58
6.1.3 Contamination is Loss . . . 59
6.1.4 Technical Difficulties Testing Quality . . . 59
6.1.5 Scope of KPI . . . 59
6.1.6 Threats to Useability and Viability . . . 59
6.2.1 Type of Plastic . . . 60
6.2.2 Origin . . . 60
6.2.3 Homogeneity in Material . . . 60
6.2.4 Homogeneity in Color . . . 62
6.2.5 Impact Strength or Toughness . . . 64
6.2.6 Size of Material . . . 64
6.2.7 Thickness Material . . . 65
6.2.8 Moisture . . . 65
6.3 Input Contamination Categories . . . 66
6.3.1 Overall Contamination or Freshness . . . 66
6.3.2 Metal Contamination . . . 67
6.3.3 Sand Contamination . . . 67
6.3.4 Organic Contamination . . . 68
6.3.5 Paper Contamination . . . 69
6.3.6 Other plastics . . . 70
6.3.7 Additives in Plastic . . . 71
6.3.8 For FWL only . . . 72
7 Key Performance Indicators for Washing Lines 76 7.1 List of Input Quantities . . . 77
7.2 List of Output Quantities . . . 77
7.3 Additional KPI: Maintenance - List of Failure Event - Measurement Elements 78 7.3.1 Failure Event Occurrence - Measurement Element - Quantity . . . 78
7.3.2 Name: Failure Event Time - Measurement Element - Time . . . 79
7.3.3 Failure Event Type . . . 80
7.3.4 List of Production Related Time . . . 81
7.3.5 Production Time Shredder . . . 82
7.3.6 Production Time Measurement Elements . . . 82
7.4 Process KPIs . . . 83
7.4.1 Quality KPI . . . 83
7.4.2 Energy KPIs . . . 84
7.4.3 Production KPI . . . 84
7.4.4 Throughput Related KPIs (Part of Process KPIs) . . . 84
7.4.5 Maintenance KPIs . . . 85
8 Scoring & Ranking Suppliers 86 8.1 Scoring . . . 86
8.1.1 Definition: Quality of Waste . . . 86
8.1.2 Goal . . . 86
8.1.3 Effectiveness Washing Line . . . 86
8.1.4 Added Value . . . 87
8.1.6 Quality Measure: Freight Score . . . 89
8.2 Ranking . . . 90
8.2.1 Technical Innovations . . . 91
8.2.2 Seasonality . . . 91
8.2.3 Deviation Past Deliveries . . . 91
8.2.4 Ranking System . . . 91
8.3 Quality . . . 93
8.3.1 Recommendation to Establish Quality Standard . . . 93
9 Results 94 9.1 HKW - Measurement 1: Confidential - Confidential . . . 94
9.2 HKW - Measurement 2: Confidential - Confidential . . . 94
9.3 HKW - Measurement 3: Confidential - Confidential . . . 94
9.4 Conclusion . . . 94
10 Discussion and Recommendations 96 10.1 Discussion . . . 96
10.1.1 Threat to Validity . . . 96
10.1.2 Added Value . . . 97
10.2 Relevance . . . 97
10.2.1 Scientific Relevance of this Research . . . 98
10.2.2 Company Relevance of this Research . . . 98
10.2.3 Trust Between Supplier and Recycler . . . 98
10.3 Sustainability Analysis . . . 98
10.4 Recommendations . . . 100
10.4.1 Costs Analysis . . . 100
10.4.2 Execution of Measurement Plan on Partial Freights . . . 100
10.4.3 Time Series Analysis . . . 101
Referenties 102 Appendices A Overview of Production Lines 104 A.1 Overview of all Inputs and Output incl. pictures . . . 104
A.2 Overview of Production Lines incl. Locations of Inputs . . . 104
B Problem Cluster 105 C Literature Study 107 D Quality Control Tests 120 D.1 Overview of all Quality Control Tests . . . 120
E KPIs 122
E.1 Tailor Made Production KPIs HKW and FWL . . . 122 E.2 Inventory of Company KPIs . . . 143 E.3 Inventory Supporting KPIs . . . 146
F Literature Study 147
F.1 Overview of KPIs Literature Study . . . 147
G Quality Check from the “Acceptatiebeleid versie 13.01.2015 163
H “Der Grüne Punkt” - 324 - Polypropylene 164
H.1 Waste Framework Directive . . . 165 H.2 Plastic Recyclers Europe: Bales Characterization Guidelines: HDPE Bales . 165 H.3 Plastic Recyclers Europe: Bales Characterization Guidelines: PP Films . . . 167
I Characterisation of Waste according to ISO 169
J Mail Sustainability Research 170
K Measuring Guide 173
K.1 Stroommeting voor Dummies . . . 173 K.2 Measurement Device Installing Guide . . . 173
L Costs Analysis 174
L.1 Electricity . . . 174 L.2 Water Cleaning . . . 174
M Results MP 175
Preface
This research contains the bachelor’s thesis “Data Gathering Method to Measure the Effects of a Resource Input on the Production Process” to complete my bachelor’s program in In-dustrial Engineering and Management at the University of Twente.
I want to thank Jan-Bert Jonker and Marco Kers, my company supervisors, and the man-agement of The Paauw for giving me this opportunity. I also would like to thank Richard Altemuller for helping me with this project. And I would like to thank the washing line op-erator Ashifou and George for supporting me with the execution of the measurement plan. And I would like thank Marko Kers, my father Mark Langenhof, my father Eric Rinsma, Leon Scholtens, Kevin Zieverink, Jeroen Oude Lenferink, Marcko Cherry, Nikki, Nick, Arnould, Roy Mekkelholt, Romano, Stef Kattenpoel and Stef Takkenberg, for their help.
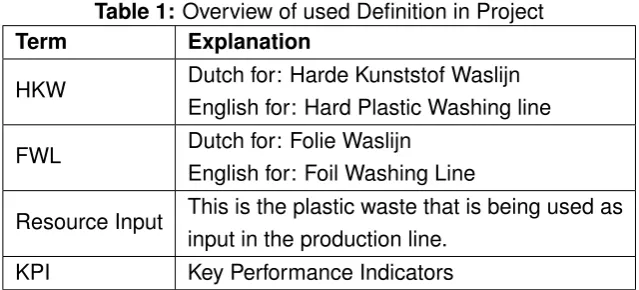
Definitions
Table 1: Overview of used Definition in Project
Term Explanation
HKW Dutch for: Harde Kunststof Waslijn
English for: Hard Plastic Washing line
FWL Dutch for: Folie Waslijn
English for: Foil Washing Line
Resource Input This is the plastic waste that is being used as input in the production line.
Chapter 1
Introduction
1.1 Introduction to Rodepa
Rodepa is a recycling company which turns industrial plastic waste and consumers plastic waste into high-quality regranulate and regrind. They can wash the contaminated waste and turn it a product that can be extruded. Rodepa produceses 30.000 MT regranulate and 10.000 regrind every year. The company has 5 modern production lines that extrude waste into product and also 2 modern washing lines that clean the contaminated plastic waste and shred it.They also advise other companies on plastic recycling. In addition to their core business, they have a logistical branch, which provides transport to and from the customers or plant. My place within this organisation is a researcher that will be unraveling the black box: the production line.
1.2 Problem Context
Rodepa has 5 extruders lines and 2 washing lines. And every single line can be seen as a black box with an input, and a certain output and waste. And because there is a big varia-tion of waste plastic, a saying they like to use is: “Waste can’t be made to order”, and each waste stream has an effect on the waste and output of a production line. One waste stream is more contaminated that the other waste stream, so it uses more water or filters have to be changed more frequently. And this is one of the many factors that can have an impact on the performance of the production line.
The black box is relatively unknown to them. They do have a lot of experience, so they can guess some effects of a waste stream on the process, but they can’t quantify them and sub-stantiate them. Currently the margins are calculated by subtracting the cost price of a waste stream and the guessed consumption of additives from the selling price. The true margins can’t be calculated.
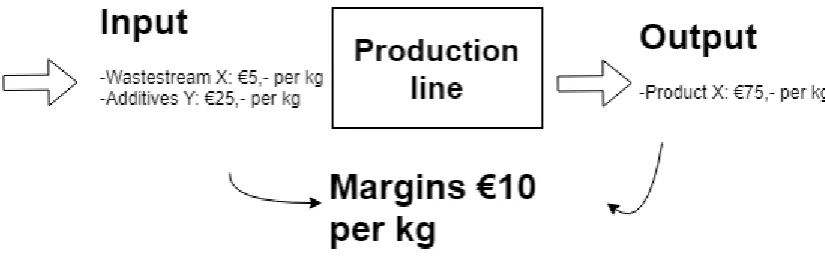
Figure 1.1: Graphical Description of Problem
give better insight in these effect and eventually the margins. So they can get an overview which waste streams they should buy and which they should avoid.
They want to know whether the margins they currently assume, are the true margins. In the example above there is a small illustration. The 10 euros profit margin per kg is what they currently assume and they want to know whether that 10 euro margin truly is the 10 euro margin or whether it is higher or lower.
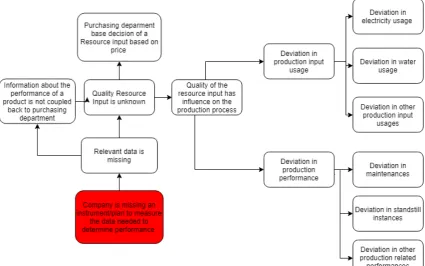
1.3 Problem Cluster
Figure 1.2:Graphical Overview of Problem Cluster
1.4 Core problem
My core problem is the following:
The company is missing an instrument/plan to measure the data needed to determine per-formance
1.4.1 Motivation:
The information related to the performance of a production line when considering to buy a certain waste stream is unknown to the organisation. They started with gathering more data on the performance of the production line, but only since a couple of month. And from in-terviews with production staff, production planners and lab staff, I can conclude that certain properties of a waste stream can have an impact on the performance of a product. The waste can contain a lot of sand, which has a big effect on the filters.
1.5 Norm and Reality
1.5.1 Norm
The precise margins are known to the organisation, because they have a measurement plan/system. The effects of a certain resource input on the production line can be sured. All parameters needed that can explain the effect significantly are known and mea-sured. With the amount of data that they have gathered with this system, they can predict with a certainty the effects of a resource stream based on a sample.
All the inputs and the outputs of a production line, according to the Black Box Design, are known to the company and can be quantified. They keep track of the total inputs and outputs relative to a resource input.
With this system they can estimate quite precisely the real production costs of a produc-tion run. For example the electricity consumpproduc-tion, the waste input and water input can be measured on the input side. The amount of silk, waste, the amount of maintenance-related operations and the amount of wear and tear can be measured on the waste side. And all of this can be traced back to the end product.
On the basis of this information, they can calculate the margins made on a freight. The information is coupled back to the purchasing department, in order to do a strategic mea-surement. The whole measurement plan can be statistically substantiated. It can be carried out within an workday and is cost-effective method. Or can be done real time via a monitor-ing system with sensors, such that a sample wise measurement is not necessary.
The information from the measurements is coupled back to the purchasing department. They can make better decisions on which waste streams to buy from which suppliers. Be-cause they know from the taken measurements and documented data on the production line performance what the influence of a waste stream is on the production line. They can also keep track of the performance of the supplier and whether they still deliver the same quality of waste.
1.5.2 Reality
The precise margins are unknown to the organisation, because they don’t have a mea-surement plan/system.
The organisation lacks the system or method to measure the effects of an resource input to a production lines. They can keep track of the electricity consumption, the waste production, water usage, slik production, maintenance over all the 7 production lines and not the individ-ual ones.
can be found in chapter 4.
The decision to buy a resource input is based on price and the material that is needed in their production process. They have criteria on which they can reject a load of resource input.
The performance of the production line is documented and they keep track of amount of end product form the production. This information is not linked to the resource input. It is known within the organisation, but not coupled back to the purchasing department. They do not keep couple this strategic information back to purchasing department.
1.6 Research Goals
This research has to give the company better insight in:
The company want better insight in the performance of a resource input on the production process. They want a plan to in order to better determine the performance of the suppliers from which they get the resource input. The quality of the resource input from a supplier varies, but this is not taken into an account when purchasing resource inputs. In the future they want to go towards strategic purchasing and they need data to start determining the performance of suppliers.
You need a system or plan to come up with the necessary parameters, in order to better calculate the true production costs and the production performance of a resource input on the production line. As mentioned earlier, waste can’t be made to order and differs in quality per supplier and the properties of the product. The company can make an better estimation then in the amount of profit they make and possibly are going to make if they use a certain resource input.
Second off, the company has a lot of assumptions about relationships between variables, but they cannot substantiate them. With a new data gathering method they can start with building a database that can substantiate those assumptions.
1.7 Research Questions
The main question of this research is:
What is the production performance of a resource input during a production run?
Production performance in this case can be subdivided into 2 parts: KPIs related to the resource input and the true costs of the production batch.
1.7.1 Phase 1: the Production Line
2. What does the production line look like?
(a) What is the process flow with the different parts? (b) What are the inputs and outputs of the different parts? (c) What states can a production line be in?
First, getting a clear overview of the process will help to understand what a resource input does in the production process of the HKW and the FWL. This will also help with determining KPIs and parameters which are relevant to my research question. To answer question 1 and 2a we will use the theory from the book Operations Management Nigel Slack, because this gives clear handles on which aspect I should implement in my process description. Ques-tion 2b will be answered with a Black Box input output design to give a schematic overview of the process. Question 2c will be answered with the production equipment state model (Benchmarking Production System, Process Energy, and Facility Energy Performance Us-ing a Systems Approach). These questions will be answered by conductUs-ing interviews on site and in a conference room with relevant production personnel and possibly with the ma-chine supplier.
1.7.2 Phase 2: The Purchasing Process and the Flow through the Company
1. What are the international quality benchmarks on foils waste and on hard plastics waste?
This will be done with a literature study. It can be found in the literature study 2.
2. How does the process flow of a Resource Input look like in the HKW and the FWL?
3. What are the quality requirements on which a decision within the process is made?
This process will be modeled according to the BPMN 2.0 (2011,OMG). This will be done , in consultation with my supervisors, with interviews of several people relevant to this process. For example the people responsible for the purchasing and for the truck load acceptance.
1.7.3 Phase 3: Collect information about KPIs
KPIs are crucial to monitor the performance of a resource input on the production process of the HKW and the FWL. This gives insight in the cost drivers of the batch and possibly even give insight in possible improvement in the production process. This also gives an insight in possible cost drivers which are useful when assessing cost of a production run.
1. What is KPIs/parameters are currently being measured?
2. What KPIs are relevant to the performance of a production line?
We have to look at the influence of a resource input on the production process, in order to determine the performance of a resource input. This can be done with Key Performance Indicator, KPIs in short. The company can grade the performance of a batch run on the basis of these KPIs and in the future predict the performance. Question 1 will be answered with a small BPMN (Business Process Model and Notation) scheme and an inventory of the current KPIs. Question 2 will be answered with looking at the theory in Operations Management and with an literature review on KPIs related to the production process. The data or parameters that are needed to calculate the KPIs will be derived from the answers of question 1 and 2 and used in phase 3.
1.7.4 Phase 4: Parameters relevant to the KPI
In the previous phase, we came up with a list of parameters that needed to be measured in order to calculate the KPIs. This phase can be divided into two parts:
1. Production related parameters: these are the parameters that are need to calculate the production process performance derived from phase 2.
2. Resource input related parameters: these are the parameters of the resource input that can have an influence on the performance of the production process or in this case can be called quality of the resource input. This can be divided further into 2 other categories:
(a) Technical properties of the input resources: e.g. tensile strength, type of plastic, size of resource input, thickness of material.
(b) Supplier related properties of the input resource: e.g. amount of contamination in a load, mixture of plastics.
How reliable and valid is the data? The research question are used to answer both part of this phase:
1. What parameters have an influence on the production process?
As mentioned in the research goal, there are assumptions about relations between pa-rameters that can’t be substantiated. The data to do this is collected and also in phase 4 start with the visualisation of the data. In order to substantiate those assumptions. This is done in interviews with the production personnel, lab personnel and also with a plastic researcher.
2. What parameters are already measured?
3. How can we measure the missing parameters?
(a) What equipment can be used to measure the parameters? (b) How reliable and valid is the data?
This is done by doing making an inventory of the current situation. For the production related parameters we look at current KPI’s and for the resource input related parameters we look at for example MFI measurements.
In this phase there will also a an choice made between a sample based measurement system and a real time measurement system of the missing parameters. This last question is part of the solution phase 4: formulating alternative solution. And the decision between these solutions will be part of phase 5: Choosing the solution. This will be done by the management.
1.7.5 Phase 5: Scoring And Ranking
In this phase, we will come up with a method to give a score to a freight and rank the suppliers. On the following question will be given an answer:
1. What is the definition of quality for the company?
2. What scoring approach can be used with the gathered data and method to qualify a resource input?
3. What are the deviations in plastic waste, that are found throughout the year?
1.8 Threats to Validity
In this part we will discuss the threats that could affect my research. This will be done with the book of Cooper and Schindler
Validity is commonly referred as (Cooper and Schindler, 2014) [1]: the extent to which we measure in a test what we want to measure. Next to that validity can be sub-categorized as internal and external validity. External validity of the research results is the possibility to generalize over multiple persons, settings and times. In the company there are multiple lines that are in certain ways very similar to each other. The way and equipment I measure my parameters can be applied to multiple production lines without many or even any alterations. Next to that the descriptions of the production line can be very much the same.
We can specify internal validity further in 3 sub-categories. The first one is content validity of instrument in which it covers the research question. In order to find all relevant parameters, I will have multiple interviews with multiple stakeholder from multiple perspective. I will have an interview with production personnel, plastics researcher and lab staff to get all the differ-ent perspectives to answer my questions. This will be sufficidiffer-ent to to answer this research question.
the outcome of a measurement device depend on multiple criterium variables. This will be discussed when it is relevant to the research, because it is very specific to the measurement device.
The third form of internal validity is concepts validity, in which we look at the extent in which a research represents the underlying concepts. The terms in which I describe the process and the input and output have to be clear. There can be a lot of confusion when we call a resource waste in the recycling industry and when we call waste waste. Plastic waste to a consumer means something different than to a plastics recycler.
1.9
Reliability
Reliability is defined as followed by Babbie: if a research we’re reproduced, to what extent would it deliver the same results? My research is mainly focussed on gathering data and developing methods to gather data. The parameters that you want to gather will mainly be the same, because some are basic and widely used parameters and KPIs. But the way the data is being gathered may differ. This is depending on the amount of money that you want to invest in a measuring plan or system to gather these data. There is some subjectivity. During the interview I want to come up with parameters that can influence the production process. This can be done with from different perspectives as discussed earlier. Different perspectives come up with different parameters, so this could be an deviations if you were to reproduce the whole research.
1.10 Constraints
Chapter 2
Production Process
This part will be used to describe both production processes, including all machines. There is also a description of all inputs and outputs of all the machines and one of the total pro-duction process. The theory used is from Bussiness Reseach Methods [1].
2.1 Description Production Process HKW and FWL
Both production lines have the same tasks. They both wash, extract waste and cut the input. The input is separated in contaminates, s.a. fine, big and heavy particles, and clean foil or regrind. In appendix A Description of the HKW and FLW - HKW you can find a more detailed description of the HKW. In Appendix A you can find a more detailed description of the FWL.
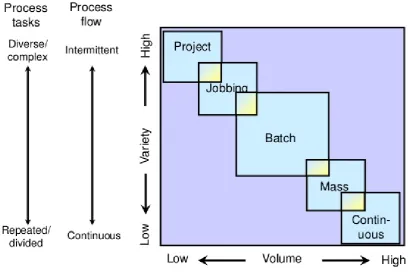
2.2 Manufacturing Process: Batch Processes
On the same production line they make different end product, because the input differs per batch. It can be that the end product is PP or HDPE.
But the production process does not differ per batch, the process tasks stay the same.This is due to the way the production line is set up. There are no options to make a bypass and skip a machine in the production line. Both lines have the function to wash and shred the resource input. So the transformation of the input is every batch the same.
The settings of the production process are different. For example, the screen sizes, the shredder settings and the additive settings differ. This depends on the resource input. The process flow is continuous throughout a batch. And only stops when resource input has been processed and an other input has to be processed. The volume of the batch varies per freight, depending on the amount of freight of the same input that arrive.
Figure 2.1:Overview: Different Types of Production Processes
2.3 Cell Layout
The input flows through the process in the order described in Appendix A: Scheme HKW and Scheme FWL. Every input is processed the same and the activities they use are the same for every input. After the input has been processed on the FWL or the HKW, they make the decision to process it further on the extruders. This process is described in the phase: A.
2.4 Long Arrangement
The stages in both the HKW and the FWL are sequential, so it is a production process in a long arrangement. The description of both lines can be seen in the Appendix A Scheme HKW. Every input has been processed by all the same machines.
2.5 State of Production Line
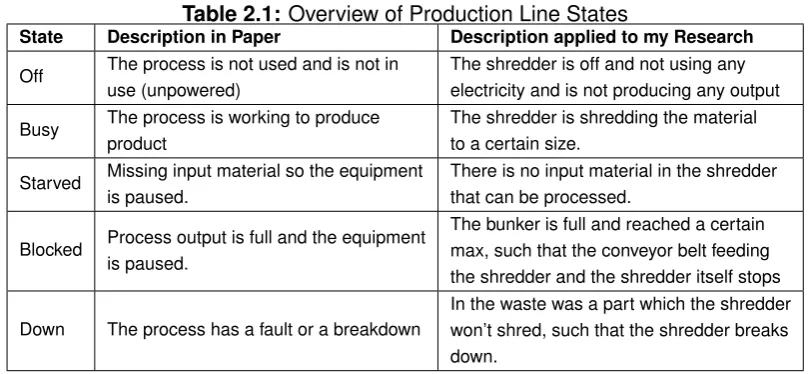
By looking at the electricity consumption of the shredder, the state of the shredder can be determined. This is also done further in the research, where I will be registering the start and end times in which the shredder has been in a certain state. According to this study there are 5 possible states which can be found in the table 2.1.
Table 2.1:Overview of Production Line States
State Description in Paper Description applied to my Research
Off The process is not used and is not in use (unpowered)
The shredder is off and not using any electricity and is not producing any output Busy The process is working to produce
product
The shredder is shredding the material to a certain size.
Starved Missing input material so the equipment is paused.
There is no input material in the shredder that can be processed.
Blocked Process output is full and the equipment is paused.
The bunker is full and reached a certain max, such that the conveyor belt feeding the shredder and the shredder itself stops Down The process has a fault or a breakdown
In the waste was a part which the shredder won’t shred, such that the shredder breaks down.
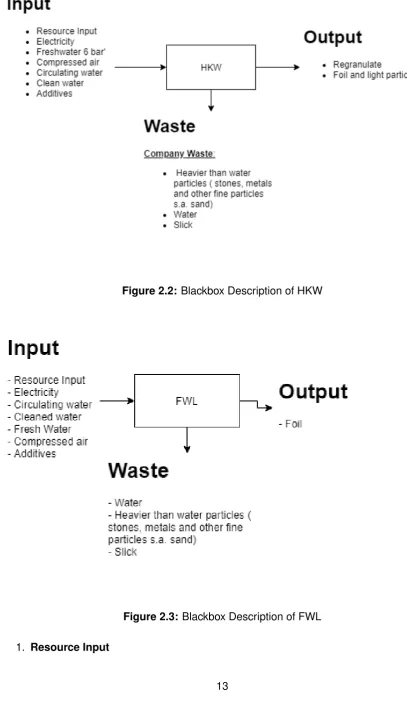
2.6 Blackbox Description of Production Line
Figure 2.2: Blackbox Description of HKW
Figure 2.3: Blackbox Description of FWL
This is the plastic “waste” that will be washed, shredded and separated from actual waste.
2. Electricity
All machines in the production line use electricity in order to operate.
3. Cleaned water
This is water that comes from a well in the company. It is groundwater, which is pumped to the surface and then cleaned inside the water cleaning unit of the company.
4. Fresh water
This is water which could be regarded as tap water. It comes straight from the water supply.
5. Circulating Water
This is water that has been circulating in the system, and is cleaned water that we regard as waste in the black box description. It has been used before in the production process as an out of one of the machines in the HKW, FWL or one of the extruders and will be cleaned and then re-used as an input in one of the machines. It is a combination of previously used Fresh water, Source water or Circulating water.
6. Compressed Air
Certain machine in the production line use pneumatic valves and other pneumatic operated parts. This won’t be considered in the measurement plan, because it is relevant for the costs calculating.
7. Additives
There are 2 or 3 additives that are used in the FWL and HKW:
(a) A binding liquid that assures that the contamination binds together. (b) Regulated the pH of the water.
(c) HKW only: makes sure that there is no foam production.
2.7 Full Production Line Description
The specification of the machines of both the HKW and the FWL are done according to this scheme. The total production line can be found in Appendix A Scheme HKW and Scheme FWL. The description of the machine in the production line is done according to this format:
Name
1. Code in scheme (and on the production monitor.)
2. Short description of task of the machines
Blackbox Description
1. Input: Output of the previous machine in line.
2.7.1 HKW
Here is a short description of the workings of the HKW.
Pre-Process
The hard plastic waste, or input, arrives in compressed bales or in bulk, delivered in the bunker by the forklift operator or directly from the truck. The bunker is used as a buffer before it is processed on the production line. Then a forklift operator places the bales or bulk directly in the shredder and it starts the process.
Production Process Stages
1. The input goes into the shredder (No Code), where is it shredded until a certain mil-limeter, such that it can pass through the sieve.
2. Then the input is transported to the Separation Tanks (1.50). Based on the float-sink principle, the plastics are separated from the heavy materials, such as stones, glass etc.
3. The input is transported to the Friction Separator (2.40). Where a screw separates the water and fine particles from the plastics.
4. Then it goes in a grinding mill, which has the same function as the shredder.
5. Again it goes through a Friction Separator (2.60).
6. Then is goes to a big Separation Tank (3.50). Which is a bigger Separation Tank, but has the same workings as the smaller one.
7. Then it goes to the Dewatering Screw (3.60). It transports the input to the Dryer and helps with the dewatering of it.
8. Then it goes to the Mechanical Dryer (4.50). Where the material is accelerated and separated from the water.
9. After that it is being sucked to the Rotating Feeding Device (5.40). It is used to separate dusts and soft shavings and fibres from the regrind.
10. Then it is being transported to the Air Separator (5.50). Here are the big and small or heavy and light particles separated from each other.
2.7.2 FWL
Here is a short description of the workings of the HKW. The machines can be linked back with their code (number 1 in D) to a machine in the schematic drawing form Appendix A Scheme FWL. Pre-Process
The foil waste, or input, arrives in compressed bales, delivered in the bunker by the forklift operator or directly from the truck. The bunker is used as a buffer before it is processed on the production line. Then a crane operator places the bales on a conveyor belt and it starts the process.
Production Process Stages
1. The input comes of the conveyor belt and goes into the granulator (1.60) which cuts the foil in smaller pieces.
2. The foil is transported towards the prewashing vat (2.50) where the foil is separated from the crude contaminates such as stones. This is done according to the float-sink principle, where the heavy particles sink and the light particles float.
3. The foil goes to a Friction Separator (3.40), which separates the foil from the water and the fines particles. Then it is cut into even smaller bits by the cutter mill.
4. The foil goes to another Friction Separator (3.60).
5. The foil goes to the a hydrocyclone (4.40). This machines is similar to the prewashing vat, because it works according to the float-sink principle. The difference is that the water containing foils is pumped in the hydrocyclone. This creates a centrifugal force which has a better separation effect of the heavy and light particles.
6. Then is goes to another Friction Separator (4.50).
7. The foil goes to the Dryer (5.50). This is a mechanical dryer that centrifuges the foil dry and then blows it dry.
8. Then it goes to a second Dryer (6.50).
Chapter 3
Quality Checks
In this phase there will be an overview of the different quality checks that are available for the plastic waste internationally and the internal quality checks at Rodepa Plastics.
3.1 Plastic Waste as Resource
Plastic waste is not your usual resource. If the demand in wood or oil increases, then the pro-duction of wood and oil adjust to meet that demand. If the market demands more recycled plastics, then it is harder to meet that demand. Because you can’t increase the production of waste. Waste is a by-product of a production process or a by-product of the consumption of goods, and not like an oil well were you increase the production to meet demand.
Also does it not come from one source and a mixture of different sources. Which may in-clude a single source, such as factory scrap or demolition scrap or a mixture of sources, like post consumer waste. Wood for example comes often comes from one source.
There can also be a lot of deviation in the content of the resource from different sources. It can differ from a single polymer type to a mixture of polymer types. And the extent in which a mixture occurs can also differ from freight to freight.
Within the company there is a saying: “Plastic Waste is not made to order”. No freight are identical. There are so many deviations that can occur in a freight which is purchased under the same name. These are deviations, that can occur for example during the production process of the waste supplier. For example, there can be a mixture of black film in a freight of white LDPE end product. This can be the case, because the supplier has a problem within the production process. And in order to make a white LDPE end product, you need a pure white LDPE input.
3.2 International Quality Benchmark
3.2.1 Quality Benchmarks For Plastic Waste
According to the technical report of the European Commission: “End-of-Waste Criteria for waste plastic for conversion” (2014) [3], there is a lot of freedom in the formulation of the quality requirements between the seller and the purchaser. This depends on 2 things, the applications for which the purchaser can use the plastic waste and which impurities from the plastic waste can be removed. So the quality standards and agreements differ from recycler to recycler. Which is also something that can be noticed at Rodepa.
For example, the recycler has a waste processing line can effectively remove paper labeling on the film, which can add a lot of value to the freight.
That there exists a lot of freedom in the quality standards, can be seen in the different quality standards used by countries throughout the EU and outside the EU. For example, Germany has “Der Grüne Punkt”, the US has the ISRI the standards- and code system and the UK has the PAS-103 specification. They have a lot of similarities but also some differences.
3.2.2 Quality Benchmark from Plastics Recyclers Europe
Rodepa is part of the Plastic Recyclers Europe. This is an organisation that promotes and protects the interest of plastic recyclers. They do not have quality standards for plastic waste or the resource input, but they do have guidelines [4] on how to characterise the waste bales input. And with these guidelines recyclers can make their own quality benchmarks or standards. You can find the Film bales characterisation in Appendix H.3 Incoming Freight Report. And you can find the bales characterisation for HDPE bales in Plastic Recyclers Europe: Bales Characterization Guidelines: HDPE Bales H.2. Both are similar to the ones described in Appendix H “Der Grüne Punkt”- 324 and they have similarities with the quality standards used at Rodepa.
3.2.3 Duales System Deutschland Quality Standard: Der Grüne Punkt
A portion of the incoming freight for the HKW is according to the quality standard of Der Grüne Punkt (DGP). This is a certificate that recycling companies can use to certificate waste, which has certain characteristics.
Packaging companies pay a fee for the use of the brand and the participation in DGP. This depends on the amount of packaging and type of packaging material used in their products. For example, Unilever pay a fixed fee for their 15 grams of a package, which they use to pack their Dove Shampoo. And they sell each 1 millions bottle every year. So they have to contribute the fee times 1 million for their shampoo bottle.
Der Grüne Punkt
The resource input that is being used as input is according to this norm. There are multiple quality standards that are under the certification of DGP. The most commonly used resource input at Rodepa is the quality 324. There are more plastic waste quality standards according to “Der Grüne Punkt”, but they won’t be discussed.
Appendix H “Der Grüne Punkt” - 324 - PP you can find an overview of the quality require-ments of this freight. In theory the amount of impurities are 6% at max. So when a 324 resource input is processed at Rodepa, there should be no more than 6% loss of the amount of input material. But the impurities are in practice much high and this number is not realistic. Depending on the supplier, they deviate around the 20% and 30%. Below you find 2 main reasons for this number.
Waste Market
According to the study “End-of-waste criteria for waste plastic for conversion” this is due to differences in specification that the EU and other continents like Asia have. The specification for plastic waste are lower and less for the Asian market, than the specification in the EU. In order to meet the higher specifications for new products in the EU, the recyclers and the collectors have more responsibility to ensure that the specifications are met. So they have a lot more customers to which they can eventually sell the plastic waste, without having to put a lot of effort in to reach a required quality specification.
Waste Management Companies
In the Netherlands, household plastic waste is separately collected and sorted. Waste man-agement companies are payed per ton of waste they collect. From this price, they have to organise the collecting, sorting and redistributing of waste. The waste management compa-nies have received their fee for collecting and sorting the waste. An effective way for them to increase their revenue is to process plastic waste faster. The more profit they make and the higher their return on investment.
To achieve this, is by turning up the processing rate of the sorting facility. This way they pro-duce more output, which they can sell. The downside to this is that an increased processing sorting rate, has a negative effect on the sorting accuracy. This has a negative effect on the quality of the end product, which is used as a resource input for the washing line. Cus-tomers of the waste management companies, such as Rodepa, have an influence on the quality of the sorted waste. This depends on the state of the market. If the customer have more choice in their supplier, because there is more available, then they can demand more from their supplier.
3.3 Processed Plastic Waste Quality Standards
The following standards and certifications are used for plastic regrind and granulated. Re-grind and granulated are the products that are created after the washing process and/or extrusion process.
3.3.1 REACH Certification
The REACH certification, short for Registration, Evaluation, Authorisation, and Restriction of Chemicals, is used to help companies by providing procedures for collecting and assessing information on the properties of hazardous substances. Under substances you find glass, rubber and other substances, but most importantly for my research is plastics.
All new or imported substances have to be registered according to the REACH standards. They have to me meet EU regulations. This process is controlled by ECHA (European Chemical Agency), which evaluates individual registrations for their compliance. They as-sess possible hazardous substances by the risk they could pose to the health of the environ-ment. Because Plastics is also a substance, it also has to apply to the REACH obligations.
End of Waste
The EU has a Waste Framework Directive [3] which regulates the so-called “End-Of-Waste”. Plastic waste ceases being waste, when the End-Of-Waste requirements are met (Appendix Waste Frame Directive) H.1. If a companies can process waste into a useful product, as is the case with certain types of plastic waste, it can be called a substance or resource. The plastic waste, that is considered waste according to the End-Of-Waste directive, can be called a resource in the future depending on the development of the recycling industry. As long as they can make a substance from it. The directive can be found in appendix H.1. If the plastic waste is passed by the Waste Framework Directive [5], then it is covered by the REACH. The recyclers, or according to ECHA’s Guidance on Waste and Recovered Substances called recovery operator, are able to benefit from this exemption under Article 2(7)(d) of REACH. They do not have to register their substance again, but they have to provide a SDS (Safety Data Sheet) with the substance that they produce.
Basis of Recycling with REACH
Recyclers can assume, according to this article [5], that the recovered plastic waste has been registered before in accordance to REACH. We can make this assumption, because all plastic waste recycled in Europe, comes from Europe or is imported. And all these plas-tics have a REACH registration, otherwise it would not have been in Europe.
In practice, it could be that a plastic crate of 30 years old contains a SVHC. At the time this article was released, it was in accordance with REACH, but ECHA later found out that a substances in the article is considered a SVHC and thus loses it REACH certification. The relevance to the quality is that every substance that has been approved and has an REACH certification, such that the contamination is contained within predetermined bound-aries. This means that the amount of contamination, or according to REACH: Substances of Very High Concern (SVHC), are within the limits, such that is can be harmful for the population of Europe.
3.3.2 EN ISO 15347
This is a general standard for plastic waste, after it has been collected and sorted: the EN ISO 15347 “Plastics - Recycled Plastic - Characterisation of plastic wastes laying out those properties for which the supplier of the waste shall make information available to the pur-chaser’ [6].
Throughout the years, various countries developed different standards such that plastic waste could be categorised accordingly. ISO takes the best of all the different standards that have been developed throughout the years and tries to make a general formulation for a batch of waste plastic.
In Appendix I Required and Optional Characteristics of plastic waste, you can find the differ-ent criteria on which you can measure the quality and how you can measure it, according to this norm. Certain criteria are required and others are optional. These depend on the agreements between the supplier and the recycler. They also provide an additional ISO norm with which you can measure that parameter.
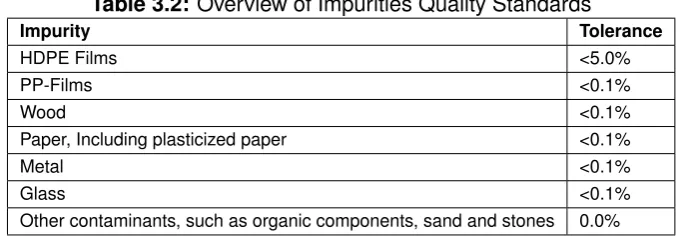
3.3.3 Transparent Foil Benchmark 98/2 - 95/5 - 90/10 - 80/20 - 50/50
For plastic foil there are 4, under recyclers known, benchmarks for transparent LDPE-film. A 98/2 quality standards, is characterized as a pure film with at least 98% of transparent LDPE-films and a maximum of 2% colored LDPE-films. The other known standards can be found in the table 3.1. And it is delivered in compressed, dry bales.
Table 3.1: Overview of Quality Standards
Quality Standards Transparent LDPE-Film Coloured LDPE-Film
98/2 >98% <2%
95/5 >95% <5%
90/10 >90% <10%
80/20 >80% <20%
50/50 >50% <50%
Table 3.2: Overview of Impurities Quality Standards
Impurity Tolerance
HDPE Films <5.0%
PP-Films <0.1%
Wood <0.1%
Paper, Including plasticized paper <0.1%
Metal <0.1%
Glass <0.1%
Other contaminants, such as organic components, sand and stones 0.0%
This is often due to the fact that the bales are still waste. Not every bale can be checked in order to measure whether it hold to these standards. There are also no objective methods to measure these impurities and there are practical difficulties to measure this, as will be mentioned later in this chapter.
There is a well known fact at the company, where this research is conducted, that every waste bale is unique and will never come back. So every bale has a different percentage of, for example, colored film or other impurities throughout a freight.
Industry Known Standard: Important Side Note
This is a well known standard in the recycling industry. This gives an indication about the quality of the bale, but it is based on a subjective test. And in order to drive up profit on a plastic bale, a supplier can grade the plastic bale for more personal gain. Thus a supplier can grade the bale as a 98/2, while in fact it is a 95/5 or worse. This standard can’t be used objectively, because there is a financial incentive to grade it differently.
Second off, it does not give a good representation of what a client, for example Rodepa, is grading the plastic bale on. The main thing they judge on are transparent LDPE-Film and coloured LDPE-Film. And do not regard the following items:
• The freshness of the material: so the appearance and the visible contamination. • The content of non-PEs in the plastic bale, for example PP foil.
• The amount of print on the foil itself, for example a shopping bag. • The amount of stickers on the bales, for example registration stickers. • The moisture content, which has an major effect on the weight.
• The thickness of the foil, which gives an indication how much contamination it
poten-tially contains.
3.4 Process Flow
3.5 Rodepa Quality Management
Common
Within Rodepa, resource inputs are specifically bought for an end product by the purchasing department. The path throughout the production process is determined upfront for a re-source input. So for example, the rere-source inputs are specific bought to go over the HKW or the FWL, which then goes to the extruder or straight to the customer. The end product can be both regranulate or regrind depending on the end product. Whether the resource input has, upon arrive, the specification that is needed to create an end-product, is still uncertain. This is not about the way that a waste stream is linked to an end product for a customer. During the process there are quality checks and on the basis of these checks, a decision is made whether it meets the standards to process it further in order to meet the quality stan-dards. See Flowscheme Appendix D.2 Flowscheme Quality Check for the path of a resource input.
Scope
The scope of the BPMN-scheme is to follow the path of the resource inputs, that are pro-cessed on the HKW and the FWL, throughout the company. The focus lies on the HKW and the FWL, but we will also take the extrusion process.
3.5.1 Quality Check 1 for HKW, FWL & Extruders
This check is meant to establish a first impression of the supplier and the quality of the re-source input. This control is for both the FWL, the HKW and extruders.
The purchaser from Rodepa goes to supplier. He gets an insight in the come about of the resource input. Then he can assess the quality and possible deviations that could come about during the delivery of the resource input.
The purchaser or supplier makes pictures of the resource input, such that he can assess the freight. He also does some subjective testing depending on the resource. The pictures are also meant as a control measurement, that when the freight arrives at Rodepa is the freight that he bought at the supplier. This is done for both regrind and plastic waste.
If the resource input is meant for the HKW or the FWL, then the subjective tests of the pur-chasers office. There are no tests for plastic waste, other than subjective tests via pictures, that can be done on the freight.
Next, the samples of a waste stream or resource input from a supplier are being delivered to the lab of Rodepa. If the resource is meant for the extruders, then the lab decides which of the following test have to be executed, based on a first optical impression and experience. This can be the case with regrind.
If the sample meets the standards that are set for a resource input, then the decision is made to regularly purchase waste from them. These standards depend on the end product in mind and the quality of the resource input.
Objective and Subjective Tests for Extruders
The subjective test are judge with an OK (good) or a NOK (not good). The objective test are judged with a value corresponding to the measurement unit. For example, the density of a product is measured in mg/cm2.
The test for the FWL depend on the type of plastic. There are 4 types of foil that are being processed on the FWL: Ziegel Foil, Shrink Wrap, Bont Foil, Natural Foil.
3.5.2 Quality Check 2 for both HKW and FWL
Not relevant to this research, because it does not contain any quality related measures. But relevant in the flow of the resource input in the process. The trucks has arrived at the company and the truck driver reports to the reception. The following are checked:
1. Is the order number present and correct?
2. Is the truck freight planned to arrive?
3. Are all documents complete and correct?
If the following conditions are met, then the truck driver can proceed to the unloading area.
3.5.3 Quality Check 3.1 for the HKW and FWL
This check is the first real quality checks where it enters the company. It is performed by the forklift operator, when the truck arrives at the unloading bay. In the following part the quality of the freight is established further. Based on these decision a freight will continue to the HKW or the FWL.
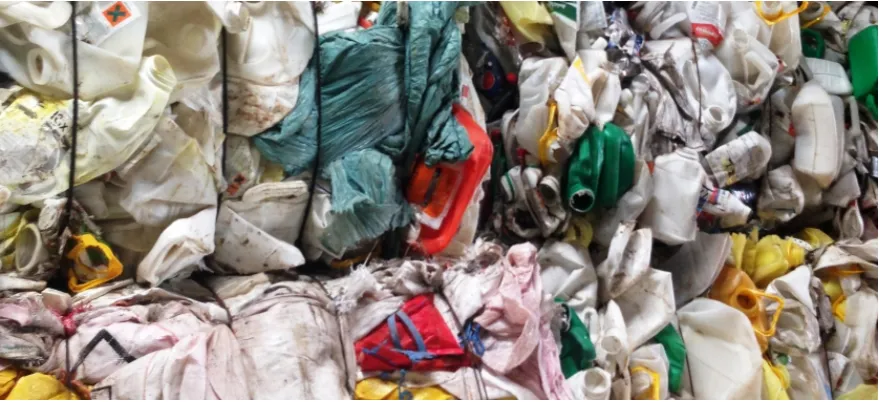
FWL
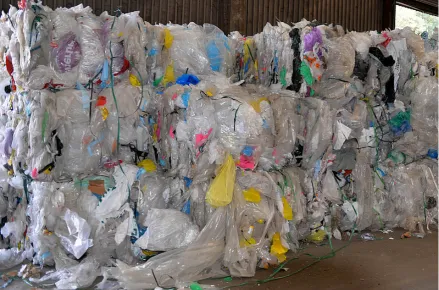
Figure 3.1: Plastic Waste Bale, that will be processed by the HKW
Assessing Freight
The difficult part with assessing a freight, is that you can not look into the bale itself. It is not possible to properly and effectively assess the freight via sampling.
The bales can look perfect on the outside, without any big contaminations, but on the inside have huge contamination. And every bale is different and unique. So the forklift operator would have to rip up the individual bales and assess them individually. Sampling can’t be done effectively with foil bales.
HKW
The freights, destined for the FWL, are assessed according to the Quality Checks 3. The test that are used to assess the freight can be found in Appendix Quality Check HKW D . The decision that is made according to these test can be found in same table . If the freight is within the quality standards, than it is being accepted and processed.
A portion of the freights are delivered in bulk and a portion are delivered in bales.
Assessing Freight
The freights for the HKW are more transparent. The freight often comes in walking floor trailers, which are meant for bulk transport. The way a walking floor is being unloaded gives a good look inside the whole content of the freights. Contaminants can be optically checked and be spotted easily. The freight can also be delivered in bales, which make it harder to assess the quality, but it is still easier to check a bale.
If the forklift operator is unsure about the quality of the freight or about a type of contamina-tion in the freight, then he calls in the help of the produccontamina-tion manager or the lab.
regarded as company waste and processed by another company via the De Paauw Recy-cling or an external company.
3.5.4 Quality Check 3.2 for FWL and HKW
After the forklift operator has approved the freight, it proceeds to the bunker or to the storage area. This is depending on the production planning.
The quality check is performed by the production manager of the Washing Lines. He is re-sponsible for both the HKW and the FWL. And does the final quality check before they are processed. The checks that are performed are mostly optical and similar to those performed by the forklift operators. The checks can be found in Appendix HKW D Quality Checks and FWL Quality Checks D. Because the load in the bunker is more transparent, he can better evaluate these loads. This is especially true for the unloading of a walking floor.
Refused Freights
Whether a freight is refused or not, depends very much on the agreements the supplier and Rodepa have made upfront about the freight. So extent of the freights shortcomings are dependent on the agreements.
Figure 3.2: Plastic Waste Bale, that will be processed by the FWL
3.5.5 Quality Check 4 for the HKW
These checks are performed, after it has been processed on the HKW and before it goes over the extruder or to the customer. This is where the product of the HKW and the product of the FWL differ from each other. The output of the HKW can be sold as an end product, while the output of the FWL is processed on the extruder before it is sold.
So in the Flow Scheme you can find Quality Check 4, but this check is skipped for the FWL due to technical difficulties.
The checks that are performed are similar to those in Quality Check 5.
3.5.6 Quality Check 5 for the HKW and FWL: End Product
Chapter 4
Key Performance Indicator
In this part of the research we will discuss the KPIs used at Rodepa to monitor their process. And we will also discuss KPIs that can be used for the processing industry. The definition of KPI is Key Performance Indicator.
4.1 Data Registration
The data is currently being registered per shift by the employee responsible for storing the pallets and the team leader. Both the washing lines have separate reports in which they register production related data. The use of these sheets are to monitor the shift and not to monitor the resource.
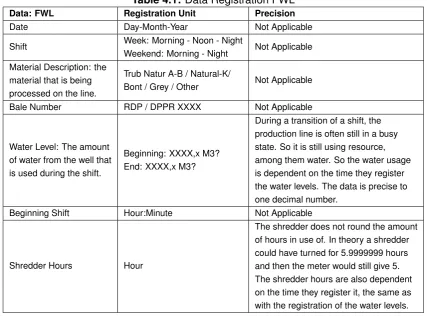
4.1.1 Registration FWL
At the beginning of the shift they register the Date, the Shift they are in, Water level, Shredder Hours. They also register the name of the operator responsible for the document including a signature, and the signature of the operator responsible for the document previous to their shift. This is
Table 4.1:Data Registration FWL
Data: FWL Registration Unit Precision
Date Day-Month-Year Not Applicable
Shift Week: Morning - Noon - Night
Weekend: Morning - Night Not Applicable Material Description: the
material that is being processed on the line.
Trub Natur A-B / Natural-K/
Bont / Grey / Other Not Applicable
Bale Number RDP / DPPR XXXX Not Applicable
Water Level: The amount of water from the well that is used during the shift.
Beginning: XXXX,x M3? End: XXXX,x M3?
During a transition of a shift, the production line is often still in a busy state. So it is still using resource, among them water. So the water usage is dependent on the time they register the water levels. The data is precise to one decimal number.
Beginning Shift Hour:Minute Not Applicable
Shredder Hours Hour
The shredder does not round the amount of hours in use of. In theory a shredder could have turned for 5.9999999 hours and then the meter would still give 5. The shredder hours are also dependent on the time they register it, the same as with the registration of the water levels.
Registration HKW
The registration happens on the same way as described in the3.1.1 Registration FWL. The relevant data can be found in table 4.2.
Table 4.2: Data Registration HKW
Data: HKW Registration Unit Precision
Date Day-Month-Year Not Applicable
Shift
Week: Morning -Noon - Night Weekend: Morning - Night
Not Applicable
Material Description: the material that is being processed on the line.
Sticker places on all the bales of the freight during the unloading process.
Not Applicable
Water Level: The amount of water from the well that is used during the shift.
Beginning: XXM3? End: XXX M3?
During a transition of a shift, the production line is often still in a busy state. So it is still using resource, among them water. So the water usage is dependent on the time they register the water levels.
Beginning Shift Hour:Minute Not Applicable
Shredder Hours Hour
The shredder does not round the amount of hours in use of. In theory a shredder could have turned for 5.9999999
hours and then the meter would still give 5. The shredder hours are also dependent on the time they register it, the same as with the registration of the water
levels.
Solid Waste Weight XXXX KG Precise till zero decimals Solid Waste Bin Size Bins with a weight of
430 or 630 Kg
Precise till zero decimals Foil Separator Big Bags XXX KG Precise till zero
decimals
Output: Time Hour:Minute Depending on the persons registering the output, the precision can be 1/5/10 minutes. Output : Material
Description
Same as material
description above Not Applicable Output: Kg
End product in 1 Big Bags XXX kg
Precise till zero decimals
4.2 Current KPIs
After someone has collected the data registration papers, they are being processed and put in an Excel Data Registration Sheet.
and washing lines in one week over a whole year are shown in a chart. A more elaborate list can be found in the Appendix Inventory Current KPIs E.
Table 4.3:KPIs that are currently used by Rodepa
KPI according to Theoretical Framework Parameters rocess KPIs
Quality
Waste (per hour), Foil Waste, Slick/Sand Waste, Water Usage (per hour), End Product,
Recovery Percentage KPIs Measurement Elements
Time Shredder Hours
Quantity Water, Waste, Foil Waste, Slick/Sand, End Product Equipment KPIs Shredder Usage
Disclaimer Sand/Slick
The HKW and the FWL both produce sand and slib waste. The sand and slib from the HKW goes over the water filtration system of the FWL before it is deployed in a waste bin.
4.3 Literature Review: Available KPIs
Rodepa is a production company, which turns a waste stream into a resource. The scope will be on both the HKW and the FWL. And the company wants to know what a production batch actually costs to run on those lines. And this will be done with a measuring plan in which want to take into account not only financial aspects of the production process, but also the performance aspects. This can help with explaining why the production run of almost identical material deviates in yield and costs.
4.3.1 Literature Review
4.3.2 Maintenance KPIs
Additions to these KPIs are maintenance KPIs. The production line has periodic mainte-nance elements, such as filter change and cutter blade change, that are changed after or during a batch run. KPIs related to maintenance will come from the article: “A Hierarchical structure of key performance indicators for operation management and continuous improve-ment in production systems”. [8]
4.4 Theorectival Perspective
The first step is to establish a point-of-view or a theoretical perspective in order to categorize the KPIs, that will be used to describe the performance of the production line. The frame-work can be found in Appendix Literature Review F with KPIs that are categorised with this framework in mind. It also contains KPIs and measurement elements from other studies. There are 2 perspectives in which KPIs are defined, namely Equipment KPIs and Process KPIs. And these perspectives can be categorized further, which will be explained further in the report. The measurement elements are used for the calculating of the KPIs. In the table 4.4 below you can find the categorisation that is subtracted from the literature.
Table 4.4:KPIs according to the Theoretical Perspective
Process KPIs Measurement Elements Equipment KPIs Addition Production Quality Energy Time Quantity Allocation/Utilisation Maintenance
KPI Scope
The scope of this research will only be on the HKW and FWL production lines, so we won’t be considering KPIs related to logistics or personnel.
4.4.1 Process KPIs
These KPI are about the total performance of the production line. These KPIs are most rele-vant for my research, because my goal is to calculate the performance of the total production line. The process KPIs can be further specified into 3 further categories:
• Production
about due to an impurity that can be fatal to a part in the machine. Further details will be discussed in the maintenance KPI part.
• Quality
Quality KPIs are related to the quality of the end product and the output of the input product.
• Energy
Energy KPIs are related to the amount of electricity that is used to produce the end product. In this research it will be defined differently. It will be defined as all the inputs, or energy, that goes into the process to come about the output. These KPIs are for a sustainability analysis and financial calculation very useful.
4.4.2 Equipment KPIs
The production line of Rodepa can be seen as one machine or equipment in this case. Because it is a continuous flow production process. The whole production, the HKW and the FWL, are harmonised and the shredder stops if the washing line is too full.
So these KPIs are not as relevant for this project and are similar to the Process KPIs. The equipment KPIs are mostly about efficiency, capability and utilisation of a machine, instead of looking at the whole production process. The equipment KPIs, described in the research, will also be considered as Process KPIs.
The equipment KPIs are more focused towards a specific machine in the production line. Due to technical difficulties, complexity of the production line and time constraints I won’t be taking the specific machines of the production line into account.
4.4.3 Measurement Elements