July 2019
Reducing the throughput time of the
bearing support
By improving planning and control
Bachelor Thesis
Industrial Engineering and Management
J.J. Rensen
s1842013
i
Document
Title: Reducing the throughput time of the bearing support Date: July 2019
City: Enschede
Author
Jesper Jens Rensen (s1842013)
Bachelor Industrial Engineering and Management
PM-Aerotec
External Supervisor
Topaasstraat 24 D. Bakhuis (Dennis)
7554 TH Hengelo Director PM-Aerotec & PM-Precision
The Netherlands
Phone: ( +31) 74-243 42 34 Fax: (+31) 74-243 31 21
www.pmaerotec.com [email protected]
University of Twente
First supervisor
Drienerlolaan 5
I. Seyran Topan (Ipek)
7522 NB Enschede Faculty of Behavioral Management and
The Netherlands Social Sciences
Phone: 053 489 9111
Second supervisor
Dr. E. Topan (Engin)
iii
Preface
This report is the result of a bachelor thesis that I have executed for my bachelor Industrial
Engineering and Management at the University of Twente. I conducted my thesis at PM Aerotec, in Hengelo. The main goal of this thesis to reduce the total throughput time for the bearing support product, processed by PM-Aerotec.
First, I would like to thank my colleagues at PM-Aerotec (PMA). So many people have helped me during the execution of my thesis. From shop-floor workers to people in the business office, everyone was helpful. Naming all of them would result in a very long list of names. Moreover, I do not want to risk the chance of missing a name. Though, I want to specifically thank two people. The first person is Dennis Bakhuis, the director of PMA, for giving me the opportunity to do the thesis at PMA. Moreover, his personal guidance and opinions helped me a lot to acquire a proper
understanding of the problem situation and wishes of PMA. Even though he was very busy, he always found a gap in his agenda to help me out. The second person I want to thank is Marcel Mekkering, the former bearing support project supervisor, for his help during my thesis. He knew so much about the bearing support such that I could ask him anything. In addition, he really thought along with me and always took a lot of time to discuss things with me.
Second, I want to thank Ipek Seyran Topan, my supervisor from the University of Twente, for all her help. Not only during this thesis but already during the preparation of this thesis. Her critical opinion and useful feedback definitely helped me progress. Without her feedback, this thesis would not have become what it currently is. I could always e-mail her with questions, which she consequently replied. This is special since I know that she is very busy. Furthermore, her guidance goes beyond study-related things since she also helped me improve on a personal level. I also want to thank Engin Topan for being my second supervisor for this thesis.
Lastly, I want to thank my girlfriend Carlijn, my parents Gerard and Rita, my brother Quinten, and his girlfriend Britt for their unconditional support during my bachelor study. In addition, I want to thank my (study) friends for their support. Naming all of them would, again, result in a long list of names, where I do not want to risk missing some names.
iv
Management summary
Introduction
PM-Aerotec (PMA) is a supplier of high-precision parts and mechatronic integrated modules for the aerospace industry, aeronautical space programs, military programs, and maritime projects. One of their projects is processing bearing supports for customer X. The bearing support is a titanium aircraft engine component to which the main shaft of the aircraft engine is mounted. The bearing support project has been in an introductory phase for PMA but, currently, it is time to improve the efficiency of the production. That is why this thesis is needed. The action problem, presented by PMA was: How can the throughput time of the bearing support be minimized from nine weeks to a
maximum of four weeks?
It was believed that considerable time gains could be acquired by improving the current planning approach that is in place. Therefore, the research question of this thesis became: How should a production planning approach be applied at PMA such that the relevant characteristics and restrictions of the production are satisfied to reduce throughput time?
The problem approach
In order to answer this question, the following things were done during the execution of this thesis: - Identifying the main characteristics of the production process: the production route, the
current planning, the process times of departments, the capacity, the demand, the transport-day(s), costs, and potential bottlenecks.
- Doing a literature study to identify planning and control approaches. By doing a literature study, the main characteristics of planning and control were investigated, together with outlining multiple planning and control approaches.
- Selecting three planning and control approaches for PMA. By assessing literature, it was determined that MRP, ConWIP, and bottleneck control were the best options for PMA. The steps and functioning of the three approaches were also outlined.
- Doing a simulation study in order to test the effects of the three different planning and control approaches. In addition, other interventions like transport-days, delivery variability, and adding extra machines were tested.
- Combining the best results of all simulation experiments in one simulation model in order to determine what is needed to reduce the throughput time to a maximum of four weeks. Main results based on the simulation model
Within the simulation model, multiple things have been experimented. First, the three planning and control approaches were compared to the base model. It turned out that bottleneck control on the grinding machine was outperforming bottleneck control on the turning and milling machine and outsourcing. MRP, ConWIP, and bottleneck control outperformed the base model, mainly because of a reduction in waiting time. MRP and bottleneck control outperformed ConWIP, whereas between MRP and bottleneck control no significant difference in performance was observed.
Second, delivery variability was tested within the simulation model. Decreasing or eliminating delivery variability significantly reduces total throughput time by approximately 2 to 3 days (little variability) and perhaps 3 to 6 days (a lot of variability). Furthermore, negotiating a fixed number is more effective than negotiating a fixed interval.
v transport-day. Driving twice to the outsourcing company MPP can significantly reduce throughput time by approximately 8 days (in the base model) and 8 to 9 days (in an MRP-model).
Fourth, adding an extra turning and milling machine would not reduce total throughput time and only increase costs, whereas adding an extra grinding machine would reduce total throughput time while also reducing costs.
Lastly, a different day for the delivery of new bearing supports and acquiring of finished bearing supports by customer X can improve total throughput time by approximately 4 days (based on the MRP-model). Furthermore, driving twice to customer X can significantly reduce the throughput time by approximately 7 days (based on the MRP-model).
By eventually combining all best results into one model, the things could be outlined that are needed to reduce the throughput time to four weeks. A throughput time excluding the delivery to the customer of less than four weeks can be acquired by using an MRP planning and control approach, buying an extra grinding machine, and driving twice to the outsourcing company MPP. A throughput time including the delivery to the customer of less than four weeks can be acquired by doing the same but also driving two times to customer X. For this, at least 9 full-time employees (FTE’s) are
needed to eventually do at least 4,82 FTE work, excluding the turning and milling machine. The turning and milling machine needs a 24-hour shift, 6 days per week (of which 8 hours per day are automated). This could be done with 2 to 3 operators.
Recommendations
Based on the problem approach and main results, I recommend PMA to do the following things in order to reduce the throughput time of the bearing support:
- Use MRP or bottleneck control (on the grinding machine) as planning and control approach. MRP would be more interesting if sufficient capacity is present since it is a familiar approach for PMA. In addition, it is simpler to introduce than bottleneck control. Though, I would also recommend to using an extra capacity analysis system to check if the scheduled numbers in the MRP are still suitable. Bottleneck control would be more interesting if capacity is more constrained than assumed in this thesis.
- Try to negotiate a fixed delivery interval with fixed delivery numbers since it reduces variability and thus waiting times. If this is not possible, reducing variability already reduces throughput time significantly. Furthermore, negotiating a fixed number is more effective than negotiating a fixed interval.
- Try to find the right alignment between the transport day to MPP and the delivery and acquiring day. This is important since it can massively influence the total throughput time. For some combinations, this thesis provides the optimal values which can be used.
Determining the transport day to MPP changes total throughput time significantly. Transporting to MPP twice can improve the throughput time even more but comes with a cost. Setting the day on which new castings come in and finished bearing supports are acquired by customer X, can also considerably reduce the throughput time. In addition, driving two times to customer X reduces the throughput time even further, but probably also comes with a cost. Driving three times to customer X is not interesting.
- Add an extra grinding machine. This is cheaper than running longer shifts in order to cope with the specified demand. The shift hours can be limited enough in order to save costs such that a second grinding machine is lucrative.
vi
Contents
PREFACE __________________________________________________________________________________ III
MANAGEMENT SUMMARY __________________________________________________________________ IV
READER’S GUIDE ___________________________________________________________________________ XII
DEFINITIONS _____________________________________________________________________________ XIII
CHAPTER 1: INTRODUCTION __________________________________________________________________ 1
1.1ABOUT PM-AEROTEC AND THE BEARING SUPPORT___________________________________________________ 1
1.2PROBLEM CONTEXT ________________________________________________________________________ 1
1.3CHOOSING THE CORE-PROBLEM AND RESEARCH QUESTION _____________________________________________ 4
1.4THEORETICAL PERSPECTIVE AND SCOPE ___________________________________________________________ 6
1.5SUB-QUESTIONS __________________________________________________________________________ 7
1.6PROBLEM APPROACH AND OBJECTIVE ___________________________________________________________ 11
1.7DELIVERABLES __________________________________________________________________________ 13
1.8SUMMARY AND CONCLUSIONS FOR CHAPTER 1 ____________________________________________________ 13
CHAPTER 2: CHARACTERISTICS OF THE PRODUCTION OF THE BEARING SUPPORT ______________________ 14
2.1PRODUCTION STEPS OF THE BEARING SUPPORT ____________________________________________________ 14
2.2THE CURRENT PLANNING ALGORITHM __________________________________________________________ 16
2.3THROUGHPUT TIMES ______________________________________________________________________ 17
2.4OTHER PRODUCTION CHARACTERISTICS _________________________________________________________ 20
2.5CAPACITY ANALYSIS _______________________________________________________________________ 21
2.6BOTTLENECKS IN THE PRODUCTION ____________________________________________________________ 23
2.7SUMMARY AND CONCLUSIONS FOR CHAPTER 2 ____________________________________________________ 24
CHAPTER 3: PRODUCTION PLANNING AND CONTROL AND SIMULATION STUDY (LITERATURE STUDY) _____ 25
3.1PRODUCTION PLANNING AND CONTROL _________________________________________________________ 25
3.2A SIMULATION STUDY _____________________________________________________________________ 38
CHAPTER 4: PLANNING AND CONTROL METHOD SELECTION FOR PMA _______________________________ 45
4.1ASSESSING AND SELECTING PRODUCTION PLANNING AND CONTROL APPROACHES _____________________________ 45
4.2PLANNING AND CONTROL PERSPECTIVES IN LITERATURE_______________________________________________ 47
4.3COMPARING THE PLANNING AND CONTROL PERSPECTIVES _____________________________________________ 51
4.4THE PLANNING APPROACHES FOR PMA _________________________________________________________ 51
4.5SUMMARY AND CONCLUSIONS FOR CHAPTER 4 ____________________________________________________ 52
CHAPTER 5: THE SIMULATION MODEL _________________________________________________________ 53
5.1THE CONCEPTUAL MODEL___________________________________________________________________ 53
5.2IMPLEMENTATION, VERIFICATION, AND VALIDATION OF THE SIMULATION MODEL _____________________________ 58
5.3SUMMARY AND CONCLUSIONS FOR CHAPTER 5 ____________________________________________________ 63
CHAPTER 6: EXPERIMENTS WITH THE SIMULATION MODEL ________________________________________ 64
6.1OBTAINING ACCURATE EXPERIMENTAL RESULTS ____________________________________________________ 64
6.2THE PLANNING APPROACH EXPERIMENTS ________________________________________________________ 65
6.3OTHER PLANNING AND CONTROL EXPERIMENTS AND THE COSTS ANALYSIS __________________________________ 73
6.4DETERMINING THE REQUIRED CAPACITY _________________________________________________________ 93
6.5SUMMARY TABLE FOR ALL EXPERIMENTS _________________________________________________________ 97
CHAPTER 7: CONCLUSIONS, RECOMMENDATIONS, AND DISCUSSION _______________________________ 100
7.1 CONCLUSIONS _________________________________________________________________________ 100
vii
7.3FURTHER RESEARCH AND SHORTCOMINGS IN THIS RESEARCH __________________________________________ 102
7.4CONTRIBUTION TO PRACTICE OF THIS THESIS _____________________________________________________ 103
REFERENCES ______________________________________________________________________________ 105
APPENDIX A: PROBLEM IDENTIFICATION AND PLANNING FOR THIS THESIS __________________________ 108
APPENDIX B: THE PRODUCTION OF THE BEARING SUPPORT ______________________________________ 111
APPENDIX C: THROUGHPUT TIMES ___________________________________________________________ 121
APPENDIX D: CONTENTS OF THE SIMULATION MODEL ___________________________________________ 138
APPENDIX E: EXPERIMENTAL SET-UP _________________________________________________________ 142
viii
List of figures
FIGURE 1:THE BEARING SUPPORT. ... 1
FIGURE 2:PROBLEM CLUSTER OF THE PRODUCTION OF THE BEARING SUPPORT. ... 2
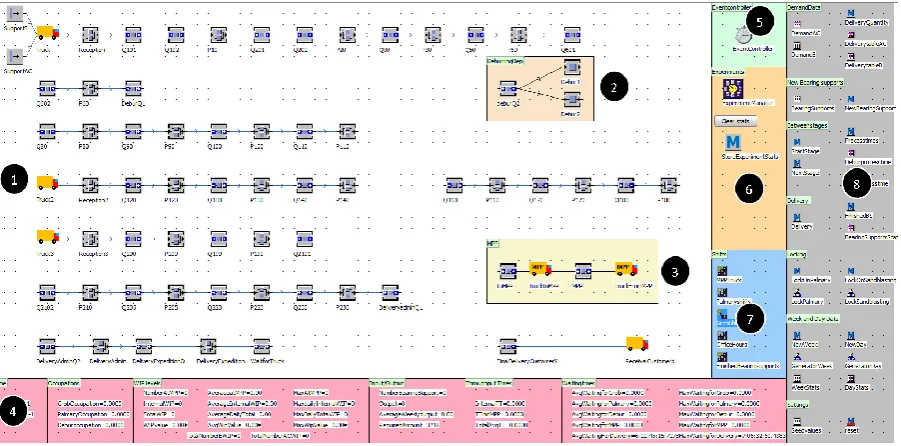
FIGURE 3:SCREENSHOT OF THE SIMULATION MODEL. ... 59
FIGURE 4:CONFIDENCE INTERVALS FOR THE AVERAGE TOTAL THROUGHPUT TIME, FOR THE PLANNING APPROACH EXPERIMENTS. ... 69
FIGURE 5:CONFIDENCE INTERVALS FOR THE AVERAGE TOTAL THROUGHPUT TIME, FOR THE VARIABILITY EXPERIMENTS (BASE MODEL ONLY). ... 74
FIGURE 6:CONFIDENCE INTERVALS FOR THE AVERAGE TOTAL WIP, FOR THE VARIABILITY EXPERIMENTS (BASE MODEL ONLY). ... 74
FIGURE 7:CONFIDENCE INTERVALS FOR THE AVERAGE TOTAL THROUGHPUT TIME, FOR DIFFERENT TRANSPORT DAYS (BASE MODEL). . 78
FIGURE 8:CONFIDENCE INTERVALS FOR THE AVERAGE TOTAL THROUGHPUT TIME, FOR DIFFERENT TRANSPORT DAYS (MRP-MODEL). 78 FIGURE 9:CONFIDENCE INTERVALS FOR THE AVERAGE TOTAL THROUGHPUT TIME, FOR COMBINATIONS OF TRANSPORT DAYS (BASE MODEL). ... 79
FIGURE 10:CONFIDENCE INTERVALS FOR THE AVERAGE TOTAL THROUGHPUT TIME, FOR COMBINATIONS OF TRANSPORT DAYS (MRP-MODEL). ... 80
FIGURE 11:CONFIDENCE INTERVALS FOR THE AVERAGE TOTAL THROUGHPUT TIME FOR THE MODELS OF THE FOUR DIFFERENT SCENARIOS FOR ADDING AN EXTRA GROB (BASE MODEL). ... 83
FIGURE 12:CONFIDENCE INTERVALS FOR THE AVERAGE TOTAL THROUGHPUT TIME FOR THE MODELS OF THE FOUR DIFFERENT SCENARIOS FOR ADDING AN EXTRA GROB (MRP-MODEL). ... 85
FIGURE 13:CONFIDENCE INTERVALS FOR THE AVERAGE TOTAL THROUGHPUT TIME FOR THE MODELS OF THE FOUR DIFFERENT SCENARIOS FOR ADDING AN EXTRA PALMARY (BASE MODEL). ... 87
FIGURE 14:CONFIDENCE INTERVALS FOR THE AVERAGE TOTAL THROUGHPUT TIME FOR THE MODELS OF THE FOUR DIFFERENT SCENARIOS FOR ADDING AN EXTRA PALMARY (MRP-MODEL). ... 89
FIGURE 15:CONFIDENCE INTERVALS OF THE AVERAGE TOTAL THROUGHPUT TIME FOR A DIFFERENT DELIVERY AND ACQUIRING DAY (MRP-MODEL). ... 91
FIGURE 16:CONFIDENCE INTERVALS OF THE AVERAGE TOTAL THROUGHPUT TIME FOR A COMBINATION OF DIFFERENT DELIVERY AND ACQUIRING DAYS (MRP-MODEL)... 92
FIGURE 17:GANTT CHART OF THE INTENDED PLANNING AT THE START OF THIS THESIS. ... 109
FIGURE 18:GANTT CHART OF THE REALIZED PLANNING AT THE END OF THIS THESIS. ... 109
FIGURE 17:BEARING SUPPORT PRODUCTION PROCESS MAP. ... 111
FIGURE 18:THE CURRENT BEARING SUPPORT PRODUCTION PLANNING. ... 120
FIGURE 21:FIGURES FOR THE TT FROM THE ERP-SYSTEM OF P70. ... 121
FIGURE 22:QQ-PLOT AND A PLOT OF THE EMPIRICAL DATA AGAINST THE HYPOTHESIZED DISTRIBUTION (P70). ... 122
FIGURE 23:FIGURES FOR THE TT FROM THE ERP-SYSTEM OF P80. ... 123
FIGURE 24:QQ-PLOT AND A PLOT OF THE EMPIRICAL DATA AGAINST THE HYPOTHESIZED DISTRIBUTION (P80). ... 124
FIGURE 25:FIGURES FOR THE TT FROM THE ERP-SYSTEM OF P90. ... 125
FIGURE 26:QQ PLOTS FOR P90. ... 126
FIGURE 25:HISTOGRAM FOR THE ERP-DATA FROM P90 WITHOUT OUTLIERS. ... 126
FIGURE 28:FIGURES FOR THE TT FROM THE ERP-SYSTEM OF P130. ... 127
FIGURE 29:QQ PLOTS FOR P130. ... 127
FIGURE 30:A PLOT OF THE EMPIRICAL DATA AGAINST THE HYPOTHESIZED DISTRIBUTION (P130). ... 128
FIGURE 31:FIGURES FOR THE TT FROM THE ERP-SYSTEM OF P140. ... 129
FIGURE 32:QQ PLOTS OF ERP-DATA FROM P140. ... 129
FIGURE 33:PLOTS OF THE EMPIRICAL DATA AGAINST THE HYPOTHESIZED DISTRIBUTIONS (P140). ... 130
FIGURE 34:ADDITIONAL QQ PLOTS FOR P140. ... 131
FIGURE 35:FIGURES FOR THE TT FROM THE ERP-SYSTEM OF P150. ... 131
FIGURE 36:QQ PLOTS FOR P150. ... 132
FIGURE 35:AN OVERVIEW OF THE MAIN FRAME OF THE SIMULATION MODEL. ... 138
FIGURE 36:AN EXAMPLE OF A DATA-TABLE WITHIN THE SIMULATION MODEL. ... 138
FIGURE 37:EXAMPLE OF SOME CODE WITHIN THE SIMULATION MODEL. ... 139
FIGURE 38:FLOW CHART OF HOW THE DEBURRING DEPARTMENT IS PROGRAMMED. ... 139
FIGURE 39:FLOW CHART OF HOW OUTSOURCING TO MPP IS PROGRAMMED. ... 139
ix
FIGURE 41:FLOW CHART OF HOW THE GROB MACHINE IS PROGRAMMED. ... 140
FIGURE 42:FLOW CHART OF HOW WAITING TIMES ARE CALCULATED. ... 141
FIGURE 43:FLOW CHART OF THE DIFFERENT PLANNING APPROACHES. ... 141
FIGURE 44:GRAPH FOR DETERMINING THE WARM-UP PERIOD. ... 142
FIGURE 45:GRAPH FOR DETERMINING THE RUN-LENGTH (ZOOMED-IN VERSION). ... 142
FIGURE 46:GRAPH FOR DETERMINING THE RUN-LENGTH (ZOOMED-OUT VERSION). ... 143
FIGURE 47:THE EXPERIMENT MANAGER. ... 143
FIGURE 48:DETERMINING KPI'S FOR EXPERIMENTATION. ... 143
FIGURE 49:POP-UP AFTER EXPERIMENTATION. ... 144
FIGURE 50:THE TOP OF THE SIMULATION REPORT, CREATED BY THE PROGRAM. ... 144
FIGURE 51:CONFIDENCE INTERVAL WITHIN THE REPORT OF THE SIMULATION EXPERIMENT. ... 144
FIGURE 52:TABLES WITHIN THE REPORT OF THE SIMULATION EXPERIMENT. ... 144
FIGURE 53:SUMMARIZED RESULTS AFTER AN EXPERIMENT. ... 145
FIGURE 54:DETAILED RESULTS AFTER AN EXPERIMENT. ... 145
x
List of tables
TABLE 1:DETERMINED THROUGHPUT TIMES FOR EACH DEPARTMENT. __________________________________________ 19
TABLE 2:THE DEMAND FOR BEARING SUPPORTS. ________________________________________________________ 20
TABLE 3:BASE NUMBERS FOR THE CAPACITY ANALYSIS. ____________________________________________________ 22
TABLE 4:CAPACITY DECISION FOR CAPACITY-CONSTRAINED DEPARTMENTS. ______________________________________ 23
TABLE 5:FAMILIAR PRIORITY RULES IN LITERATURE. ______________________________________________________ 28
TABLE 6:SUMMARIZING THE MAIN PLANNING AND CONTROL APPROACHES WITHIN THIS THESIS. ________________________ 37
TABLE 7:DIFFERENT SIMULATION TYPES. _____________________________________________________________ 39
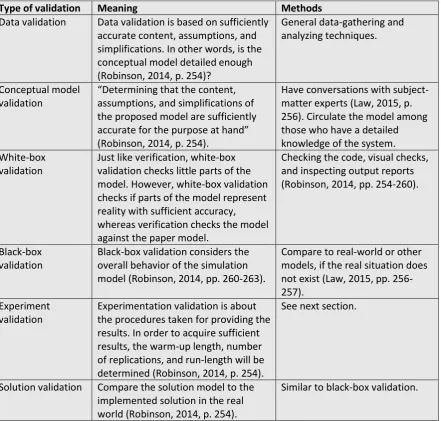
TABLE 8:DIFFERENT VALIDATION APPROACHES. _________________________________________________________ 40
TABLE 9:ANALYSIS OF RESULTS FROM THE PAIRWISE-T APPROACH OR THE CONFIDENCE INTERVAL FOR THE DIFFERENCE BETWEEN TWO
MEANS METHOD. _________________________________________________________________________ 44
TABLE 10:THE CHOSEN KPI'S AND THEIR WEIGHTS FOR PMA. ______________________________________________ 46
TABLE 11:THE ASSIGNED SCORES AND EVENTUAL SCORES FOR THE POTENTIAL PLANNING APPROACHES FOR PMA. ___________ 51
TABLE 12:THE EXPERIMENTAL SET-UP FOR ALL EXPERIMENTS. _______________________________________________ 65
TABLE 13:VALUES OF MAIN KPI'S FOR THE BASE MODEL. __________________________________________________ 66
TABLE 14:PAIRED-T APPROACH FOR BOTTLENECK CONTROL (SEC). ____________________________________________ 68
TABLE 15:RESULTS OF KPI'S FOR THE MODELS OF THE FOUR PLANNING APPROACHES. _______________________________ 69
TABLE 16:OUTPUT NUMBERS FOR THE MODELS OF THE FOUR PLANNING APPROACHES. ______________________________ 69
TABLE 17:PAIRED-T APPROACH FOR COMPARING THE PLANNING APPROACHES ON AVERAGE TOTAL THROUGHPUT TIME (SEC). ___ 70
TABLE 18:PAIRED-T APPROACH FOR COMPARING THE PLANNING APPROACHES ON AVERAGE INTERNAL THROUGHPUT TIME (SEC). _ 70
TABLE 19:CONFIDENCE INTERVAL FOR AVERAGE INTERNAL AND TOTAL THROUGHPUT TIME IN THE MRP-MODEL. ____________ 70
TABLE 20:CONFIDENCE INTERVAL FOR AVERAGE INTERNAL AND TOTAL THROUGHPUT TIME IN THE BOTTLENECK CONTROL MODEL. _ 71
TABLE 21:COMPARING THE PLANNING APPROACHES BASED ON TIME GAINS,WIP, AND WIP VALUE _____________________ 71
TABLE 22:COMPARING VARIABILITY BASED ON TIME GAINS,WIP, AND WIP VALUE (BASE MODEL). _____________________ 75
TABLE 23:WAITING TIMES IN THE BASE MODEL AND THE MODELS WITH VARIABILITY (BASE MODEL). _____________________ 75
TABLE 24:THE INFLUENCE OF LITTLE VARIABILITY ON THE BASE MODEL. _________________________________________ 75
TABLE 25:SAVINGS BY REDUCING VARIABILITY. _________________________________________________________ 76
TABLE 26:RESULTS OF KPI'S FOR DIFFERENT TRANSPORT DAYS (BASE MODEL).____________________________________ 77
TABLE 27:RESULTS OF KPI'S FOR DIFFERENT TRANSPORT DAYS (MRP-MODEL). ___________________________________ 78
TABLE 28:RESULTS OF KPI'S FOR COMBINATIONS OF TRANSPORT DAYS (BASE MODEL). ______________________________ 79
TABLE 29:RESULTS OF KPI'S FOR COMBINATIONS OF TRANSPORT DAYS (MRP-MODEL). _____________________________ 80
TABLE 30:COMPARING THE TRANSPORT DAYS BASED ON TIME GAINS,WIP, AND WIP VALUE FOR THE BASE MODEL. __________ 81
TABLE 31:COMPARING THE TRANSPORT DAYS BASED ON TIME GAINS,WIP, AND WIP VALUE FOR THE BASE MODEL, REGARDING THE
BEST TRANSPORT DAY. _____________________________________________________________________ 81
TABLE 32:COMPARING THE TRANSPORT DAYS BASED ON TIME GAINS,WIP, AND WIP VALUE FOR THE MRP-MODEL. _________ 82
TABLE 33:COMPARING THE TRANSPORT DAYS BASED ON TIME GAINS,WIP, AND WIP VALUE FOR THE MRP-MODEL, REGARDING THE
BEST TRANSPORT DAY. _____________________________________________________________________ 82
TABLE 34:RESULTS OF KPI’S FOR THE MODELS OF THE FOUR DIFFERENT SCENARIOS FOR ADDING AN EXTRA GROB (BASE MODEL). _ 83
TABLE 35:ASSUMED COSTS (BASED ON SECTION 2.4). ____________________________________________________ 84
TABLE 36:TOTAL MACHINE AND EMPLOYEE COST FOR ADDING AN EXTRA GROB. ___________________________________ 84
TABLE 37:RESULTS OF KPI’S FOR THE MODELS OF THE FOUR DIFFERENT SCENARIOS FOR ADDING AN EXTRA GROB (MRP-MODEL). 85
TABLE 38:RESULTS OF KPI’S FOR THE MODELS OF THE FOUR DIFFERENT SCENARIOS FOR ADDING AN EXTRA PALMARY (BASE MODEL). _____________________________________________________________________________________ 86 TABLE 39:TOTAL COSTS FOR THE MODELS OF THE FOUR DIFFERENT SCENARIOS FOR ADDING AN EXTRA PALMARY. ____________ 88
TABLE 40:COMPARING THE FOUR SCENARIOS FOR ADDING AN EXTRA PALMARY, BASED ON TIME GAINS, COSTS,WIP, AND WIP
VALUE. ________________________________________________________________________________ 88
TABLE 41:RESULTS OF KPI’S FOR THE MODELS OF THE FOUR DIFFERENT SCENARIOS FOR ADDING AN EXTRA PALMARY (MRP-MODEL). _____________________________________________________________________________________ 88 TABLE 42:COMPARING THE FOUR SCENARIOS FOR ADDING AN EXTRA PALMARY BASED ON TIME GAINS, COSTS,WIP, AND WIP VALUE.
_____________________________________________________________________________________ 89 TABLE 43:RESULTS OF KPI'S FOR A DIFFERENT DELIVERY AND ACQUIRING DAY (MRP-MODEL). ________________________ 90
xi TABLE 45:COMPARING THE DIFFERENT DELIVERY AND ACQUIRING DAYS ON TIME GAINS,WIP, AND WIP VALUE. ____________ 93
TABLE 46:RESULTS OF THE COMBINED MODEL (1). ______________________________________________________ 94
TABLE 47:RESULTS OF THE COMBINED MODEL (2). ______________________________________________________ 94
TABLE 48:OUTLINED NEEDED FTE'S WITH THE ATTACHED COSTS. ____________________________________________ 95
TABLE 49:NEEDED SHIFT FOR THE GROB MACHINE AND THE ATTACHED COSTS. ___________________________________ 95
TABLE 50:YEARLY MACHINE COSTS. ________________________________________________________________ 96
TABLE 51:OTHER YEARLY COSTS. __________________________________________________________________ 96
TABLE 52:TOTAL YEARLY COSTS FOR PRODUCING UNDER FOUR WEEKS. _________________________________________ 96
TABLE 53:SUMMARIZED RESULTS FOR INTERVENTIONS TO THE BASE MODEL. _____________________________________ 97
TABLE 54:SUMMARIZED RESULTS FOR INTERVENTIONS TO THE MRP-MODEL. ____________________________________ 98
TABLE 55:INTENDED PLANNING AND REAL PLANNING IN NUMBERS. __________________________________________ 110
TABLE 55:PRODUCTION PROCESS TABLE OUTLINING EACH STEP IN THE PRODUCTION. ______________________________ 112
TABLE 56:THROUGHPUT TIMES OF DIFFERENT PROGRAMS FOR THE GROB MACHINE (TYPE AC). _______________________ 133
TABLE 57:THROUGHPUT TIMES OF DIFFERENT PROGRAMS FOR THE GROB MACHINE (TYPE B). ________________________ 133
TABLE 58:COMBINING SOURCES OF DATA FOR THE THROUGHPUT TIMES. ______________________________________ 134
TABLE 59:CHOSEN THROUGHPUT TIMES FOR EACH DEPARTMENT. ___________________________________________ 137
TABLE 60:DETERMINING THE NUMBER OF CONWIP CARDS. _______________________________________________ 146
TABLE 61:DETERMINING THE NUMBER OF BOTTLENECK CONTROL CARDS IF THE PALMARY IS THE BOTTLENECK. _____________ 146
TABLE 62:DETERMINING THE NUMBER OF BOTTLENECK CONTROL CARDS IF THE GROB IS THE BOTTLENECK. ________________ 147
TABLE 63:DETERMINING THE NUMBER OF BOTTLENECK CONTROL CARDS IF THE FIRST TIME OUTSOURCING TO MPP IS THE
BOTTLENECK. ___________________________________________________________________________ 147
TABLE 64:DETERMINING THE NUMBER OF BOTTLENECK CONTROL CARDS IF THE SECOND TIME OUTSOURCING TO MPP IS THE
BOTTLENECK. ___________________________________________________________________________ 147
TABLE 65:DETERMINING THE NUMBER OF BOTTLENECK CONTROL CARDS IF THE PALMARY IS THE BOTTLENECK (10 REPLICATIONS). 148
TABLE 66:WAITING TIMES FOR DIFFERENT PLANNING APPROACHES. __________________________________________ 148
TABLE 67:PAIRED-T APPROACH FOR TESTING VARIABILITY. ________________________________________________ 149
TABLE 68:PAIRED-T APPROACH FOR A DIFFERENT TRANSPORT DAY TO MPP(BASE MODEL). _________________________ 149
TABLE 69:PAIRED-T APPROACH FOR A DIFFERENT TRANSPORT DAY TO MPP(MRP-MODEL). _________________________ 150
TABLE 70:PAIRED-T APPROACH FOR MULTIPLE TRANSPORT DAYS TO MPP(BASE MODEL). __________________________ 150
TABLE 71:PAIRED-T APPROACH FOR MULTIPLE TRANSPORT DAYS TO MPP(MRP-MODEL). __________________________ 151
TABLE 72:PAIRED-T APPROACH FOR ADDING AN EXTRA GROB (BASE MODEL). ___________________________________ 151
TABLE 73:PAIRED-T APPROACH FOR ADDING AN EXTRA GROB (MRP-MODEL). __________________________________ 152
TABLE 74:PAIRED-T APPROACH FOR ADDING AN EXTRA PALMARY (BASE MODEL). ________________________________ 152
TABLE 75:PAIRED-T APPROACH FOR ADDING AN EXTRA PALMARY (MRP-MODEL). ________________________________ 153
TABLE 76:PAIRED-T APPROACH FOR DELIVERY AND ACQUIRING DAY (MRP-MODEL). ______________________________ 153
TABLE 77:PAIRED-T APPROACH FOR DIFFERENT DELIVERY AND ACQUIRING DAYS (MRP-MODEL). ______________________ 154
xii
Reader’s guide
This reader’s guide is created to give the reader a better understanding of the structure of this thesis.
For this, I will shortly explain the contents of each chapter.
Chapter 1 includes the introduction to this thesis. It contains an introduction to PM-Aerotec and the problem context. Based on this problem context, a theoretical perspective has been chosen, together with outlining a problem-approach.
Chapter 2 includes the data-gathering. All necessary data was gathered including the production route, the current planning, throughput times, demand, transport-days, and costs. Since current capacity is not sufficient to produce the required amount, a capacity analysis was done and used as input for the eventual simulation model. Based on this analysis, potential bottlenecks were
investigated.
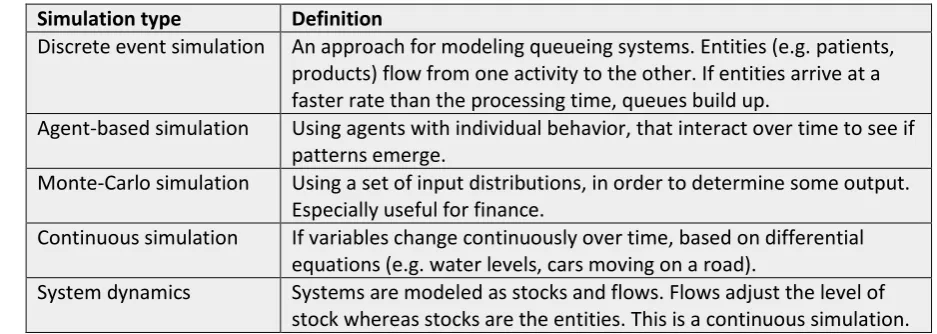
Chapter 3 outlines a literature study about planning and control and a simulation study. First, the basic principles of planning and control are outlined. Based on these principles, various planning and control approaches were investigated, of which many used pull-control instead of push-control. Second, the basic principles of a simulation study are explained. Only the simulation things that are needed in this thesis, are explained.
Chapter 4 selects three methods from the outlined planning and control approaches, by assessing the literature on the chosen KPI’s of PMA.
Chapter 5 includes the conceptual model for the eventual simulation model, including the model content and scope. Consequently, the chapter explains how the conceptual model was programmed into a simulation model. Moreover, the model is verified and validated within this chapter.
Chapter 6 includes numerous experiments and the results of these experiments. First, the planning approach experiments were conducted within the simulation model. Second, the influence of delivery variability was tested. Third, the influence of driving one or two times and on different days to the outsourcing company was tested. Fourth, the influence of extra machines was tested. Lastly, the influence of driving one or two times and on different days to the customer was tested.
Eventually, the best results of these experiments are included in one final model to test what is needed to produce the required amount of bearing supports within four weeks.
Chapter 7 eventually summarizes the conclusions and gives recommendations based on the experiments within the simulation model. Lastly, some shortcomings of this research and the contribution of this research are outlined.
The main points are summarized at the end of each chapter. Furthermore, if this document is read on a device, text in italics that refers to a section can be clicked. The document will then jump towards the mentioned section. I hope you (the reader) will enjoy reading my thesis.
xiii
Definitions
- Delivery and acquiring day: the day on which new bearing support castings come in from customer X, and finished bearing supports are delivered to customer X. This is one truck that comes and leaves on a certain day.
- Deviation: a production error within the product such that it does not conform the quality standards anymore. For example, tears or dents in the material. After a deviation, the customer needs to assess if the product can still be used or if it will become scrap.
- Grob: the brand-name of the turning and milling machine, that turns and mills the bearing supports. In spoken language, the Grob is more often used than the turning and milling machine.
- Kanbans: an object that triggers the movement, production, and supply of units between workstations. Usually, a card is used, containing the relevant workstation, job type, lot size, and card number.
- Palmary: the brand-name of the grinding machine, that grinds the bearing supports. Just like with the Grob, in spoken language, the Palmary is more often used than the grinding
machine.
- PMA: PMA is an abbreviation for PM-Aerotec, the company name. PM stands for precision metal. PM-Aerotec is part of the larger PM-group that covers multiple other companies.
- Transport day to MPP: the day on which a truck leaves to bring bearing supports to the outsourcing company MPP and brings back bearing supports that have been processed.
1
Chapter 1: Introduction
This chapter will outline the project plan for this thesis. First, an introduction to PMA and the problem context will be given. Next, the scope of this thesis within this problem context together with the theoretical perspective will be determined in order to set the focus for this research. Based on this, sub-questions will be constructed and outlined together with making a problem approach for answering these questions.
1.1 About PM-Aerotec and the bearing support
PM-Aerotec (PMA) is a supplier of high-precision parts and mechatronic integrated modules for the aerospace industry, aeronautical space programs, military programs, and maritime projects (PM-Aerotec, 2019). Examples of well-known customers are Boeing, Airbus, Thales, and Pilatus. PMA is part of the larger Precision Metal (PM) Group that in total consists of six divisions: Bearings, Motion, Mechatronics, Aerotec, Precision, and Precision sheet metal. PMA can be seen as a small-to-medium sized firm since approximately 55 employees work for PMA (BBVA, 2019). Every division of the PM-group operates largely as an independent company.
Examples of products processed by PMA are aeronautical engine components like engine shafts, aerospace blisks, sheet metal aeronautical structures, and complex fuel tank structures
(PM-Aerotec, 2019). These few examples indicate that the scope of PMA is focused on precision metal manufacturing for specific components and customers, focusing on performance and quality. In literature, this is identified as a make-to-order company, where manufacturing starts after a
customer’s order is received (Slack, Brandon-Jones, & Johnston, 2013, p. 296). Every product can be seen as a separate project with its own special needs.
This bachelor thesis is mainly about the bearing support which is produced for customer X. The name of the customer is not mentioned because of confidentiality issues. The bearing support is a titanium aircraft engine component to which the main shaft of the engine is mounted. The casting of the product is not done by PMA. PMA receives the casted products from customer X and processes them to eventually deliver them back to customer X. A drawing of a bearing support is displayed in figure 1.
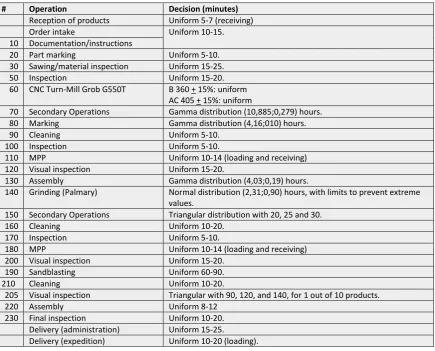
The core processes of PMA regarding the bearing support are turning, milling, and grinding the product. However, in order to do, check, and finalize these processes, a lot of other necessary production steps are needed. Think about expedition work, measuring, cleaning, deburring, marking, documentation, inspections, sandblasting, and assemblies of sub-parts. Eventually, the production of one bearing support consists of 27 steps. Identifying the contents, characteristics, and throughput times of all these steps will be part of this thesis (see chapter 2).
1.2 Problem context
Like almost every production environment, the production of the bearing support also has its own problems. PMA started making ideas to produce the bearing support in February 2016. However, it took a long time before the project was officially approved by customer X. The project was officially started around October 2016. As with many new projects, the start of this project was difficult. Today, April 2019, the project is in its ramp-up phase. The last technical problems are being solved and it is time to improve the efficiency of the production. Therefore this thesis is needed. One of the main problems of PMA is to reduce the throughput time. Throughput time is the “average elapsed time taken for inputs to move through the process and become outputs” (Slack, Brandon-Jones, &
*Text in italics that refers to a section within the document can be clicked.
2 Johnston, 2013, p. 100). The initially acquired action problem was: How can the throughput time of the bearing support be minimized from 9 weeks to a maximum of 4 weeks? Main reasons for reducing the throughput time are:
1. Decreasing WIP. The customer remains the owner of the bearing supports. If PMA decreases the throughput time of the bearing support, the customer has less business capital tied-up in inventory. Furthermore, the high WIP takes in a lot of space in the production hall of PMA. Therefore, PMA risks damaging the products when they are in their WIP.
2. Reducing planning uncertainty. By producing faster, the planning uncertainty for the customer will reduce. In addition, it increases the flexibility of the customer since they can order parts in a short time-horizon.
3. Invoicing. By producing faster, PMA can send their invoices to the customer earlier than before, which will speed up the cash flows.
4. Competitive position. PMA is not the only producer of bearing supports. By increasing the throughput time, the competitive position of PMA will improve since throughput time is a competitive factor.
To solve this problem, the managerial problem-solving method (MPSM) of Heerkens and van Winden (2012) is used. The first step of this method is the problem identification step. This identification starts with basically acquiring all problems within a company. This was done by interviewing the director, the project supervisor, the production planner and multiple shop floor workers that work with the bearing support on a daily basis. The list was completed by looking into certain company documents and by simply looking around. This resulted in a long list with problems, that eventually was shortened to display only all relevant problems. This long list can be found in appendix A.1.
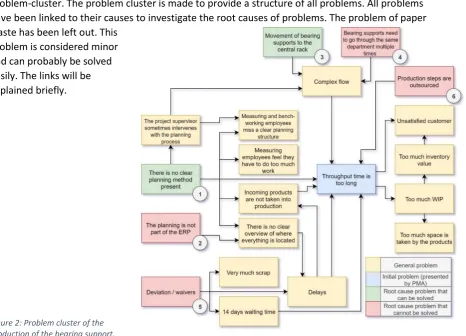
Since problems have been identified, the second phase of the problem identification is to make a problem-cluster. The problem cluster is made to provide a structure of all problems. All problems have been linked to their causes to investigate the root causes of problems. The problem of paper waste has been left out. This
[image:17.595.81.548.430.766.2]problem is considered minor and can probably be solved easily. The links will be explained briefly.
3
Root cause 1: no clear production planning
First, many problems occur because there is no clear production planning. Currently, it is decided to plan certain production steps in a week. The next week, the following chain of production steps will be done and so on. This is not an efficient method since it results in a lot of waiting time from week-to-week. However, one look at the planning shows that this approach is also not strictly followed. This makes the planning process a bit arbitrary and hard to follow as an outsider.
Discovering how the current planning approach exactly works (if present) and what the restrictions are, will also be part of this thesis (see: section 2.2). Planning in this way is currently done in order to easier adapt to potential deviations in the product that are still present but will be solved. In
addition, the current production output is not that high yet, so it is sufficient for the situation at hand. Lastly, some departments also work on other products. With this planning, the departments have more freedom to choose when they will process the bearing supports. The current planning results in longer throughput time, because certain production steps could also be done within one day, based on their throughput time. According to the planner, production planning has not really been a topic that was thought about yet. Measuring and bench working employees acknowledge this. The interventions in the production of the bearing support by the project supervisor also underline this. If a clear planning method was present, there would be no reason to interfere. The fact that the project supervisor sometimes intervenes with the production planning, results in a more complex flow since it is not communicated what was done and thus the regular flow is interrupted. The measuring employees also feel they have to do too much work (not only to produce the bearing support). It should be investigated if this is true or because the jobs are not scheduled right.
According to the planner, enough capacity is present. However, this should be investigated. Because there is no clear planning method, certain incoming bearing supports were simply not taken into production because it was forgotten and because there were delays.With a clear planning structure, this would have been shown. In addition, because of the delays, other bearing supports were not taken into production since the delayed products should first be processed. Lastly, the lack of a clear planning method contributes to the fact that there is no clear overview of where every bearing support is located. If the planning was right, it would show exactly where in the process the products should be. The intractability of bearing supports results in delays (and thus a longer throughput time) since the products first have to be found before they can be processed.
Root cause 2: the production planning is not part of the central ERP
Second, the production planning of the bearing support is not part of the central ERP-system. This also contributes to the fact that there is no clear overview of where everything is located. This intractability takes time (see before). In addition, in this way, the occupation of departments by other products for different customers are not considered. Therefore, it could be that too many products are scheduled on a certain day for a certain department. Lastly, it also brings less flexibility.
Currently, the project supervisor and the planner update the planning manually, while an ERP-system can usually do this automatically.
Root cause 3: unnecessary movement of the bearing support
4
Root cause 4: the bearing support needs to go through the same department multiple times
Fourth, bearing supports need to go through many of the same production steps because of quality issues. For example, the product needs to be measured and cleaned multiple times. This again results in a complex flow since the product does not flow smoothly to the next department, but often needs to go back to an earlier department. As said, this complex flow takes time. Examples of these steps are inspection, measuring, and, deburring which are all recurring steps.
Root cause 5: deviation/waivers
Fifth, the many deviation and waivers are still present because the product is still quite new to PMA. Deviations and waivers are basically production errors. For example, certain tolerances are not met, or the product is slightly damaged. Many causes of deviations and waivers have been solved already, but there are still a lot of problems present that are slowly getting solved. Not many new problems emerge. These deviations result in scrap or delays because customer X must determine if the product can still be used or not. These deviations mainly influence the output of the process, however, it also influences the throughput time. This assessment of the customer X takes time (delay), resulting in longer throughput time. If the product cannot be used anymore, the product will be disposed. One of the deviations are tears in the material after grinding. Because of this, the first following 100
products must wait for two weeks to relax, resulting in longer throughput time.
Root cause 6: outsourcing of production steps
Sixth, the products are outsourced for tear inspection. This is being outsourced since it is too expensive for PMA to do for themselves. Another student had investigated this. Doing this in-house
would cost around €100, - per bearing support, which would not leave enough profit margin for PMA. Doing tear inspection in-house is expensive since PMA is simply not capable of doing this by themselves. This outsourcing results in an increase of the throughput time by two weeks.
Sandblasting is also currently outsourced. This also takes one week, resulting in longer throughput time. However, sandblasting will be done in-house somewhere in the 2nd quarter of 2019. The machine is already bought, delivered and placed.
The action problem: causes and consequences of the throughput time
Concluding, outsourcing, delays in the process, complex flow, and the lack of a planning method contribute to the initial fact that the throughput time is too long. Moreover, as mentioned before, some products that come in are not taken into production, already resulting in a longer throughput time from the start. The long throughput time and the delays make the customer unsatisfied. A longer throughput time has disadvantages for both the customer and PMA, as outlined before. The customer has set a goal of a throughput time of 4 weeks.
1.3 Choosing the core-problem and research question
5 The fact that the product needs to go through so many redundant production steps, especially regarding measuring, cannot be solved because of quality certification and the fact that the customer needs to guarantee this quality. This is a familiar phenomenon in the aircraft component industry. The number of deviations and problems can be solved, which is currently done by the quality manager. This is a familiar problem for companies that take a product into production for the first time (Steenhuis, 2015). Especially the steps with the ring on the product still result in a lot of problems for PMA. However, to help to solve these problems, more technological knowledge is needed which is beyond the scope of this thesis. Moreover, it will take too much time since PMA is already working two and a half years on these problems. A quality manager is looking at these problems from a different perspective. He tries to change certain things within machines, processes, and production steps in order to prevent deviations and waivers.
The fact that the production planning is not part of the ERP-system also has to do with the fact that the product is still in an introductory phase. In the future, when the deviations within the production are solved, it will be implemented in the ERP-system (according to PMA). Currently, it is not efficient to implement it now since it will need multiple adaptations. The details and conditions first need to be right before implementing it in the ERP-system. Moreover, focusing on this problem requires IT-knowledge. It would be a relevant problem for an IT-thesis but not for an Industrial Engineering and Management thesis, so this will not be done.
To conclude, this leaves two chosen core problems that are solvable in 10 weeks of time:
1. There is no clear production planning method for the production of the bearing support 2. There is considerable movement present in the production of the bearing support
As mentioned, there is no clear planning method present. In the current situation, a certain production chain has one week to finish a batch of bearing supports. This leads to a longer
throughput time since products are waiting too long, whereas they can probably be processed much
earlier. In addition, even this approach is not strictly followed. This is considered ‘not clear’. ‘Clarity’
is not measurable yet. This will be done in step 1 of the problem approach, which will be explained
later. In this phase, restrictions and KPI’s will be identified in order to assess and measure a planning
method for PMA. A clearer planning approach could be an approach with clear consequent steps and more visibility, that at the same time scores ‘sufficient’ on the determined KPI’s(see section 4.1). The movement-problem also has been mentioned. This is mainly because of a central rack in the middle of the hall where all bearing supports go to. It should be investigated if this can be done in a different way. Movement can be measured in distance, time, the number of locations where bearing supports are located, heat maps, etc.
It has been determined to first solve the planning-method problem. This has been decided together with the director of PMA. Based on the problem identification, we believe that solving this problem is more effective than solving the movement problem. The problem-cluster underlines this since the planning method leads to more problems. Moreover, it is not certain if a solution to the movement problem is that effective because there is little different shaped space in the production hall. It is probably still valuable to investigate and map this.
Based on the core-problem the following research question can be constructed:
6
1.4 Theoretical perspective and scope
In this section, the scope and theoretical perspective of the main constructs in the research question will be outlined. This is done to provide insight into the main concepts and the way they will be used within this research. The definition of throughput time has already been explained.
First, this research will only focus on improving the situation for the bearing support. In order to keep this thesis manageable, other products will not be considered during the planning. This is difficult for departments that are not only working on bearing supports but also on other products. Second, this research will only provide ways and information to plan the production of the bearing support. It will not provide applications or tools. Third, this research will not be focusing on current production errors. It assumed that these problems will be solved soon resulting in a smooth flow of the bearing support.
The planning problem will be approached with the theoretical perspective of operations
management and operations research. Operations management “is about how organizations create and deliver services and products” (Slack, Brandon-Jones, & Johnston, 2013, p. 4). Operations
research is “a scientific approach to decision making that seeks to best design and operate a system,
usually under conditions requiring the allocation of scarce resources” (Winston, 2003, p. 1). Within these broad fields, relevant theories can be found.
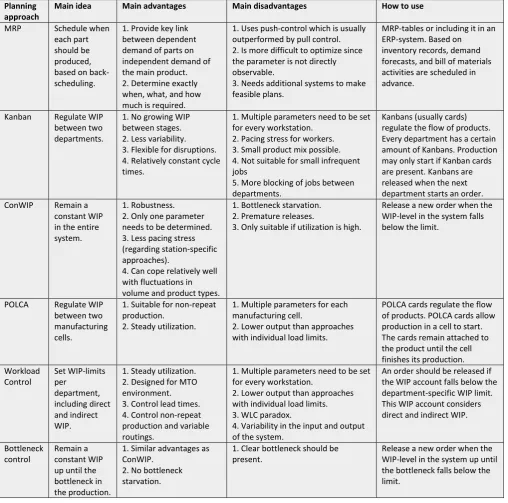
Theories to monitor and control operations are pull control, push control, the drum, buffer rope concept (also called bottleneck control), and workload control. These theories will be used in order to find a planning and control approach. In a pull system, the pace and specification of what is done are set by the consequent workstation which pulls work from the previous workstation. Pull control is often used in lean synchronization in order to match supply and demand (Slack, Brandon-Jones, & Johnston, 2013, p. 478). In addition, multiple planning approaches rely on pull principles. Two famous approaches are Kanban and constant work in progress (ConWIP). Kanban controls the transfer of items with cards and signals. It instructs the previous workstation to send new work. (Slack, Brandon-Jones, & Johnston, 2013, p. 478). ConWIP sets a limit on the total WIP in the entire system (Koh & Bulfin, 2004). On the other hand, in a push system, the activities are scheduled by a central system and completed in line. An example of such a system is the material requirements planning (MRP). A central system for planning and control is currently also in place at PMA. The workstation pushes work to the consequent station, without considering the number of products already present at the next step. An example of a system that can accommodate both pull and push systems is Paired Cell Overlapping Loops of Cards with Authorization (POLCA). POLCA also uses cards to show the free capacity between two working cells instead of stations (like with Kanban). Another theory is the drum, buffer rope (DBR) concept, from the Theory of Constraints (ToC). According to this theory, the bottleneck of the process (the slowest link in the process) should be the control point of the whole process. A buffer should be placed in front of this bottleneck (Slack, Brandon-Jones, & Johnston, 2013, p. 312). Workload control focusses on load-based order release mechanisms. The aim is to stabilize workloads in accordance with the output rate (Thürer, Stevenson, Silva, & Qu, 2017). Analyzing these planning and control approaches and their applicability to PMA will be part of this thesis, which will be outlined in chapter 3 and chapter 4.
Production planning can be defined by using the book of Slack, Brandon-Jones, and Johnston (2013).
They call this “planning and control of operations”. They do not make a distinction between planning and control since theory and practice are not clear about the division between planning and control. According to Slack, Brandon-Jones, and Johnston, planning and control is “concerned with the
7 coordinating, and organizing operations activities. A distinction is based on long-term, medium-term and short-term planning and control. The scope of this thesis will be on long-term planning, using aggregate demand and resource forecasts, with long-term objectives (Slack, Brandon-Jones, & Johnston, 2013). Production has been deliberately added in order to specify the term. For example, it is no use if a patient planning is found since such a planning has completely different restrictions and will be of no use.
Under approach, optimization techniques or heuristic algorithms are considered. The current planning method that is in place is also a planning and control approach, however, it is far from
optimal. For this, “optimization technique” has been added. An optimization technique will give
values for decision variables that optimize an objective function within its given constraints and the set of all values (Winston, 2003, p. 2). However, sometimes the number of variables and constraints can be so large that it might be difficult for computers or people to find an exact solution. In this case heuristics (or heuristic algorithms) can be used (Winston, 2003, p. 75). These can be described as
‘rules of thumb’ in order to search for a reasonable solution, but not optimal (Slack, Brandon-Jones, & Johnston, 2013, p. 209). However, these will also improve the situation.
Relevant characteristics of the current production of PMA are product-flow, bottlenecks, planning, capacity at work-stations and department-specific throughput times. Of course, there are much more characteristics of a production process like inventory, layout, people, etc. (Slack, Brandon-Jones, & Johnston, 2013). However, these seem to be the only relevant characteristics for the problem at hand. This might change after the interview with important stakeholders. I want to know these topics since they are input for planning method and simulation model (outlined later). Restrictions of the current production can be seen as so-called non-compensatory criteria. These are attributes that the planning method should have, otherwise, it cannot be taken into consideration (Heerkens & van Winden, 2012, p. 90).
The last construct in the research question considers the application at PMA. I want to point out that
“implementation” will not be part of this thesis. Multiple planning approaches will be outlined. All
these approaches will be scored on key performance indicators (KPI’s), that all have a certain weight.
In this way, scores can be given such that the right method will be applied. This method is quite familiar and outlined several times in literature. For example by Heerkens and van Winden (pp. 81-90), but also by Winston (pp. 785-792).
1.5 Sub-questions
To answer the overall research question, sub-questions will have to be answered. These are based on the key-constructs of the main research question. First, the main constructs of the sub-questions will be explained and if possibly operationalized. After this, the sub-question will be divided into multiple smaller questions. The motivation, data gathering and data analyzing of these questions will be outlined under the questions. Lastly, some reliability, validity and limitation issues of all sub-questions will be outlined.
1.5.1 Sub-question 1: restrictions and characteristics of the production process
1. What are the restrictions and characteristics of the production of the bearing support?
In this phase, all relevant characteristics of the production process should be outlined and data should be gathered. With relevant characteristics, recall that the following is meant (see: section 1.4): product-flow through the process (1.1), planning (1.2/1.3), throughput time (1.4), capacity at
8 simulation model. The restrictions (1.3) can be seen as non-compensatory criteria. This research is descriptive since the characteristics of the production will be investigated. The questions will deliver both qualitative and quantitative data. The sub-questions are:
1.1 What are the current production steps of the bearing support? 1.2 How is the production planning of the bearing support done? 1.3 What are restrictions for a planning method?
1.3.1 What is the weekly input?
1.3.2 What should be the weekly output? 1.3.3 Is a certain transport-day present? 1.3.4 Other restrictions?
1.4 What are the essential parameters and/or potential distributions of the throughput time for each production step?
1.4.1 What are the main activities in each production step?
1.4.2 What are the waiting times in the current production process? 1.4.3 What are the move times in the current production process? 1.4.4 What are the process times in the current production? 1.4.5 What is the set-up time for each production step?
1.4.6 Are the production times on paper right about the throughput time? 1.5 What is or should be the capacity at each production step?
1.5.1 Is there enough capacity to produce the specified weekly input? • Should extra people be hired in order to continue? • Should extra machines be bought in order to continue? 1.5.2 Is this step completely reserved for the bearing support?
• How much time is present to work on the bearing support? • When does this step have time for the bearing support? 1.6 What are the bottlenecks within the production?
Question 1.1 can be identified by following the product through the production process and
interviewing relevant shop-floor workers while doing this. Question 1.1 is important in order to make a planning method that meets reality. The production steps will be checked by the project supervisor such that I know for sure that it is the real situation. Question 1.2 can be acquired by interviewing the planner. Knowing the current method well is important to identify places for improvement and potential difficulties when constructing a planning method. Question 1.3 covers the restrictions of a planning method. Examples of certain restrictions have been outlined under question 1.3. A
distinction is made between input and output. In a perfect situation, this would be equal. However, since it is known that there are deviations and scrap this could be different. Should I consider this, or not? Question 1.4 can be identified by asking the production planner and shop floor workers about the time they are working on a step. This can be seen as an expert opinion. Moreover, by acquiring data from the ERP-system, probable throughput times can be acquired. These datapoints will be analyzed with Excel and SPSS, involving statistics. There might be too little data points within this ERP, so it is uncertain if this is useful. In addition, all activities in each production-step are known and written down since this is a requirement for aircraft components. This can also be used to assess the throughput times. The analysis of these multiple sources should produce throughput times
acknowledged by all sources. Furthermore, to construct each ‘total throughput time’, the framework
9 the production steps. The capacities of the machines and the conditions for this capacity should be determined. Some departments might not even have enough capacity to produce the specified amount of question 1.3. This was discovered when interviewing the project supervisor of the bearing support and by looking into documents.If capacity currently is insufficient in a production step, I should assess what is needed according to the director and use this as initial values. For example, an extra machine should be placed, an extra worker should be hired, etc. These initial values can also be experimental factors in the simulation model later. If the production steps do not have enough capacity, no assessment of a planning method and the throughput time can be made. In addition, recall that several departments are completely reserved to produce the bearing support (for example turning and milling) while other departments (for example bench working) also have to work on other products. It should be assessed how much time these departments have left to work on the bearing support and when. This is difficult to assess. If it turns out that it is too difficult to assess, simplifications should be identified. For example, by saying that there are always X number of
employees available for the bearing support. However, the more simplifications, the more the quality of the research will decrease. Question 1.6 is important because it can display weaknesses of the production process, which again could be used as an input for the planning method, for example by bottleneck control methods. By the gathered data, this question can easily be answered. Eventually, a thorough production flow map will be drawn together with a table that outlines all production steps and their activities together with the throughput times. This will be based on
‘input-transformation-output’. The table and the map should be the input for the new planning
method.
1.5.2-
Sub question 2: KPI’s to apply a production planning at PMA
2. What are the important KPI’s for a production planning at PMA?In order to assess and measure a planning method (application), KPI’s will have to be determined. One of the KPI’s will definitely be the throughput time consisting of set-up time, processing time, move time and waiting time (Johnson, 2003) since it is the main reason for starting this thesis. Other
KPI’s could be lateness, value-added time (time for processes that improve products), inventory, costs. This descriptive research will deliver qualitative results since KPI’s of a planning method will be identified. The sub-questions are:
2.1 What are important KPI’s for a planning method at PMA?
2.2 What are the individual weights for these KPI’s?
2.3 How can we assign scores to the KPI’s?
The most important KPI’s for PMA will have to be identified. This will be done by interviewing all relevant stakeholders: the planner, the director, and the bearing support project supervisor (research
population). At first, I will not give the stakeholders any examples of KPI’s. If they are not able to
come up with some KPI’s, I will give them a list with KPI’s in a random order from which they can choose. It is important to assess the importance of individual KPI’s. So, the weights should also be
asked. This could be done with the AHP-method (Winston, 2003, p. 785) to make a well-founded decision. However, this is not the initial plan because it is time-consuming. Eventually, all
stakeholders should agree with the chosen KPI’s and their weights in a meeting. Eventually, tables should be made that determine a score for a certain KPI. Doing this in advance will be beneficial because I will not be biased by certain findings in a later stage. With the scores and weights, eventual grades can be given to several planning methods and it will help to assess the importance of the different planning methods. To conclude, this sub-question should deliver a scoring template in order
10 simulation model (that will be explained later) since in a simulation model multiple KPI’s can be
tracked.
1.5.3 Sub-question 3: literature study for production planning approaches
3. What production planning and control optimization techniques or heuristic algorithms can be found in literature and how can they be applied in practice?
In order to make a good planning, a list of planning methods is needed to make a good decision. This knowledge question has two constructs of the main question, covered by the sub-questions namely:
“planning and control optimization techniques or heuristic algorithms (3.1, 3.2, and 3.3)” and “application in practice (3.2, 3.3, 3.4, and 3.5)”. Both constructs have been outlined in section 1.4.
The sub-questions are:
3.1 What are the main types of methods in literature to improve a planning method? 3.2 What are the advantages of each type?
3.3 What are the disadvantages of each type? 3.4 How does each method score on the chosen KPI? 3.5 How does each method fit the restrictions?
The research population will be literature. By conducting a systematic literature review, sources will be found in databases (descriptive research yielding qualitative results). Based on these sources, main production planning types should be identified and outlined such that a choice can be made during the problem approach. Each method should fulfill the restrictions, otherwise, it cannot be used (as mentioned at sub-question 1). The advantages and disadvantages of each method should be
summarized. In addition, by describing how each method performs on the chosen KPI’s, should provide an overview of which methods to use. Other researchers with different KPI’s and restrictions
could also use this overview to make a decision for their problem at hand. These planning approaches will not be investigated outside of the scope of the outlined theoretical perspective.
1.5.4 Validity and reliability issues
In the research, several reliability, validity, and limitation issues might occur. Many of them have already been discussed. A few highlights and how I want to solve them:
1. Lack of data points regarding throughput time in the ERP
The first step is extracting data from the ERP. If the ERP does not provide enough data points, multiple shop-floor workers can be interviewed as ‘expert opinion’. If their answers agree with each
other, it can be assumed as a reasonable time. Thirdly, production papers outline the time for a certain production step. This can also be an extra source of information. In addition, the initial sources for this determination on the production paper can be requested. Lastly, I can measure certain production times by myself. This is not desirable since it is time-consuming. The multiple sources of information can also be used as an extra validation of findings.
2. Determining final KPI’s and their weights
It has already been outlined how KPI’s will be acquired. However, if multiple KPI’s are selected, what will be final KPI’s? Why should the one KPI be excluded, while the other should be included if there
are too many KPI’s? In addition, how can the final weights be determined? For this, the AHP-method
11
3. Discrepancy between paper and reality
In multiple steps, there might be a discrepancy between paper and reality. This was already encountered when making this project proposal. Therefore, results based on documents should always be checked by one of the stakeholders before using them. In addition, if a discrepancy between my measurement and a document is found, it should be discussed how this is possible. This will prevent me from proceeding with the wrong data.
4. Capacity at work-stations
This issue has already been discussed. Probably, some production steps might not have the amount of capacity to produce the specified amount. By interviewing the director, it has been determined to assume the capacity that is needed. In addition, measuring the time left for the bearing support at production steps that are not completely reserved for the bearing support is difficult. For this, simplifications could be made, for example by priority rules and assuming that there is enough capacity. More simplifications and assumptions will, however, decrease the quality of this research.
5. Conditions in literature
In literature, multiple planning approaches can be found. Usually, these sources also make
assumptions and simplifications. Moreover, these sources are applied to a certain environment with certain characteristics. These conditions should be identified before consulting these sources. Otherwise, the results might not be applicable to my case.
1.6 Problem approach and objective
In order to answer the research question, the following problem approach has been constructed together with its objective.
Step 1: data gathering and analyzing
Data gathering and analyzing in this phase basically means answering sub-questions one and two. As
mentioned, this step will produce a scoring template for the different KPI’s in order to structure the
literature study. In addition, restrictions together with the production map and the production table with all relevant parameters will be constructed.
Step 2: literature study
In this phase, sub-question three will be answered. This has also been outlined above. This step will produce an overview of different planning methods with advantages, disadvantages, and assessment of the different KPI’s. This assessment helps to structure the literature study by summarizing how each planning method performs on the KPI.
Step 3: choosing and outlining a planning method for PMA
Based on literature and data-gathering it is time to outline the overall planning methods that can be used by PMA. All needed data and knowledge should be present at this point. In addition, a decision on which planning approaches to use in the simulation model should be taken based on the overview of sub-question three. It should be assessed how the constructed planning methods score on the
KPI’s and if it meets the restrictions. This phase should outline multiple planning methods that can be used by PMA.
Step 4: solution testing in a simulation model