Original citation:
Öhman, Mikael, Finne, Max and Holmström, Jan. (2015) Measuring service outcomes for adaptive preventive maintenance. International Journal of Production Economics . ISSN 0925-5273
Permanent WRAP url:
http://wrap.warwick.ac.uk/69788
Copyright and reuse:
The Warwick Research Archive Portal (WRAP) makes this work by researchers of the University of Warwick available open access under the following conditions. Copyright © and all moral rights to the version of the paper presented here belong to the individual author(s) and/or other copyright owners. To the extent reasonable and practicable the material made available in WRAP has been checked for eligibility before being made available.
Copies of full items can be used for personal research or study, educational, or not-for-profit purposes without prior permission or charge. Provided that the authors, title and full bibliographic details are credited, a hyperlink and/or URL is given for the original metadata page and the content is not changed in any way.
Publisher’s statement:
© 2015, Elsevier. Licensed under the Creative Commons Attribution-NonCommercial-NoDerivatives 4.0 International http://creativecommons.org/licenses/by-nc-nd/4.0/
A note on versions:
The version presented here may differ from the published version or, version of record, if you wish to cite this item you are advised to consult the publisher’s version. Please see the ‘permanent WRAP url’ above for details on accessing the published version and note that access may require a subscription.
MEASURING SERVICE OUTCOMES FOR ADAPTIVE PREVENTIVE
MAINTENANCE
Mikael Öhman, Max Finne, Jan Holmström
Öhman, M., Finne, M., Holmström (forthcoming). “Measuring Service Outcomes for
Adaptive Preventive Maintenance”. Accepted for publication – International
Journal of Production Economics.
Mikael Öhman, Aalto University, School of Science, Espoo, Finland email:
Max Finne, Warwick Business School, University of Warwick, Coventry, UK;
Aalto University, School of Science, Espoo, Finland, email:
Jan Holmström, Aalto University, School of Science, Espoo, Finland, email:
1
Measuring Service Outcomes for Adaptive Preventive
Maintenance
Abstract
Services account for an increasing share of economic activity in the western world. As part of
this, preventive maintenance (PM) service volumes are constantly growing as a result of a
growing (and aging) asset population and maintenance outsourcing. While the pursuit of
improved service productivity is in the interest of both firms and nations, the challenges of
measuring service performance, and more specifically service outcomes, persist. This paper
presents an outcome-based measure for fleet PM, which has far-reaching implications
considering service productivity and performance measurement.
We develop a statistical process control based measure that utilizes data typically available in
PM. The measure is grounded in reliability theory, which enables generalization of the
measure within PM services but also outlines the limitations of its application. Finally we
apply the measure in a PM field service process of a servitized equipment manufacturer.
Based on actual maintenance records we show that the service provider could reduce their
service output by at least 5–10% without significantly affecting the aggregate service outcome.
The developed measure and control process form the basis for adaptive preventive
maintenance, which is expected to facilitate the transition towards outcome-based contracts
through complementing condition-based maintenance. One of the key benefits of the
approach is that it provides a cost-effective way of revealing the scarcely studied phenomenon
productivity gains in making sure that you meet required standards for service output but do
not exceed them.
Keywords: service performance; Statistical Process Control; outcome measurement;
preventive maintenance; design science.
1
Introduction
The global engineering assets base is growing and aging in an era where the pursuit of
economic efficiency is driving both firms and governments to outsource their maintenance
functions. This is creating a constantly growing demand for comprehensive maintenance
services. In answering to this demand, the maintenance service provider is paid to restore and
sustain engineering asset availability through corrective maintenance and preventive
maintenance (PM). The nature of PM services implies long-term contracts, with a
relationship-based business logic (Brax, 2005; Johnsen et al., 2009; Oliva and Kallenberg,
2003). Further, as the decisions and actions of the maintenance service provider have a direct
effect on asset availability, the service provider is bound to accept liability, at least to some
extent. This introduces outcome-based elements to contracting (Eisenhardt, 1989a), which
may ultimately lead to business logics where the maintenance service supplier is paid for
equipment availability (Baines et al., 2009; Hypko et al., 2010a; Ng et al., 2009; Oliva and
Kallenberg, 2003). As service provider income is then tied to the service outcome, service
operations management becomes more challenging. In effect, the pursuit for productivity is
complemented by the pursuit for effectiveness (Djellal and Gallouj, 2013), which
consequently raises the bar for operational performance measurement. This challenge,
recognized by academics and practitioners alike (Oliva and Sterman, 2001; Selviaridis and
When moving towards more outcome-based contracts, the cost of quality (cf. Schiffauerova
and Thomson, 2006) is reallocated from the customer to the service provider. This is the case
for both below optimal quality (under-service), where the service supplier incurs penalty costs
or loses performance bonuses, and above optimal quality (over-service), where the service
supplier would have achieved the same outcome with less resources or inputs. The latter is
exceptionally challenging in PM, where the created customer value equates to sustained
equipment availability. In other words, the customer does not experience the value of the
service as the service action is performed but rather it is experienced between the performed
service actions. For the customer the actual service delivery can be a nuisance as the
equipment may be unavailable during service delivery. This implies that mitigating
over-service in the case of PM translates to postponing service actions as much as reasonable,
while avoiding equipment failure resulting from under-service. In other words, it is a
balancing act along the thin line between under- and over-service. The service operations
challenge thus becomes one of optimal service timing, with respect to deployed resources and
created value.
Currently the challenge of optimal service timing in PM is tackled in two principally different
ways. In what could be characterized as design-based preventive maintenance (DPM) the
manufacturer of the equipment estimates the proper service timing based on reliability
estimates, calculations and simulations (Murthy et al., 2008). While this is a cost-effective
way of determining service timing, it cannot account for the full spectrum of operational
environments that the equipment may be subjected to, implying a likely bias toward
over-maintenance. On the other hand, in condition-based maintenance (CBM), PM timing is
based on the monitoring and prediction of equipment deterioration. While this method
typically enables optimal service timing, it is not applicable for all maintainable technologies.
need to be retrofitted. The question is whether something could exist between these two
extremes which is more accurate and optimal than DPM while allowing wider implementation
and less costs and effort than CBM. We seek to provide such an alternative through
measuring and consequently learning from service outcomes, represented by equipment
availability in the context of PM.
While equipment availability as such is fairly easy to measure, the performance measurement
challenge lies in measuring availability in a way that supports service action timing. While it
is fairly easy to measure how efficiently maintenance actions are performed (e.g. the time it
takes a technician to perform a maintenance action), PM effectiveness is a more challenging
concept. This is because the service provider will know neither how much the PM action will
postpone the inevitable failure nor when the next PM action should be performed. Postponing
failure is essentially the service outcome and it determines the equipment availability. Thus
we answer the question: How can PM service performance be measured in a way that
facilitates control of service outcomes?
We answer this question by designing (van Aken, 2004; Holmström et al., 2009) a statistical
process control (SPC) based measure, building on principles derived from reliability theory.
This measure, untypically for SPC, essentially measures the customer process instead of the
service supplier’s process, making it an indirect measure of value-in-use. Hence, the
developed measure could also be seen as a manifestation of service-dominant logic, where it
is not the service supplier process but the customer process which is the basis for performance
measurement (Ng et al., 2009; Vargo and Lusch, 2004; Vargo et al., 2008). Further, due to the
customer focus of the measure, we can also measure distributed service production with a
conceptual service process (implying multiple concurrent process instances), whereas
traditional SPC applications have been limited to centralized (service) production with a
Due to the statistical basis of the measure, its applicability lies mainly in the PM of groups or
fleets of similar equipment. Consequently, the control of service outcomes is also exerted on a
fleet level. In other words, the design complements the service operations management of
single pieces of equipment with managing fleets of equipment, introducing a systems
perspective to service provision, as proposed by Ng et al. (2009). Further, the developed
measure, along with the outlined method for the control of service outcomes that we call
adaptive preventive maintenance (APM), provides the sought “middle ground” alternative to
DPM and CBM. Through being more optimal than DPM, while involving less
implementation costs and effort than CBM, APM also lowers the bar for the transition
towards outcome-based contracts through a cost-efficient reduction and quantification of
outcome uncertainty (Eisenhardt, 1989a). Thus this work aims at contributing to a more
productive society by maximizing service effectiveness rather than efficiency.
This introduction is followed by a review of previous research into the role of outcomes in
performance measurement and how this is related to SPC application in service operations. In
section 3 we describe the design methodology employed by the research along with a
description of the case company. In section 4 we describe the development of the measure and
related control process, including the measure’s foundation in reliability theory. In section 5
we demonstrate and evaluate the measure in the case context (consisting of three embedded
cases). Finally, in sections 6 and 7 we discuss the implications for theory and practice, and
outline the limitations of the research, ending with concluding remarks.
2
Measuring service outcomes
The customer perspective has had a legitimate role in performance measurement since the
influential article by Kaplan and Norton (1992). However, few works have outlined how the
2000). The customer perspective is also central regarding preventive maintenance (PM),
because performance measurement has to focus on the customer process, as PM is performed
to sustain equipment availability. Customer satisfaction typically figures in frameworks and
practice, in some situations even to the extent that it is presented as the only measurable
outcome (cf. Brown, 1996). However, regarding PM, measuring only customer satisfaction is
problematic because it does not solve the underlying problem of the attributability of
outcomes to service actions as it is dependent on the customer appreciating the technical
consequences of the delivered service (Woodruff, 1997). An alternative outcome measure
frequently appearing in different frameworks is customer value. The problem with customer
value as a measure, is that it is hard to define precisely (Parasuraman, 1997), and while being
an antecedent to customer satisfaction (Woodruff, 1997) it also suffers from the same
dilemma of service outcome attributability.
A possible avenue to overcoming the challenges regarding different measures of customer
perspective is to measure quality. The customer perspective is also, at least to some extent,
captured by the concept of quality (Neely et al., 1995). Despite this, the relationship between
customer satisfaction, quality and value is somewhat ambiguous (Reeves and Bednar, 1994).
However, quality can more easily be translated into concrete measures (Parasuraman et al.,
1985). Service quality has also been tied to service co-creation by Lillrank and Liukko (2004),
who note that variance in quality depends on the heterogeneity of the processes which
produce the service. Grönroos (2000) defines service quality as a construct with two different
components valued by the customer: the functional quality, which addresses how the service
was delivered, and the technical quality, which addresses what was delivered. Within these
components, the customer-perceived quality is determined by the difference between expected
and experienced quality (Parasuraman et al., 1985). Related to this, we should also consider
and fitness for use. Further, Neely et al. (1995, p. 85) define the “cost of quality” concept as
“a measure of the extra cost incurred by the organization because it is either under- or
over-performing” (cf. Schiffauerova and Thomson, 2006). This definition suits the PM
context well, where performance depends on maintaining high quality through avoiding over-
or under-delivering the service. Considering the dual nature of quality as defined by Grönroos
(2000), this paper focuses solely on technical quality, namely what is delivered.
The applicability of SPC is dependent on how well the process is defined (Oakland, 2008).
Lillrank and Liukko (2004) divide service processes, based on their heterogeneity, into
non-routine, routine and standardized. Reflecting this against Reeves and Bednar’s (1994)
definition of quality, we could expect that standardization formalizes process requirements,
which enables measurement of conformance to requirements. On the other hand, if the
delivered service value can be objectively expressed and measured, SPC can be applied to
measure and control fitness for use. PM provides such a context as – in Grönroos’s (2000)
terms – technical quality is objectively expressed as availability and cannot exceed 100%.
While SPC has been suggested as a suitable tool for measuring and improving service quality
(Mefford, 1993) and more specifically maintenance quality (Duffuaa and Ben-Daya, 1995;
Ridley and Duke, 2007), it has not been widely adopted by practitioners (Mason and Antony,
2000). Implementations reported in academia are consequently far from abundant, with the
exception of implementations in healthcare where SPC has been reported to have been used in
several different applications (Thor et al., 2007). While there are a number of
implementations reported within the PM context, they tend to be factory-centric (Jacob and
Sreejith, 2008; cf. MacCarthy and Wasusri, 2002), that is to say dealing with a single
“customer” process and a heterogeneous installed base. Further, the reported implementations
typically deal with quality in terms of product quality, rather than service quality (Chan and
focuses on service performance and quality in fleet-centric operations, implying multiple
concurrent and independent customer processes served by fairly homogeneous equipment.
The potential value of SPC in fleet maintenance has been recognized (Xie et al., 2002), and
despite there being a few reported implementations (eg. Vassilakis and Besseris, 2010), the
authors were unable to find any previous implementations in field services, which is the
context of this paper.
3
Methodology
In this study we take a design science approach (van Aken, 2004; Holmström et al., 2009),
through which we develop and evaluate a solution for measuring PM outcomes. We present
the developed SPC-based measure as a design artefact that can be used to improve PM
performance (van Aken, 2004). We claim that in a given PM context, due to given
mechanisms, the implementation of the presented artefact (the developed measure) will result
in the desired outcome (Denyer et al., 2008) of improved performance. Thus the key attributes
for evaluating the validity of this research lie not in the number of replications in different
settings but rather in the detailed exploration, explication and description of the context
dependent mechanisms (van Aken, 2004) through which the artefact is observed to produce
outcomes. This empirical process, based on a mix of qualitative and quantitative data, is
described in the following part of the paper. As stated by van Aken (2004, p. 226) “a
design-science is not concerned with action itself, but with knowledge to be used in designing
solutions, to be followed by design-based action”.
3.1 The design science process
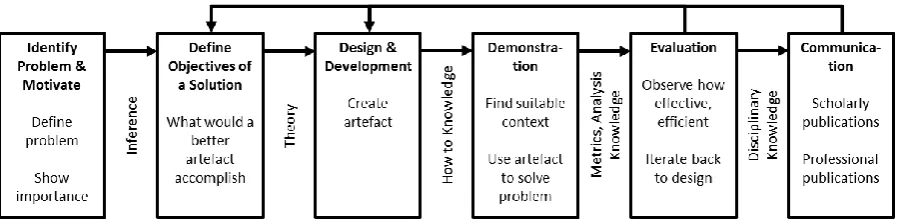
As illustrated in figure 1 below, the design science approach can be described as an iterative
six step process (Peffers et al., 2007, pp. 52–56), based on which the remainder of this
Figure 1. The design science research process, adapted from Peffers et al. (2007, fig. 1).
The study was conducted in close co-operation with the case company from the very
beginning, starting with problem identification and eventually progressing through solution
development to demonstration of the solution. As something inherent to design science, what
eventually became the object of study (the SPC-based measure) did not exist at the outset of
the research. In more traditional methodological terms the research could be characterized as
a single case study, methodologically justified by the uniqueness (and novelty) of the
phenomenon and the exploratory nature of the research (Siggelkow, 2007; Yin, 2009).
However, in the demonstration phase of the study we highlight the embedded nature of the
case study (Yin, 2009) as we demonstrate the developed measure in three different (embedded)
cases, based on data from three European countries. For each country we were also able to
perform separate analysis based on the technologically different main components of the
studied equipment, while controlling for environmental and operational variables.
The design science approach produces designs which are constructed through a combination
of iterative research and prior knowledge of context dependent mechanisms. The question of
design transferability thus becomes one of context similarity with respect to mechanisms
relevant to the design, and testing the design in different contexts is done to explore variation
in intended and unintended outcomes. The three embedded cases in the demonstration phase
enabled evaluation of the measure in similar problem contexts with slight differences (e.g. in
provide sufficient context variation for demonstration and evaluation of the measure, as with
any exploratory research aiming at theory development, further testing in more varied
contexts is required. The aim of this further research is then to reveal further context
dependent mechanisms, determining the contextual limitations of the applicability of the
design, eventually leading to a saturation of findings (Eisenhardt and Graebner, 2007;
Eisenhardt, 1989b).
While Peffers et al. (2007) assume that the design science process starts with a problem for
which a solution is developed, Holmström et al. (2009) note that an equally viable
starting-point for the process is that of a solution for which a suitable problem needs to be found. The
latter was the case in this study, where the case company saw untapped potential in the
installed/service base information that the company possessed. As the “pre-solution” in this
case offered merely the means for creating the actual solution, we find Peffers et al. (2007)
process fully applicable beyond the first step suggested by Holmström et al. (2009).
Continuing with the first step in Peffers et al. (2007) process (figure 1), a solvable problem
was then sought, first in terms of service process efficiency but then converging towards
service process effectiveness, wherein an appropriate problem was eventually found and
theoretically framed. As the problem and the means for creating the solution (the installed
base information possessed by the company) were both known, the solution objectives were
defined as to “control and eliminate over-maintenance”, which concluded the “problem
identification and motivation” and “define the objectives for a solution” phases (Peffers et al.,
2007, pp. 52–55). During these phases we conducted and recorded three semi-structured
interviews with key company personnel, each lasting for 1.5–2 hours, which were
subsequently transcribed. Further we arranged three workshops lasting 1.5–3.5 hours and two
shorter discussions where potential problems and solution objectives were discussed and
observation of a service technician lasting 3.5 hours and from a wide variety of company
internal documentation, including maintenance process descriptions.
The “design and development” and “demonstration” phases (Peffers et al., 2007, p. 55)
involved less case company interaction. For design demonstration during these phases the
case company supplied three sets of service records consisting of the complete records and
equipment specifications for a total of 2640 individual pieces of equipment in three European
countries, covering a time span of 24–30 months. The supplied data was cleaned in order to
remove new and incoming equipment, which left 2504 equipment service histories to be
analysed. The data was then further cleaned through the removal of service events conducted
for reasons other than maintenance and the removal of service events with missing data.
During these phases we also arranged two workshops with key company representatives, each
lasting 1.5–2.5 hours, where data related issues were discussed and the design was iterated.
In the “evaluation” phase (Peffers et al., 2007, p. 56), we were able to show that the service
base was on average over-maintained, which confirmed the suspicions amongst the
interviewed company personnel. However, the implementation of the control part of the
measure was not possible with the current configuration of company IT systems, which meant
that a further implementation effort was needed (and subsequently taken on by the company)
in this respect. All in all, we can still say that the devised design artefact reached the
objectives set for the design by making over-maintenance visible through the new
measurement approach. Additionally, the data upon which the solution draws and the
mechanisms which serve as a foundation for the measure were so explicit that we argue that
the limits of design transferability to other similar contexts can be quite confidently discussed.
To sum up, the first five phases (Peffers et al., 2007) described above allow us to formulate
And finally, this paper constitutes the sixth and final “communication” phase (Peffers et al.,
2007, p. 56), where we describe this process of theorizing (Weick, 1995).
3.2 Case selection and description
The industry in which the case company operates ranks among the frontrunners of
servitization (Vandermerwe and Rada, 1988), and within this industry the case company is
one of few leading global companies. The company is a capital goods manufacturer with over
half a century of experience in providing after sales services, including PM field services. The
company is considered as a benchmark in effective field services, and half of the company’s
total generated revenues come from service sales. The equipment manufactured by the
company typically has a supporting role in customer operations and is not operations critical.
Further, in most countries the service of the equipment is regulated by national or industry
institutions as the customer is usually different from the end-user and has limited competences
in maintaining the equipment on its own.
The case company has a global service base of approximately a million individual pieces of
equipment. The underlying technologies for this type of equipment are fairly similar between
different manufacturers, which enables the company to serve both its own and competitor’s
makes, and vice versa. The (business-to-business) service market for the equipment is fairly
competitive with both global and local players, which means that tendering for services and
modernizations is frequent. This also has implications for the information used by the
developed measure (cf. Hypko et al., 2010a) as equipment service histories may be
fragmented and equipment information outdated. In the following section we present how the
measure is developed based on reliability theory, while its empirical application is outlined in
4
Developing the measure based on reliability theory
In this section we describe the development of the design artefact (Peffers et al., 2007), which
in our case is the method for PM performance measurement. We first present the
theory-grounded design propositions (DPs) (Denyer et al., 2008) based on which it is
designed. In doing this we mainly draw upon the tenets of reliability theory. Here, reliability
is essentially an antecedent of the demand for PM. After this we describe the design which is
developed based on the DPs. Thus we outline relevant constructs and justificatory knowledge,
followed by a description of form and function, and the principles of implementation, all of
which are key components in theorizing through design (Gregor and Jones, 2007).
4.1 DPs
As the purpose of PM is to prevent failures from happening, the need for PM is determined by
how often the equipment would fail without the maintenance actions. This is a probabilistic
problem in the sense that we cannot know exactly when the equipment will fail (Murthy et al.,
2008). This is despite the fact that a timespan can typically be specified within which the
equipment will eventually fail and perhaps also variations in the failure rate during this time
span. This leads us to the first DP:
DP1: A measurement method for PM outcomes needs to accommodate a probabilistic
phenomenon.
The reliability of equipment can be illustrated through the rate of occurrence of failures
(Murthy et al., 2008), also referred to as the hazard rate (Klutke et al., 2003) or failure rate
(Bennett and Jenney, 1980; Wu and Clements-Croome, 2005), which is a measure of the
probability of the equipment, or a part thereof, failing during a given moment of its lifetime.
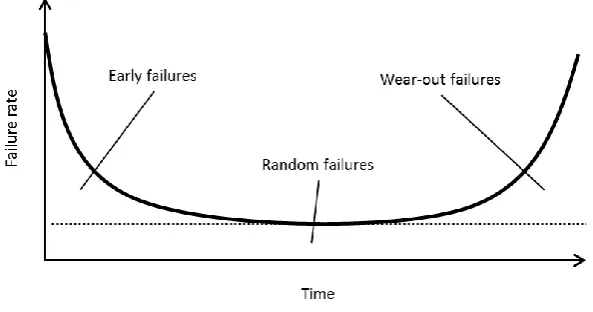
In this paper we use the term failure rate due to its brevity. Klutke et al. (2003) note that
as the bathtub curve (figure 2). Conceptually, the distribution conveys the idea that there are
three distinct phases in the life of equipment (Klutke et al., 2003): first, an “early failure” or
“infant mortality” (burn-in) period, where the failure rate decreases over time; second, a
“random failure” (useful life) period where the failure rate is constant over time; and third, a
[image:16.595.149.446.222.378.2]“wear-out” period, where the failure rate increases over time.
Figure 2. The bathtub curve.
Klutke et al. (2003) question this distribution, especially the part on early failures, and note
that some authors advocate a rollercoaster curve (cf. Wong and Lindstrom, 1988), where the
early failure stage is modelled slightly differently. Without making a case for either of these
early failure conceptualizations, we instead highlight that there are three different failure types.
In reference to types of probabilities, random failures are common-cause failures, while both
early failures and wear-out failures are special-cause failures. Further we note that PM is
primarily intended to prevent wear-out failures (Murthy et al., 2008). From this we can derive
our next DP:
DP2: A measurement method for PM outcomes needs to distinguish special-cause failures
(wear-out & early failures) from common-cause failures (random failures).
Early failures could be caused, for example, by problems with the sub-standard quality of
failures could be caused by (as per definition) random events in the interaction of the
equipment with its environment, for instance the accidental exposure of mechanical parts to
dust and rocks or the temporary over-heating of a bearing. Wear-out failures can be caused by,
for example, increased friction-related damages resulting from insufficient lubrication and
cleaning. While reliability is inherently an attribute of technology, we can expect both the
usage of the technology and the environment in which the technology is used to affect its
reliability profile (Murthy et al., 2008; Tinga, 2010), which leads to the following DP:
DP3: A measurement method for PM outcomes needs to control for technology, usage and
environment variables.
The bathtub conceptualization depicts the failure rate as a function of time, relative to
equipment commissioning, in which PM can be modelled as a reduction of the failure rate
(wear-out failures) (Wu and Clements-Croome, 2005), effectively prolonging the expected
lifetime of the equipment (Murthy et al., 2008). However, we note that there is a
complementary way of modelling PM in terms of reliability improvement, as we are not
explicitly interested in equipment-specific reliability but rather reliability provided as a
service. Here PM is modelled as a reduction in the relative age of the equipment (Doyen and
Gaudoin, 2004; Wu and Clements-Croome, 2005), which implies that time should be viewed
as a relative, rather than absolute, measure (Doyen and Gaudoin, 2004). This leads to the next
DP:
DP4: A measurement method for PM outcomes needs to view time as a relative measure.
Based on these DPs we may now outline the design and function of a performance measure
4.2 Measuring PM outcomes
The service operations management challenge addressed in the empirical study is about the
timing of PM interventions. In other words, maintenance should be performed before the
wear-out phase is initiated (see figure 2) in order to minimize the number of breakdowns.
However, playing it too safe by timing maintenance very early will lead to an excessive
maintenance rate and consequently equipment being under maintenance excessively often. In
other words, equipment availability is maximized when the PM intervention takes place just
before the wear-out phase is initiated. While the task of optimizing maintenance in this
respect seems fairly trivial, it becomes problematic when failures are infrequent (Percy and
Kobbacy, 2000) because this would mean that an empirically based failure-rate distribution
may be unattainable. However, as long as the conditions set by DP3 (the design needs to
control for technology, usage and environment variables) are met, we can aggregate the
failure information of sufficiently homogeneous equipment pools. Provided these equipment
pools are large enough, we ultimately arrive at an empirically-based failure-rate distribution
for the pool of equipment, according to DP1.
When considering DP1 (the design needs to accommodate a probabilistic phenomenon) and
DP2 (the design needs to distinguish special-cause failures from common-cause failures), we
note that there already exists a performance measurement method that satisfies both, namely
SPC (MacCarthy and Wasusri, 2002; Oakland, 2008). However, SPC has its origins in
manufacturing and despite more recent service implementations (cf. MacCarthy and Wasusri,
2002; Thor et al., 2007), we were unable to find previous implementations which would
satisfy DP4 (the design needs to view time as a relative measure). Thus, in devising the design
we need to take SPC a step further, by introducing the relative perspective on time (also
As we are interested in the outcomes of the PM service, we assume that any reduction in the
relative equipment age will take place as a direct result of the equipment being subjected to
maintenance actions. Considering DP4, it is then natural that we measure outcome timings in
relation to the service provision event. Further, as long as the constraints set by DP3 hold, we
can (based on DP1) also aggregate service events. This reduces the population needed for a
viable empirical failure-rate distribution of the maintained equipment pool, which is now
measured relative to the last service event.
However, the introduction of relative time to a measurement method designed for absolute
time creates a problem. As we can expect the length of the aggregated maintenance intervals
to vary, we have a declining population of intervals. In other words, as we are interested in the
occurrence of failures, there will be fewer intervals (where failures – be they common- or
special-cause – may potentially occur) the further away we move from the relative starting
point (the last maintenance action). However, as we are interested in the rate of failures rather
than the absolute number of them, the problem is remedied through incorporating a correction
factor for the distribution of failures (see step 5, below), which compensates for the declining
population of intervals as we move further away from the relative starting point. This also
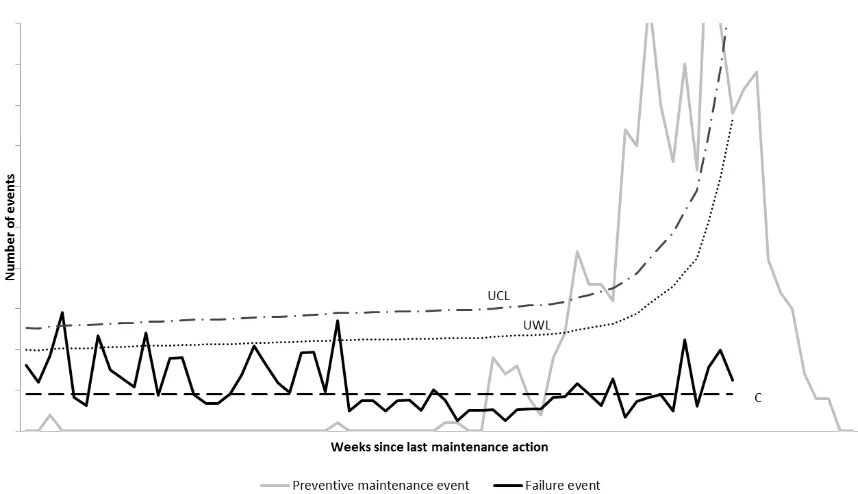
leads to diverging control limits and warning limits in the control chart (figure 3).
The procedure for constructing the measure is outlined in the steps below, and figure 3 offers
a conceptual illustration of the resulting control chart:
1. Extract maintenance intervals from maintenance service data, delimited by
maintenance events.
2. Exclude intervals between service visits if the visits are not for maintenance purposes
3. Group data based on similar technology/usage/environment, creating a pool of similar
equipment.
4. Plot data relative to the maintenance action as the starting point through aggregating
the grouped intervals, so that the control chart displays the number of failure events
(the y-axis) and time since the previous PM event (the x-axis). The number of PM
events can also be plotted (as is done in the measure samples presented in this paper)
as they convey the accuracy of service timing.
5. Scale the absolute number of failures to correspond to the failure rate through
multiplying the absolute number by a correction factor, accounting for the intervals
which have already ended (either by equipment failure or by the next PM visit).
6. Plot the mean value (C), the upper control limit (UCL) and lower control limit (LCL),
the upper warning limit (UWL) and lower warning limit (LWL), and scale the limits
by the correction factor. The warning and control limits can be derived from variations
in the number of failure events at any given time and could be expected to be normally
distributed, implying a warning limit at two standard deviations and a control limit at
Figure 3. Conceptual illustration of the measure.
Based on DP2 we can expect the shape of the resulting failure rate distribution to reveal
whether the failures identify themselves as wear-out failures which were not prevented or as
random failures. In the case of over-maintenance we should observe a constant rate of random
failures and in the case of under-maintenance there should be a rising average failure rate at
the far end of the distribution. Further, if a significant number of maintenance events involve
part replacement, there may also be indications of infant mortality at the beginning of the
failure rate distribution. In other words, we are able to separate between failures which were
unpreventable and failures which can be attributed to failed prevention (i.e. imperfect service
quality).
4.3 Managing PM outcomes
As we are aggregating the maintenance intervals of similar equipment, the measure conveys
the failure behaviour of the pool of equipment being aggregated rather than the failure
pool of equipment, and hence on a fleet level. This means that while the PM timing for
individual pieces of equipment will theoretically be likely to be sub-optimal, on an aggregate
level the timing will be optimized.
The process for managing PM outcomes based on the developed measure consists of the
following three phases:
1. Learn – In this initial phase, failure information is gathered and accumulated over time
and for similar equipment. Collecting more information leads to reduced relative
variance in the failure rate. Once enough information has been gathered (what is
enough should be evaluated on a case-by-case basis), aggregating it and constructing
the designed measure will confirm whether the aggregated pool of equipment is being
under- or over-maintained.
2. Adapt – If the pool of equipment is over-maintained then the PM intervals should be
gradually prolonged (increasing the maintenance frequency) while keeping a close eye
on the evolving failure rate distribution. Once the maintenance intervals have been
sufficiently prolonged, the UWL and UCL will be breached repeatedly, indicating the
first (statistically significant) signs of wear-out failures. At this point we have passed
the optimal interval, and based on the revealed failure rate distribution we can tell
what the optimal interval is and subsequently revert to it. If the pool of equipment is
under-maintained to begin with, then the maintenance interval should be shortened.
However, in this case gradual adjustment is not necessary as the optimal interval
should be visible, based on the initial failure rate.
3. Control – Once the pool of equipment is being maintained at the optimal interval, the
failure rate is monitored for changes in reliability. In cases where reliability growth (cf.
which cannot be controlled through technology-related information), it may be
beneficial to periodically revert to the adapt phase.
5
Empirical demonstration and evaluation of the developed measure
The developed measure was demonstrated and evaluated based on maintenance event records
supplied by the case company. The records consisted of maintenance events and technical
data for 2504 individual pieces of equipment. The data allowed analysis of not only each
model, but also of their main components separately, providing the opportunity to control for
technology. Further, the data also allowed control of the other factors required by DP3
(discussed in the previous section); namely usage and the operational environment.
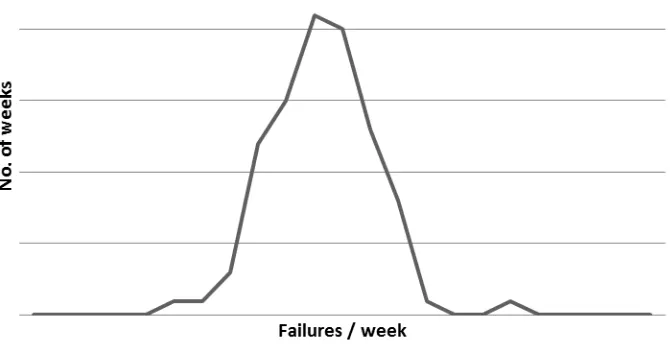
The maintenance events were recorded by the date of occurrence in the data. However, when
constructing the measure, the events and failure rates were converted to events per week
instead of events per day in order to secure non-zero rates. In order to determine the proper
control and warning limits, the weekly failure rates were analysed based on absolute (calendar)
time. As depicted in figure 4, the real weekly failure rate seemed to be normally distributed,
which justified using standard deviations as control and warning limits. With these
specifications, control charts were built for each country, each main-component and the
Figure 4. The observed weekly failure rate that seems normally distributed.
When crafting the charts we noted that the visual clarity of the charts was compromised in the
region where the correction factor grows larger as it is approaching infinity. Due to this we
limited the control charts to >10% of the interval population remaining. This was only done
for improving the visual clarity of the control charts and does not affect the results. While the
correction factor is included in the conceptual illustration of the measure (figure 3), we have
left it out in the result sample charts for reasons of clarity.
Based on the analysis of all the main components, for all three countries, we could see no
clear indication of under-maintenance because there were no signs of wear-out failures in the
graph (see figure 5 for a representative sample). Further, as the failure rate cannot be expected
to rise dramatically in a short period of time, we could safely assume, based on the absence of
wear-out failures and the width of the distribution for the next PM event, that the PM interval
could be prolonged by at least 5–10% without significantly increasing the aggregate failure
rate. Relating this to figure 5, in visual terms, this means that the peak of PM events is moved
5–10% further away from the vertical axis (through gradually prolonging the average
Figure 5. The measured outcomes for a main component.
This finding was supported by interviews conducted with case company key personnel, who
shared a suspicion that the service base was currently being over-maintained, while definitive
proof thereof had been lacking. From an operational perspective the change of maintenance
interval would imply a corresponding reduction in the required service resources for
providing the PM. This is simply because of maintenance being carried out less often. In
practice, however, the potential savings are slightly less, as the same resources typically
provide the corrective maintenance service.
We also found that for one type of main component the PM actions actually seemed to induce
some failures as the failure rate was higher directly after the PM event compared to when
more time had passed (see figure 6). While this was especially evident in one country (figure
6), there were indications of a similar, but weaker, trend in the other countries also. The root
cause for this was not confirmed during the study, but when confronted with these results, the
Figure 6. The measured outcomes for a main component, showing signs of maintenance
induced failures.
Note that in figure 6 the process mean and control limits have been calculated based on the
latter two thirds of the failure rate distribution in order to highlight the falling trend of the
failure rate.
The three embedded cases displayed similar results; however, we also observed some
differences. The varying service base composition and size meant that the pools of equipment
varied in size; however, this did not have a notable impact on the reliability of the measure as
this was compensated for by the time span of the data (i.e. for smaller pools, the data was
available from a longer period). Related to the service base composition, there were some
differences in technology, usage and environment, which were reflected in the rate of random
failures which varied to some extent between countries. A final observation, which can also
be seen when comparing figures 5 and 6, is that there were differences in service timing
accuracy between countries. While this barely affects the measure, a wider distribution of
differences in measurement results between countries were so minute that aggregating data
from different countries would probably be feasible as long as technology, usage and
environment can be controlled.
As something inherent to the design science approach, there also emerged some unexpected
issues with implementation, related to organizational legacy. The first issue was with
established conceptions of performance which were built on maximizing output while
maintaining outcome, resulting in a strong emphasis on resource utilization. In prolonging the
PM intervals, the relative share of PM is reduced while the relative share of corrective
maintenance grows. As PM allows better planning and preparation, a relative reduction in PM
also equates with a reduction in resource utilization. This means that implementing the
measurement method and PM optimization process also has broader implications for how
operational performance should be measured in the case company. The second issue was that
the gradual increase in the maintenance interval suggested by the outcome management
process was not possible to achieve as designed as the case company service scheduling
systems only allowed coarse adjustment. Neither of the issues affected the relevance of the
measurement approach as the prime objective of the design (revealing over-maintenance) was
still met. However, the issues were problematic in the sense that they were not rectifiable
through design iteration during the conducted study. Next we will discuss the results of this
study, along with their significance and limitations.
6
Discussion
While as a method SPC has a long history of development and application (cf. Bersimis et al.,
2007; MacCarthy and Wasusri, 2002; Stoumbos et al., 2000; Thor et al., 2007; William and
Douglas, 1999; Woodall, 2000), we claim this study brings something new to the table (as
conceptual maintenance process, where the data illustrates rates of outcomes – whereas in
most SPC charts each data point represents a single output or outcome. The process here is
conceptual in the sense that several aggregated process instances may occur simultaneously –
that is to say, the same (conceptual) process happens at the same time in different places. The
conceptual process also implies that we use a relative perspective on time (event time) which
allows us to examine the correlation between the maintenance action and the outcome. This
differs clearly from typical SPC approaches that use an absolute perspective on time (clock
time), or another equally ordered and sequential perspective (data-points to the left of a
specific point, per definition, have been generated before the specific point). In our case we
also aggregate several “outcome periods”, which are of different lengths; this is rectified
through a correction factor which consequently leads to diverging control limits.
The typical prior SPC application in manufacturing
The typical prior SPC application in services
The SPC application presented in this
paper Measured
variable(s)
Mainly throughput and output related variables
Mainly throughput and output related variables
An outcome related variable
Measured process
The manufacturer’s production process
The service supplier’s production process
The customer’s production process
Measurement purpose
To identify and remove special-cause failures
To identify and remove special-cause failures
To find the threshold for the emergence of special-cause failures
Measured value
The value potential / embedded value
Co-created value Value-in-use
Perspective on time (cf. Ancona et al., 2001)
Absolute, clock time Absolute, clock time Relative, event time
Type of process
A single manufacturing process in centralized production (a concrete process)
A single service process in centralized
production (a concrete process)
Aggregated similar service process instances in
de-centralized production (a conceptual process)
Object of process control
The control of a single process
The control of a single process
The control of the aggregate process
Control principle
To control input and transformation based on output
To control input and transformation based on output
Table 1. The developed SPC measure compared to previous SPC measures in manufacturing
and services.
In contrast to previous SPC applications, where the measurement is output for the purpose of
controlling the input or transformation, the developed design measures outcomes for the
purpose of controlling output. This means essentially that the developed measure here does
not utilize SPC of the service supplier process but rather SPC of the customer process. This
answers to a call of research to measure value-in-use (Nudurupati et al., 2011), motivated by
the increasing importance of product related services (Lovelock and Gummesson, 2004) and
the transition from product- to service-dominant thinking (Vargo and Lusch, 2004; Vargo et
al., 2008). Further, from a quality control perspective, this application of SPC is not only (or
even primarily) intended to limit the costs incurred by special causes, but rather to limit the
costs incurred by their absence, thus providing a concrete measure for the holistic
measurement of the cost of quality and the identification of over-service or over-maintenance.
The strong theoretical foundation of the developed measure secures a good generalizability,
but it also dictates the limitations. While this general SPC-based measurement method is
basically applicable to any population within the limits of statistical significance, certain
requirements on data availability arise from the reliability theory. Depending on factors
influencing the failure rate, we could expect that applying this measure would require being
able to at least control for technology, equipment usage and environment. However, the
bottom line is that the service information required for the measure is quite simple and could
be expected to be available to any maintenance service provider, providing no decisive
advantage for the servitized original equipment manufacturer (OEM) (cf. Oliva and
Kallenberg, 2003; Ulaga and Reinartz, 2011).
assumption could be criticized as there is bound to be some variation in the skills of the field
technicians. However, as the case company had detailed process descriptions for the
maintenance work, along with a process for monitoring technician performance, we felt this
[image:30.595.71.525.185.444.2]assumption (and simplification) did not threaten the validity of the study.
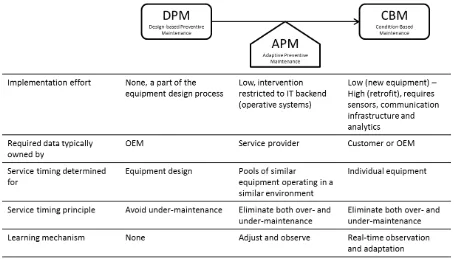
Figure 7. APM in relation to other PM approaches.
The developed SPC-based measure and the process for controlling service timing are intended
for optimizing the relationship between output and outcome. The developed SPC based
measure and control process together form the basis for APM, which essentially complements
the current available options of DPM and CBM (figure 7). While CBM will provide the basis
for the most optimal PM timing, APM provides better results than DPM over time, due to the
control process which serves as a learning mechanism that reduces both over- and
under-maintenance. However, in contrast to APM, CBM cannot be implemented for all maintainable
technologies, and while CBM and APM share the need for an IT backend implementation,
infrastructure for connectivity. While this is hardly a problem for new equipment, it may
become a daunting effort when retrofitting larger, aging service bases.
Based on the benefits of APM relative to DPM (which is less optimal) and CBM (which
requires more effort), we argue that APM may serve as a prerequisite and catalyst when
moving towards more outcome-based contracts (OBCs). APM facilitates the transition
through offering a cost-effective way of improving outcome attributability and
quantifying/reducing outcome uncertainty (Eisenhardt, 1989a; Hypko et al., 2010b). While
OBC-related research tends to focus on where OBCs work, where they do not and why (cf.
Selviaridis and Wynstra, 2014), there is less research on the transition to OBCs, especially
from the supplier’s perspective (Sols and Johannesen, 2013). Considering OBC-related
research, this study contributes by creating a design for performance measurement in the
transition phase. In effect we highlight that outcome attributability and outcome uncertainty
(which are antecedents to OBCs’ success and attractiveness) can be affected by operations
management designs.
From the service suppliers’ perspective, moving towards OBCs implies a redefinition of
service productivity and while service productivity remains a driver for profitability after the
transition, productivity itself is redefined to “inputs per outcome” instead of “inputs per
output”. In other words, efficiency can no longer be measured separately from effectiveness;
changing the focus moves it from productivity to effectiveness (Djellal and Gallouj, 2013).
This issue emerged during the demonstration of the design, as the developed measure was
contrasted against the established way of measuring service performance (resource utilization
and efficacy). Here there is a partial trade-off between the two in the case of
over-maintenance and mutual reinforcement in the case of under-over-maintenance, in other words,
reducing over-maintenance leads to reduced resource utilization, while reducing
despite the established methods of measuring service efficiency, effectiveness has to come
first. A failure to appreciate this may lead to excess service in order to maintain high resource
utilization, a similar but reversed phenomenon to the one described by Oliva and Sterman
(2001).
7
Conclusions
In this paper we develop and describe a measure for managing PM service outcomes. The
measure is founded on reliability theory and based on identifying special-cause failures (early
and wear-out failures) amongst common-cause failures (random failures). The theoretical
foundation implies that SPC is well suited for measuring PM service outcomes as SPC was
originally developed to separate common- and special-cause failures. However, in contrast to
many of the earlier applications of SPC, this measurement approach explicitly seeks to find
the borderline where special-cause failures start to emerge. Thus, this approach not only seeks
to eliminate under-service but also over-service, making it a suitable tool for the optimization
of the total costs of quality.
The developed measure was tested in an empirical setting of three embedded cases where we
found no indication of wear-out failures, and consequently we were able to conclude that the
service provider could prolong their maintenance intervals by at least 5–10% on average.
Further, we found evidence of maintenance induced failures, which means that in these
situations prolonging the maintenance intervals would not only lead to sustained but also
improved levels of service quality.
Considering the measure’s impact on service operations, we have argued that being able to
quantify outcome uncertainty and to attribute service outcomes to service actions through the
presented measure is a precondition for moving into deeper relationship-based services with
supplier, also requires a change in the service operations management approach as a fleet
perspective on service quality is introduced. The fleet perspective provides the basis for
distributing risk among customers and, as presented in this paper, also serves as a basis for
optimization of service provision. Further, the use of established service operations
management KPIs, such as resource utilization, were discussed in the sense that measuring
inputs, outputs and outcomes separately may, in the studied context, lead to providing
services in excess.
The measure was founded on reliability theory, which provides a good basis for generalizing
it, but we noted that information availability may limit applicability. Further, we noted that
while remote-monitoring-enabled CBM essentially accomplishes the same objective as the
measure (through eliminating over-maintenance), remote monitoring is more costly to
implement (especially with old equipment) and is typically only applied for the most critical
parts in equipment. Thus these two approaches for eliminating over-maintenance are
essentially complementary.
Further research should be conducted in order to test the measure in different contexts within
the limits of its generalizability. This research could be expected to reveal further context
dependent mechanisms which may limit the applicability of the measure. Additionally, other
service contexts where the outcomes are not clearly attributable to the service actions would
probably be interesting contexts in which to apply the relative measurement approach
presented here. Also other contexts where the services may be of a preventive and reoccurring
nature (such as in health care and social services) are naturally interesting considering the
Acknowledgements
This research was conducted in the Future Industrial Services (FutIS) research programme,
managed by the Finnish Metals and Engineering Competence Cluster (FIMECC), and funded
by the Finnish Funding Agency for Technology and Innovation (TEKES), research institutes
and companies. Their support is gratefully acknowledged.
References
Van Aken, J.E. (2004), “Management Research Based on the Paradigm of the Design
Sciences: The Quest for Field-Tested and Grounded Technological Rules”, Journal of
Management Studies, Vol. 41 No. 2, pp. 219–246.
Ancona, D.G., Okhuysen, G.A. and Perlow, L.A. (2001), “Taking Time to Integrate Temporal
Research”, The Academy of Management Review, Vol. 26 No. 4, p. 512.
Baines, T.S., Lightfoot, H., Peppard, J., Johnson, M., Tiwari, A., Shehab, E. and Swink, M.
(2009), “Towards an operations strategy for product-centric servitization”, International
Journal of Operations & Production Management, Vol. 29 No. 5, pp. 494–519.
Bennett, D. and Jenney, B. (1980), “Reliability: Its implications in production systems
design”, Omega, Vol. 8 No. 4, pp. 433–440.
Bersimis, S., Psarakis, S. and Panaretos, J. (2007), “Multivariate statistical process control
charts: an overview”, Quality and Reliability Engineering International, Vol. 23 No. 5,
pp. 517–543.
Brax, S.A. (2005), “A manufacturer becoming service provider – challenges and a paradox”,
Brown, M.G. (1996), Keeping Score – Using the Right Metrics to Drive World-Class
Performance, Kraus Organization Limited, New York.
Chan, L.-Y. and Wu, S. (2009), “Optimal design for inspection and maintenance policy based
on the CCC chart”, Computers & Industrial Engineering, Elsevier Ltd, Vol. 57 No. 3,
pp. 667–676.
Denyer, D., Tranfield, D. and van Aken, J.E. (2008), “Developing Design Propositions
through Research Synthesis”, Organization Studies, Vol. 29 No. 3, pp. 393–413.
Djellal, F. and Gallouj, F. (2013), “The productivity challenge in services: measurement and
strategic perspectives”, The Service Industries Journal, Vol. 33 No. 3-4, pp. 282–299.
Doyen, L. and Gaudoin, O. (2004), “Classes of imperfect repair models based on reduction of
failure intensity or virtual age”, Reliability Engineering and System Safety, Vol. 84 No.
1, pp. 45–56.
Duffuaa, S.O. and Ben-Daya, M. (1995), “Improving maintenance quality using SPC tools”,
Journal of Quality in Maintenance Engineering, Vol. 1 No. 2, pp. 25–33.
Eisenhardt, K.M. (1989a), “Agency Theory: An Assessment and Review”, Academy of
Management Review, Vol. 14 No. 1, pp. 57–74.
Eisenhardt, K.M. (1989b), “Building theories from case study research”, Academy of
Management Review, Vol. 14 No. 4, pp. 532–550.
Eisenhardt, K.M. and Graebner, M.E. (2007), “Theory Building From Cases: Opportunities
Gregor, S. and Jones, D. (2007), “The Anatomy of a Design Theory”, Journal of the
Association of Information Systems, Vol. 8 No. 5, pp. 312–335.
Grönroos, C. (2000), Service Management and Marketing – A Customer Relationship
Management Approach, John Wiley & Sons, Ltd., Chichester, 2nded.
Holmström, J., Ketokivi, M. and Hameri, A.-P. (2009), “Bridging practice and theory: a
design science approach”, Decision Sciences, Wiley Online Library, Vol. 40 No. 1, pp.
65–87.
Hypko, P., Tilebein, M. and Gleich, R. (2010a), “Benefits and uncertainties of
performance-based contracting in manufacturing industries: An agency theory perspective”, Journal of
Service Management, Vol. 21 No. 4, pp. 460–489.
Hypko, P., Tilebein, M. and Gleich, R. (2010b), “Clarifying the concept of
performance-based contracting in manufacturing industries: A research synthesis”, Journal of Service
Management, Vol. 21 No. 5, pp. 625–655.
Jacob, J.K. and Sreejith, P.S. (2008), “Process control using reliability based control charts”,
Journal of Achievements in Materials and Manufacturing Engineering, Vol. 31 No. 2,
pp. 498–504.
Johnsen, T., Howard, M. and Miemczyk, J. (2009), “UK defence change and the impact on
supply relationships”, Supply Chain Management: An International Journal, Vol. 14 No.
4, pp. 270–279.
Kaplan, R.S. and Norton, D.P. (1992), “The balanced scorecard - Measures that drive
Klutke, G., Kiessler, P.C. and Wortman, M.A. (2003), “A critical look at the bathtub curve”,
IEEE Transactions on Reliability, Vol. 52 No. 1, pp. 125–129.
Lillrank, P. and Liukko, M. (2004), “Standard, routine and non-routine processes in health
care.”, International Journal of Health Care Quality Assurance, Vol. 17 No. 1, pp. 39–
46.
Lovelock, C. and Gummesson, E. (2004), “Whither Services Marketing? : In Search of a New
Paradigm and Fresh Perspectives”, Journal of Service Research, Vol. 7 No. 1, pp. 20–41.
MacCarthy, B.L. and Wasusri, T. (2002), “A review of non-standard applications of statistical
process control (SPC) charts”, International Journal of Quality & Reliability
Management, Vol. 19 No. 3, pp. 295–320.
Mason, B. and Antony, J. (2000), “Statistical process control: an essential ingredient for
improving service and manufacuring quality”, Managing Service Quality, Vol. 10 No. 4,
pp. 233–238.
Mefford, R.N. (1993), “Improving service quality: Learning from manufacturing”,
International Journal of Production Economics, Vol. 30-31 No. Special Issue
Proceeding of the Seventh International Working Seminar on Production Economics, pp.
399–413.
Meth, M.A. (1992), “Reliability-growth myths and methodologies: a critical view”, Annual
Reliability and Maintainability Symposium 1992 Proceedings,
doi:10.1109/ARMS.1992.187846.
Neely, A., Gregory, M. and Platts, K. (1995), “Performance measurement system design: a
literature review and research agenda”, International Journal of Operations &
Production Management, Vol. 15 No. 4, pp. 80–116.
Neely, A., Mills, J., Platts, K., Richards, H., Gregory, M., Bourne, M. and Kennerley, M.
(2000), “Performance measurement system design: developing and testing a
process-based approach”, International Journal of Operations & Production Management, Vol.
20 No. 10, pp. 1119–1145.
Ng, I.C.L., Maull, R. and Yip, N. (2009), “Outcome-based contracts as a driver for systems
thinking and service-dominant logic in service science: Evidence from the defence
industry”, European Management Journal, Elsevier Ltd, Vol. 27 No. 6, pp. 377–387.
Nudurupati, S.S., Bititci, U.S., Kumar, V. and Chan, F.T.S. (2011), “State of the art literature
review on performance measurement”, Computers & Industrial Engineering, Elsevier
Ltd, Vol. 60 No. 2, pp. 279–290.
Oakland, J. (2008), Statistical Process Control, Elsevier, Oxford, 6thed.
Oliva, R. and Kallenberg, R. (2003), “Managing the transition from products to services”,
International Journal of Service Industry Management, Vol. 14 No. 2, pp. 160–172.
Oliva, R. and Sterman, J.D. (2001), “Cutting corners and working overtime: Quality erosion
in the service industry”, Management Science, Vol. 47 No. 7, pp. 894–914.
Panagiotidou, S. and Nenes, G. (2009), “An economically designed, integrated quality and
maintenance model using an adaptive Shewhart chart”, Reliability Engineering & System