Original citation:
Vance, Keith W., Woodcock, Dan J., Reid, John E., Bretschneider, Till, Ott, Sascha and
Koentges, Georgy. (2015) Conserved cis-regulatory modules control robustness in Msx1
expression at single-cell resolution. Genome Biology and Evolution, 7 (9). pp.
2762-2778.
Permanent WRAP url:
http://wrap.warwick.ac.uk/74349
Copyright and reuse:
The Warwick Research Archive Portal (WRAP) makes this work of researchers of the
University of Warwick available open access under the following conditions.
This article is made available under the Creative Commons Attribution 4.0 International
license (CC BY 4.0) and may be reused according to the conditions of the license. For
more details see:
http://creativecommons.org/licenses/by/4.0/
A note on versions:
The version presented in WRAP is the published version, or, version of record, and may
be cited as it appears here.
Conserved
Cis
-Regulatory Modules Control Robustness in
Msx1
Expression at Single-Cell Resolution
Keith W. Vance
1,2,3,*
,y, Dan J. Woodcock
2,y, John E. Reid
4, Till Bretschneider
2, Sascha Ott
2, and
Georgy Koentges
3,*
1Department of Biology and Biochemistry, University of Bath, United Kingdom
2Warwick Systems Biology Centre, University of Warwick, Coventry, United Kingdom
3
School of Life Sciences, University of Warwick, Coventry, United Kingdom
4
MRC Biostatistics Unit, Robinson Way, Cambridge, United Kingdom
*Corresponding author: E-mail: [email protected]; [email protected]. y
These authors contributed equally to this work.
Accepted:August 30, 2015
Abstract
The process of transcription is highly stochastic leading to cell-to-cell variations and noise in gene expression levels. However, key essential genes have to be precisely expressed at the correct amount and time to ensure proper cellular development and function. Studies in yeast and bacterial systems have shown that gene expression noise decreases as mean expression levels increase, a rela-tionship that is controlled by promoter DNA sequence. However, the function of distalcis-regulatory modules (CRMs), an evolutionary novelty of metazoans, in controlling transcriptional robustness and variability is poorly understood. In this study, we used live cell imaging of transfected reporters combined with a mathematical modelling and statistical inference scheme to quantify the function of conservedMsx1CRMs and promoters in modulating single-cell real-time transcription rates in C2C12 mouse myoblasts. The results show that the mean expression–noise relationship is solely promoter controlled for this key pluripotency regulator. In addition, we demonstrate that CRMs modulate single-cell basal promoter rate distributions in a graded manner across a population of cells. This extends the rheostatic model of CRM action to provide a more detailed understanding of CRM function at single-cell resolution. We also identify a novel CRM transcriptional filter function that acts to reduce intracellular variability in transcription rates and show that this can be phylogenetically separable from rate modulating CRM activities. These results are important for understanding how the expression of key vertebrate developmental transcription factors is precisely controlled both within and between individual cells. Key words:single-cell transcription,cis-regulatory module,Msx1, promoter, robustness.
Introduction
Transcription is a fundamentally stochastic process that occurs discontinuously in bursts in single cells as described by random
telegraph models of gene expression (Paulsson 2005;Raser
and O’Shea 2005;Cai et al. 2006;Raj et al. 2006;Pedraza and Paulsson 2008;Suter et al. 2011). Experiments in microbial
systems and inDrosophilahave revealed that stochasticity in
gene expression can be actively used to generate cellular
di-versity of adaptive value in large cell populations (Samoilov
et al. 2006;Wernet et al. 2006), whereas in vertebrates cell-to-cell variations in the expression of key developmental reg-ulators in progenitor cells have been shown to drive cell fate
choices during lineage differentiation (Chang et al. 2008;Raj
and van Oudenaarden 2008). Comparative embryology and
developmental genetics, on the other hand, have revealed that transcription factor and signaling networks are expressed and deployed in a highly stereotypic and exquisitely precise spatiotemporal fashion during development. Furthermore, studies in yeast have shown that the expression of essential, haplo-insufficient genes is controlled in a more precise manner when compared with nonessential genes, such as those in-volved in the stress response, and that noise in the expression of these dose-dependent genes appears to have been reduced by natural selection to prevent deleterious stochastic variations (Newman et al. 2006;Batada and Hurst 2007;Lehner 2008). Random fluctuations in gene expression are therefore subject to regulation and can be either beneficial or deleterious for cell
GBE
ßThe Author(s) 2015. Published by Oxford University Press on behalf of the Society for Molecular Biology and Evolution.
This is an Open Access article distributed under the terms of the Creative Commons Attribution License (http://creativecommons.org/licenses/by/4.0/), which permits unrestricted reuse,
distribution, and reproduction in any medium, provided the original work is properly cited.
at University of Warwick on December 11, 2015
http://gbe.oxfordjournals.org/
function depending on the type of gene and biological process.
Noise and robustness in gene expression can be controlled at a number of different levels. A large number of studies in yeast and bacteria have demonstrated that noise in gene expression decreases as mean expression levels increase (Bar-Even et al. 2006;Newman et al. 2006), and that pro-moter sequence, length and chromatin structure are all
major determinants of this relationship (Tirosh and Barkai
2008;Hornung et al. 2012;Carey et al. 2013). In addition, random fluctuations in gene expression can be buffered at
both the RNA and protein levels (Raser and O’Shea 2005;
Pedraza and Paulsson 2008; Barriere et al. 2011), whereas
signaling pathways such as Wnt have been proposed to
filter out and reduce transcriptional noise (Arias and
Hayward 2006). Moreover, transcription factors do not func-tion in isolafunc-tion but work in a highly coordinated manner within gene regulatory networks (GRNs) and particular net-work motifs, for example, feed-forward or feedback loops, have been shown to buffer out fluctuations in gene expression (Barkai and Leibler 1997;Alon et al. 1999;Mangan and Alon 2003;Macneil and Walhout 2011).
Within GRNs key transcription factors interact with DNA
sequence elements called cis-regulatory modules (CRMs),
such as transcriptional enhancers and silencers, and pro-moters, to control the expression of large numbers of target
genes (Jeziorska et al. 2009). Communication between CRMs
and their target promoters is a key metazoan novelty in tran-scriptional control. CRMs may be predicted to play an impor-tant role controlling transcriptional noise as, for example,
shadow enhancers in Drosophilahave been shown to
pro-mote gene expression robustness in response to various
stimuli (Boettiger and Levine 2009; Frankel et al. 2011).
However, the full dynamic scope of CRM function beyond spatiotemporal control is still to be determined as the majority of studies investigating the control of transcriptional noise at single-cell resolution have been performed in bacteria and yeast. As such, the involvement of CRMs in regulating
tran-scriptional variability has not been well explored (Macneil and
Walhout 2011).
In this study, we used live cell imaging of transfected reporters and mathematical modeling to quantify the function
of mouse–fugu conservedMsx1CRMs and promoters in
reg-ulating single-cell transcription rates in real time in C2C12 mouse mesenchymal cells. We predicted that variability in
the expression ofMsx1would be finely controlled as Msx1
is an important regulator of pluripotency in mesenchymal stem cells, acting at a key node in a GRN, to control proximo-distal branchial arch patterning and craniofacial and dorsal
CNS development (Satokata and Maas 1994; Odelberg
et al. 2000;Hu et al. 2008). Also, the spatial and temporal
expression ofMsx1is highly conserved across vertebrates and
appears to show an ON/OFF behavior akin to ultrasensitivity (Hu et al. 2008). Our results showed that the negative
correlation between transcriptional noise and mean expres-sion is not determined by distal CRMs but is solely promoter
derived for vertebrateMsx1. We found thatMsx1CRMs
func-tion to modulate single-cell basal promoter rate distribufunc-tions in a graded manner across a population of cells. This further refines the rheostatic model of CRM action, proposed on the basis of single time point reporter measurements, to provide a more detailed understanding of CRM function. Unexpectedly, our results also identified a novel CRM transcriptional filter, or robustness control, function that acts to reduce intracellular variability in transcription rates. By combining promoters with homologous mouse–fugu CRMs, we identified examples of conservation and divergence in CRM function and showed that CRM robustness control can be phylogenetically separa-ble from rate modulating CRM activities. These results are important for understanding how the expression of key de-velopmental regulators is finely controlled, which in principle will also have important ramifications for synthetic biology and gene therapy.
Materials and Methods
Plasmid Construction
The pGL3-vGFP3xnls Venus fluorescent protein reporter plas-mid used as a backbone for all species-specific CRM-promoter reporter constructs was cloned as follows: Recombinant poly-merase chain reaction (PCR) was performed to insert a triple
nuclear localization sequence in frame at the 30-end of the
Venus gene from pCS2Venus. This generated a vGFP3xnls
fragment flanked by NcoI–XbaI sites. The luciferase gene
from pGL3-BASIC (Promega) was then excised as anNcoI–
XbaI fragment and replaced with vGFP3xnls. Species-specific
CRM-promoter hybrid fluorescent reporters were then
gener-ated as follows: The mouse and fuguMsx1promoter regions
were PCR cloned asHindIII fragments from genomic DNA and
inserted into pGL3-vGFP3xnls. The SV40 promoter was PCR
amplified as a HindIII fragment from pGL3-PRO (Promega)
and cloned into pGL3-Venus. Individual species-specific
CRMs were then PCR amplified as XmaI–BglII fragments
from genomic DNA and cloned upstream of the respective promoter Venus reporters. The fidelity of all reporter constructs was verified by sequencing. The oligonucleotides
used are shown insupplementary table S1, Supplementary
Materialonline.
Cell Culture
C2C12 myoblast cells were grown in Dulbecco’s modified Eagle’s medium supplemented with 10% fetal bovine serum (FBS) (Growth Medium [GM]).
Flow Cytometry
Flow cytometry-based measurement of reporter activity was
performed as described inJeziorska et al. (2012). 2105cells
CRMs and Robustness inMsx1
GBE
at University of Warwick on December 11, 2015
http://gbe.oxfordjournals.org/
per well were seeded in six-well plates. The next day cells were
transfected with 1mg of pGL3-vGFP3xnls reporter plasmid and
250 ng pCMV-mCherry expression vector using lipofectamine 2000 (Invitrogen). pCMV-mCherry contains the cytomegalo-virus promoter driving the expression of a mCherry reporter and was used to control for transfection efficiency. After 42–46 h cells were washed twice with phosphate-buffered saline (PBS), trypsinized, and harvested in 1 ml GM. GM was removed, cells were then washed twice with PBS,
resus-pended in 800ml Cell Fix (BD Biosciences), and incubated
over-night at 4C in the dark. To activatewntsignaling, 40 mM LiCl
was added to each well 20 h after transfection.
To measure MSX1 protein levels, cells were pelleted, washed with PBS, and then permeabilized using 0.1% Triton X-100 in PBS for 15 min at room temperature. Cells were subsequently washed with PBS and blocked using 20% FBS in PBS for 1 h at room temperature. Cells were
then incubated overnight at 4C with 1:200 dilution
anti-Msx1 (Clone 4FII; Abcam) mouse monoclonal antibody, washed three times with 5% FBS in PBS, and incubated for 1 h with 1:200 dilution goat mouse AlexaFluor647 anti-body (Invitrogen). Cells were washed again with PBS,
resus-pended in 500ml Cell Fix, and analyzed on a BD Influx Cell
Sorter. Venus was excited using the blue laser (488 nm) and measured with the 530/40 bandpass (BP) filter set, mCherry was excited using the yellow laser (561 nm) and measured using the 593/40 BP filter whereas Alexa647 was excited with the red laser (642) and measured using the 670/30 BP filter set.
Real-Time Imaging
1.25104 cells per well were seeded in 0.17-mm glass
bottom 96-well plates (MatriCal). The next day cells were treated with Hoechst 33342 (Invitrogen) to label individual nuclei. To do this, GM was removed, cells were washed twice with PBS, and then incubated with 400 ng/ml Hoechst
in GM at 37C for 30 min. Cells were then washed twice with
PBS and GM without phenol red was added back to the well. Cells were then transfected with 200 ng reporter plasmid using Lipofectamine 2000 (Invitrogen) according to the man-ufacturer’s instructions. The 96-well plate was subsequently transferred to a Cellomics KineticScan KSR machine. The KSR contains a humidified incubator, an inverted fluorescent Zeiss microscope with a high resolution CCD camera, and an inte-grated computer system. Real-time images were generated
with a 10magnification, 0.4 numerical aperture objective
using both the Hoechst and GFP filter sets. The Hoechst chan-nel was used to focus and we acquired images every 30 min for 48 h. Cells were segmented, tracked, and fluorescence levels extracted using custom software. The autofluorescence GFP value of an untransfected cell reached a maximum of 7,000 units. To remove background, we set a preselection threshold value of 8,000 fluorescent units in the GFP channel
and measured the response profiles for cells which have at least ten measurement points above this value. We synchro-nized fluorescence response profiles in silico to the point of cell division as determined by a rise and then postmitotic drop in Hoechst staining. This enabled us to restrict fluorescent repor-ter measurements to individual cell generations. We previously calculated that 15 or more cells per experiment were required
for robust transcription rate estimates (Woodcock et al. 2013)
and therefore randomly selected 30–35 fluorescent onset curves for each reporter construct.
Extraction of Single-Cell Fluorescence Time-Course Data
Segmentation based on the nuclear stain (Hoechst) was per-formed using standard routines built into KineticScan V2.2.0.1 (BUILD 27) software (Thermo Scientific) and data were exported to a Microsoft Access database. For subsequent tracking we extracted cell positions and fluorescence intensi-ties using custom plugins for ImageJ software (http://rsb.info. nih.gov/ij) employing Jackcess, a java library for reading from and writing to Access databases (http://jackcess.sourceforge. net/). We have developed novel routines for cell tracking writ-ten in C based on a statistical scoring algorithm which
accounts for dense cell cultures at 10or 20resolution
and significant movement, that is, translocation of more
than a cell diameter between subsequent frames.
Confidence scores are computed taking into account dis-tances to neighboring cells, extent of cell movement, and alternative cell-to-cell assignments. We have been able to au-tomatically define up to two cell divisions in one time-course by using variations in Hoechst staining intensity between cells and a characteristic drop in Hoechst intensity after cell division.
The software is described inDowney et al. (2011). Single-cell
trajectories for all Msx1 promoter containing reporters are
shown insupplementary figure S1,Supplementary Material
online.
Computational Genomics
We implemented a computational approach analogous to the
one described in Picot et al. (2010) to identify conserved
regions.
Hierarchical Model of Transcriptional Dynamics
The model is described in detail inWoodcock et al. (2013).
This method incorporates both intrinsic and extrinsic noise into
the estimation (Finkenstadt et al. 2013) and has been used to
enable estimation of transcription rates when the plasmid
copy number is unknown (Woodcock et al. 2013). It consists
of two layers: The single-cell layer and the population layer. The single-cell layer takes the form of a pair of stochastic dif-ferential equations describing how the mRNA and protein level change in time, and an equation which describes the measurement process. These equations are
Vance et al.
GBE
at University of Warwick on December 11, 2015
http://gbe.oxfordjournals.org/
dMðtÞ ¼ðctðtÞ dMMðtÞÞdtþ
ffiffiffiffiffiffiffiffiffiffiffiffiffiffiffiffiffiffiffiffiffiffiffiffiffiffiffiffiffiffiffi
ctðtÞ dMMðtÞ
p
dWðtÞ;
dPðtÞ ¼ðaMðtÞ dPPðtÞÞdtþ
ffiffiffiffiffiffiffiffiffiffiffiffiffiffiffiffiffiffiffiffiffiffiffiffiffiffiffiffiffiffi aMðtÞ dPPðtÞ
p
dWðtÞ;
FðtÞ ¼kPðtÞ þ"s2;
wherecis the copy number;(t) is the transcription rate at
time t; dM and dP are the mRNA and protein degradation
rates, respectively;ais the translation rate;kis the measured
fluorescence per protein; and"s2is normally distributed
mea-surement noise, with variance2.M(t),P(t) andF(t) are,
re-spectively, the mRNA, protein and fluorescence levels at timet
anddW(t) denotes a Weiner process. In this model,(t) can
take one of two values depending if the gene is actively
tran-scribing, namely0when transcription is only occurring at a
basal level and1in the active state. We also need to estimate
the time when transcription changes between these states,
which we refer to as the switch time,T. These equations
cap-ture the difficulty in estimating transcription rate when the copy number is unknown, as their respective parameters only appear as a product and so they would not normally be identifiable in a conventional estimation procedure. This is because the estimated values could trade-off against one another, meaning there would be an infinite number
of possible combinations of (t) and c that would be
equally valid.
In conventional parameter estimation methods, each es-timate for each cell in the sample would be undertaken sep-arately and the results then amalgamated and analyzed as a
group. In our estimation scheme, we followFinkenstadt et al.
(2013)and make the assumption that each individual rate, and therefore each parameter, comes from a distribution over the population. Collectively, these distributions are referred to as the population layer. These are then estimated concurrently with the parameters for all of the time series simultaneously. To do this, we employ a Markov chain Monte Carlo (MCMC) estimation procedure which is
high-lighted in figure 2. This involves iteratively updating the
parameter and distribution estimates by evaluating their abil-ity to describe the data using a likelihood function derived from the single-cell layer and the probability density func-tions comprising the population layer. As such, the parame-ter estimates feed into the population distribution estimates, which themselves feed into the parameter estimates and so on. This cyclical information transfer allows a parameter es-timate to “borrow strength” from the other eses-timates of the same parameter, leading to a more robust estimation (Finkenstadt et al. 2013).
It is this principle that we exploit to tease apart the copy number and transcription rate. Crucially, if we assume a dis-tribution over the transcription rate as well as a disdis-tribution
over the copy number then this constrains the estimates ofc
and(t) to be similar to those of the rest of the population;
the degree of similarity is encapsulated in the population
distributions. There are still an infinite number of possible combinations, but because of the population layer we can now assign a probability to these and so as the MCMC pro-cedure iteratively updates the parameter estimates, they will begin to coalesce into their respective distributions. As this continues, the distributions become tighter and so the number of viable combinations diminishes. Eventually the estimates converge on the parameter values which best ex-plain the data, while accounting for the similarity constraints imposed by their respective distributions.
One caveat in this approach is that the transcription rate and copy number values the MCMC method will estimate will be somewhat arbitrary as there is no way of discerning the correct absolute value for either parameter. However, as there is no reason to think that the distribution of plasmid copies entering the cell would be different between the different constructs, we can assume the same copy number distribution for each of the constructs. This means that if we estimate the distributions and parameter estimates for the entire data set at the same time, all of the transcription rates in each of the constructs will be estimated relative to the same copy number distribution. This will still not allow us to estimate the absolute transcription rate values, but they are estimated proportional to the same copy number distribution and so can be compared with each other.
Results
Msx1 Promoter and Comparative CRM Identification
We recently developed and validated a new measurement and mathematical modeling pipeline to estimate copy number-independent single-cell transcription rates using
tran-siently transfected fluorescent reporter time courses (Downey
et al. 2011;Woodcock et al. 2013). We now extend this pipe-line to analyze the function of individual CRMs and promoters
in controlling variability and robustness inMsx1expression in
real time in C2C12 mesenchymal cells. TheMsx1gene has a
relatively simple cis-regulatory organization as a 5-kb DNA
genomic fragment located immediately upstream of mouse
Msx1can fully replicate endogenousMsx1expression in
trans-genic mice (MacKenzie et al. 1997). Using computational
genomics, we identified four putative CRMs within this region, similar to the blocks of sequence conservation
discov-ered byMiller et al. (2007),that are conserved in position and
sequence between mouse and fugu (fig. 1A). Furthermore,
we identified only one copy of Msx1 in teleosts with a
complete complement of CRMs homologous to those in mammals despite a separate round of whole-genome
dupli-cations within actinopterygians (see supplementary text,
Supplementary Materialonline). Among these CRMs, mouse CRMB and D have previously been identified as limb bud and
branchial arch enhancers (MacKenzie et al. 1997), whereas
CRMA and C are uncharacterized. The mouseMsx1minimal
CRMs and Robustness inMsx1
GBE
at University of Warwick on December 11, 2015
http://gbe.oxfordjournals.org/
FIG. 1.—Msx1CRM and promoter identification. (A) Genomic organization of potential CRMs and promoters for mouse, human, chicken, and fugu
Msx1based on sequence conservation. The fuguMsx1ortholog displays a similar configuration to that of other vertebrates. Colored boxes indicate putative regulatory regions, numbers represent percent sequence similarity to mouse. (B) Experimental and computational pipeline for fuguMsx1basal promoter identification. A conserved transcription factor promoter binding site configuration is displayed. (C) Single- and hybrid-speciesMsx1CRM-promoter reporter
Vance et al.
GBE
(continued)
at University of Warwick on December 11, 2015
http://gbe.oxfordjournals.org/
promoter has previously been defined in transgenic mice and
C2C12 cells in culture (Takahashi et al. 1997) and we used a
custom discovery tool (Granier et al. 2011; Jeziorska et al.
2012) (see alsosupplementary text,Supplementary Material
online) to identify the orthologous promoter region in fugu on the basis of a conserved transcription factor binding site con-figuration (fig. 1B).
Quantitative Validation of a Reporter Assay for Studying Msx1Promoter–CRM Communication
Msx1 spatiotemporal expression is highly conserved
across vertebrates. However, branchial arches develop faster and morphogenetic fields are much smaller in tel-eosts than in mouse. This similarity and difference pro-vide an attractive biological rationale for a quantitative functional comparison of homologous promoter and
CRMs from mouse and fuguMsx1. To do this, we first
tested our experimental system using flow cytometry to compare the activity of transfected mouse and fugu pro-moters with endogenous MSX1 protein levels in mouse C2C12 mesenchymal cells, an established cell line to
studyMsx1transcriptional control and its associated
reg-ulatory functions (Takahashi et al. 1997; Shetty et al.
1999; Lee et al. 2004; Wang et al. 2011; Wang and Abate-Shen 2012). This revealed that mouse basal
Msx1promoter activity is higher compared with that of
the homologous fugu promoter region (fig. 1D). We then
treated cells with LiCl to activate thewntsignaling
path-way, asMsx1is a knownwnttarget (Willert et al. 2002;
Miller et al. 2007), and observed a 1.6-fold mean
in-crease in endogenous MSX1 (fig. 1E) and a concomitant
increase of 1.6-fold for the transfected fugu and 1.8-fold
for the mouse promoter constructs (fig. 1D) in response
to LiCl. This is within the expected range of responses to
Wntsignaling described previously generically as well as
for Msx1 (Willert et al. 2002; Goentoro and Kirschner
2009) suggesting that transient transfection does not
bias the quantitative output significantly in our system. Furthermore, the conservation of quantitative responses
among orthologousMsx1 promoters to the same input
confirms our selection of the correct fuguMsx1promoter
region.
Estimation of Real-Time Single-Cell Transcription Rates Using Live Cell Imaging and Mathematical Modeling
To estimate copy number-independent transcription rates, we transiently transfected C2C12 cells with reporter constructs containing both inter- and same-species CRM and promoter
Msx1components (fig. 1C) and performed live cell imaging to
generate fluorescent onset curves for approximately 30–35 randomly picked cells for each construct (supplementary fig. S1,Supplementary Materialonline). We used a nuclear local-ized Venus fluorescent protein reporter in an effort to restrict measurement errors caused by cell size- or shape-dependent variations. We truncated the trajectories of the time courses when the maximum fluorescence was reached as our previous work showed that reporter signal is diluted and distributed
equally into daughter cells after cell division (Downey et al.
2011). This enabled us to restrict fluorescent measurements to
a single-cell cycle (fig. 1F) and minimize inaccuracies in
tran-scription rate estimations caused by nuclear envelope break-down and segregation of reporter plasmids after division.
We estimated the parameters of our hierarchical model of transcriptional dynamics for single cells across all constructs using our previously described methodology developed in
Woodcock et al. (2013). This inference scheme allows the estimation of all the rates in a population of cells simulta-neously, which enables population information to be used in the single-cell inference and vice versa. Cyclical information transfer between the population and single cell levels guides the inference toward combinations of rates which are consis-tent with the rest of the population, allowing us to distinguish between the contribution of plasmid copy number and tran-scription rate to overall expression levels in a population of
cells containing variable plasmid copy number (fig. 2A).
Although we do not identify absolute values for the per-copy transcription rate, we are able to estimate the ratio of the per-copy transcription rate between different constructs and cells. Moreover, we have shown using synthetic data that the value of the plasmid copy number has no effect on the ability of the algorithm to correctly estimate transcription rates (Woodcock et al. 2013). The model can thus explain, for ex-ample, divergent fluorescent trajectories between two cells of
the same experiment (fig. 2B, left) as a result of copy number
(fig. 2B, center) rather than transcription rates (fig. 2B, right).
FIG. 1.—Continued
constructs. (D) MouseMsx1basal promoter has a higher activity than the orthologous fugu region. (E) Endogenous MSX1 and both the mouse and fugu
Msx1promoter reporters (shown in D) respond similarly at the quantitative level to the same exogenous stimulus. After transfection C2C12 cells were grown for 20 h and then incubated for a further 24 h with or without 40 mM LiCl. Flow cytometry was used to measure endogenous MSX1 protein and reporter fluorescence in 10,000 cells. AverageMsx1promoter reporter fluorescence was background corrected, then normalized to the activity of a cotransfected CMV-mCherry reporter construct in each cell. (F) Simultaneous acquisition of fluorescent reporter and Hoechst intensity time course measurements. The SV40 Pro-vGFP reporter construct was transfected into Hoechst labeled C2C12 cells. Images were acquired at 30-min intervals after transfection and fluorescent and Hoechst intensities were extracted. Cell divisions were automatically recognized using the Hoechst channel allowing for reporter onset curves to be restricted to a single cell cycle.
CRMs and Robustness inMsx1
GBE
at University of Warwick on December 11, 2015
http://gbe.oxfordjournals.org/
For this reason, we can analyze the contributions of individual promoters and CRMs by comparing entire transcription rate distributions across all experiments. Our transient transfection approach therefore complements studies using integrated porters in stable cell lines where the genomic location of re-porter integration is known to affect the timing and size of
transcriptional bursts (Becskei et al. 2005; Raj et al. 2006;
Skupsky et al. 2010).
Basal Promoters Display Dynamic Intra- and Intercellular Transcription Rate Ranges
Studies in yeast and bacteria have shown that basal promoters are important determinants of the inverse relationship
be-tween mean expression and noise (Tirosh and Barkai 2008;
Hornung et al. 2012;Carey et al. 2013). We therefore ana-lyzed the real-time activity of the orthologous mouse and fugu
Msx1promoters at single-cell resolution to test whether this
FIG. 2.—Estimation of copy number-independent transcription rates using a hierarchical model of transcriptional dynamics. (A) We simultaneously estimated probability density functions (pdfs) of the copy number,c,and transcription rate1in arbitrary units (AU) for each single-cell time course. M(0) is initial mRNA value, P(0) is the initial protein value, T is the switch time, and a and b are the parameters of the hierarchical distributions. (B) The fluorescence profiles of two randomly picked cells of a given experiment differ significantly (left panel). Stippled lines indicate the switch times for each individual cell. This represents the time point where transcription switches from the basal rate to the active rate. Although the calculated pdf for copy number differs between these cells (middle), the pdfs of transcription rates are very similar (right). The hierarchical estimation procedure is used to confirm the form and robustness of these “stack” plots and shows how likely a given transcription rate (in AU) is within single cells across experiments. These pdfs permit an unbiased, copy number-independent transcription rate assessment across all single cells in all experiments. In the ensuing figures, the probability densities of the stack plots showing transcription rate distributions are encoded as color intensities of heat maps along the Y-axis.
Vance et al.
GBE
at University of Warwick on December 11, 2015
http://gbe.oxfordjournals.org/
relationship also holds true for metazoans. To examine both the rate distributions within a given cell and the population-wide distributions of average single-cell transcription rates, we displayed the calculated transcription rate distributions for
each cell along the y-axis and sorted each individual cell
along thex-axis according to ascending average transcription
rates for all graphs. This revealed single-cell transcription rate distributions with promoter-specific ranges and showed that the corresponding range of switch times derived from the posterior distribution narrows with increased transcription rate (fig. 3A–C). This suggests that the progression from the basal to the active state occurs more rapidly in those cells with a high transcription rate. The data also showed that
the basal mouse Msx1 promoter has a 2.3-fold higher
mean single-cell transcription rate compared with the
ortho-logous fugu sequence (table 1). This is consistent with the
population average measurements in figure 1D determined
using flow cytometry, further validating our single cell approach.
We assembled all basal promoter construct single-cell rates to investigate the relationship between mean transcrip-tion rate and noise. This demonstrated that the range of transcription rates inside each single cell (measured as SD)
increases in correlation with the average rate (fig. 3DandE).
However, the average intracellular transcription rate increases faster than the corresponding SD of rates inside each cell resulting in a decrease in the coefficient of variation (CV) per single cell with increasing average rate. Intracellular variation in transcription rates would in our context be understood as 1/CV (the signal-to-noise ratio [SNR] in control theory) of single-cell transcription rate distributions imply-ing that promoters on their own already display an (aver-age-rate dependent) robustness behavior, consistent with previous analyses examining the relationship between
mean rate and noise in yeast and bacteria (Tirosh and
Barkai 2008;Hornung et al. 2012;Carey et al. 2013). One trivial explanation could be that more transfected templates in a given cell would, when averaged over time across a single cell, lead to an overall higher level of reporter fluores-cence and underlying transcription rate. Importantly, we showed that this is not the case here as the estimated
template copy numbers of the cells in figure 3F (y-axis)
do not correlate with increased average transcription rates (fig. 3D).
Our analysis revealed four different dynamic promoter
behaviors within single cells (fig. 3G). Cells can acquire
either a high or a low average rate very quickly (identified by a low SD and narrow spread of switch times), the range of rates can be traversed slowly (with high SD) or there might be more than one transcription rate optimum per cell, hinting at a variety of preferred promoter states.
Msx1CRMs Modulate Single-Cell Promoter Transcription Rate Distributions in a Graded Manner
It has been proposed that CRMs use either a rheostatic or binary mode of action to modulate fixed promoter rates (for
a review seeJeziorska et al. [2009]). However, single time
point population measurements are unable to distinguish be-tween these two models. To generate a more detailed under-standing of CRM function, we assayed both for the ability of
Msx1CRMs to modulate real-time promoter rate distributions
in single cells, and also for conservation and divergence of
function between mouse and fugu CRMs. AsMsx1CRMD
and CRMB are known to function as classical enhancers
both in vivo and in C2C12 cells (MacKenzie et al. 1997;
Woodcock et al. 2013), we compared the transcription rates of CRMD and CRMB containing reporters with the respective promoter-alone constructs within a population of cells. We first noted that fugu and mouse CRMD and CRMB increase mean promoter single-cell transcription rates when analyzed
across a population of cells (table 1). The transcription rate
distributions of CRMD and CRMB (in red) show that both
fugu and mouse CRMD (fig. 4A) and CRMB (fig. 4B) shift
the respective basal promoter rate distributions (in blue) up-wards: more cells within a population display a higher average rate. Closer inspection of the transcription rate distributions in
figure 4A, however, also suggests that mouse CRMD (red) has the capacity to function as either an activator or a repressor of the SV40 promoter in single cells depending on basal pro-moter rates (blue). The population of cells with a lower mean promoter transcription rate is repressed by mouse CRMD, whereas the population with a higher mean transcrip-tion rate is activated. This leads to a bimodal rate distributranscrip-tion at single-cell resolution, an effect that is not discovered when only population average measurements are used.
We next examined the single-cell transcription rate distri-butions of constructs containing the previously uncharacter-ized CRMC and CRMA regions. Despite a low sequence conservation (56% between fugu and mouse) CRMC in-creases the proportion of cells with a higher mean rate,
irre-spective of the species origin of CRMC or promoter (fig. 5A
andtable 1). However, CRMA, which is highly conserved be-tween fugu and mouse (71%), unexpectedly displays an evo-lutionary divergence of function as fugu CRMA enhances promoter transcription rates whereas mouse CRMA silences under our identical cellular and experimental conditions. In fact, adding mouse CRMA to SV40 yields a rate distribution
below that of the basal SV40 promoter alone (fig. 5B),
sug-gesting that sequence evolution within CRMA in the lineage toward mammals has changed its functionality. Surprisingly, the intracellular ranges of rates acquired through adding CRMC and CRMA are consistently narrower than those of the basal promoters, CRMB or CRMD constructs across the
CRMs and Robustness inMsx1
GBE
at University of Warwick on December 11, 2015
http://gbe.oxfordjournals.org/
FIG. 3.—Basal promoters display intra-and intercellular transcription rate ranges. Transcription rate and switch time pdfs for the fuguMsx1promoter (A),
mouseMsx1promoter (B), theSV40promoter (C), and all cells carrying basal promoter constructs (D). Transcription rates, plotted as heat maps at single-cell resolution, are shown in blue. Each column represents a single cell, sorted by average intracellular transcription rate on they-axis (in comparable AUs), the color intensity in the heat map indicates the probability of a particular rate. For each single cell, the switch times (in green) are centered around the median switch time to allow comparisons across cells irrespective of the absolute activation time. This display format also applies tofigures 4–7. (E) The width of the
Vance et al.
GBE
(continued)
at University of Warwick on December 11, 2015
http://gbe.oxfordjournals.org/
entire spectrum of average rates (fig. 5vs.fig. 4). This is sug-gestive of a novel CRM intracellular filter function that reduces intracellular variability in transcription rates (compare red and
blue infig. 5AandBvs.fig. 4AandB). The use of the posterior
probability as a measure of transcriptional variability is
dis-cussed in the supplementary text, Supplementary Material
online and adds further strength to this result.
Differential Contributions of Promoters and CRMs to Transcription Rate Distributions in Real Time
To perform a statistical analysis on the results as the basis for uncovering general promoter and CRM functional properties, we sorted the transcription rate distributions for all 573 single cells by ascending transcription rate means. This demonstrated that although the range of rates increases with the mean rate
inside single cells, the mean grows faster, leading to a CV reduction and therefore an increase in the SNR (=1/CV) (fig. 6AandB). The results also display a significant contraction of the range of switch time values with increasing single-cell transcription rate means, suggesting that the more rapid tran-sition at higher transcription rates is a global phenomenon (fig. 6A). We next color-coded single-cell rate distributions depending on the different promoters used to determine the contributions of promoters to the overall transcription
rate distribution (fig. 6C). This showed that the rate
distribu-tions are separable and reflect those of the underlying basal
promoter-alone constructs (fig. 6D).
To investigate the regulatory roles of CRMs, we plotted the averages of all single-cell transcription rates in a log scale as a cumulative distribution function across the population and dis-covered that a Kolmogorov–Smirnov test finds log-normality
for each CRM (purple lines infig. 7A). CRMs lead to a shift in
the basal promoter population mean or variance in log space
(black infig. 7A). Enhancer CRMs (such as CRMB, C, and D)
increase, whereas silencers (CRMA) decrease the basal
pro-moter population mean rate (black stippled line infig. 7A)
with each individual CRM modulating the mean with differing strength. CRMB, C, and D cause more cells within a population
(at f>0.5) to acquire a higher average transcription rate
(fig. 7AandB). The continuous nature of such dynamic features would not be visible if only population averages were measured
and could be mistaken for ultrasensitive behavior (Hu et al.
2008). Our results therefore show thatMsx1CRMs function
in a graded, nonlinear manner to transform basal promoter rate ranges at single-cell resolution.
Identification of Conserved CRMs that Function to Reduce Intracellular Variability in Transcription Rates
Our real-time single-cell transcription rate estimations allowed us to investigate the role of CRMs in controlling variability and
robustness inMsx1expression. The results showed that the
intracellular transcription rate ranges for CRMA and CRMC containing constructs are consistently narrower than those of the basal promoters and CRMB or CRMD containing
constructs across the entire range of average rates (fig. 7C
compared with B). Despite the fact that CRMA can be
either activating (fig. 5B, fugu CRMA) or silencing (fig. 5B,
mouse CRMA), CRMA’s intracellular transcription rates (blue) are largely contained within (pink) the basal promoter (red) single-cell rates and occupy its lower half in the overall cell population. The same is true for CRMC (green), where the
FIG. 3.—Continued
[image:11.595.50.288.123.445.2]intracellular rate spectrum (measured as SD) increases with the average rate, but the CV (=SD/mean rate of each single cell) decreases. The corresponding line of best fit is shown in red. (F) The estimated DNA template copy numbers (pink) for all cells in (D) with mean transcription rates sorted in ascending order illustrate that there is no relationship between transcription rate and copy number seen as a result of our estimation process of these variables. (G) We observe four different classes of promoter transcription rate behaviors within single-cell time courses. The top row shows a representative rate distribution arising from each of the four classes and the bottom row shows the corresponding time series.
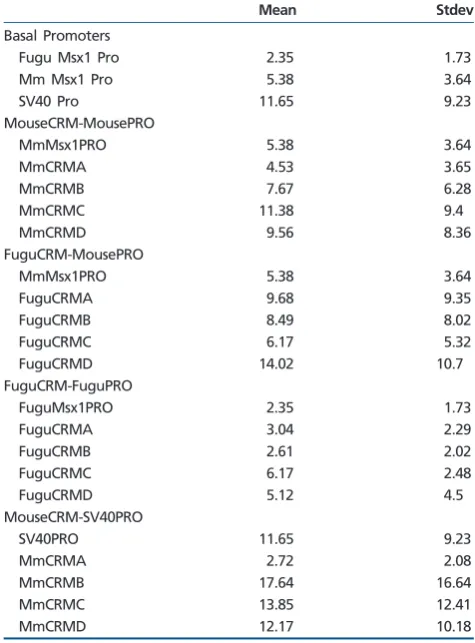
Table 1
Population Level Statistics Showing Mean and Stdev of Single Cell Mean Transcription Rate
Mean Stdev
Basal Promoters
Fugu Msx1 Pro 2.35 1.73
Mm Msx1 Pro 5.38 3.64
SV40 Pro 11.65 9.23
MouseCRM-MousePRO
MmMsx1PRO 5.38 3.64
MmCRMA 4.53 3.65
MmCRMB 7.67 6.28
MmCRMC 11.38 9.4
MmCRMD 9.56 8.36
FuguCRM-MousePRO
MmMsx1PRO 5.38 3.64
FuguCRMA 9.68 9.35
FuguCRMB 8.49 8.02
FuguCRMC 6.17 5.32
FuguCRMD 14.02 10.7
FuguCRM-FuguPRO
FuguMsx1PRO 2.35 1.73
FuguCRMA 3.04 2.29
FuguCRMB 2.61 2.02
FuguCRMC 6.17 2.48
FuguCRMD 5.12 4.5
MouseCRM-SV40PRO
SV40PRO 11.65 9.23
MmCRMA 2.72 2.08
MmCRMB 17.64 16.64
MmCRMC 13.85 12.41
MmCRMD 12.17 10.18
CRMs and Robustness inMsx1
GBE
at University of Warwick on December 11, 2015
http://gbe.oxfordjournals.org/
FIG. 4.—ClassicalMsx1enhancers increase the number of cells with a higher mean transcription rate in a graded manner. Basal promoter transcription
rate probabilities are in blue, whereas those of constructs carrying the CRMD (A) and CRMB (B) are plotted in red. Overlap in pink indicates rates where
Vance et al.
GBE
(continued)
at University of Warwick on December 11, 2015
http://gbe.oxfordjournals.org/
overlap (yellow) is confined to the upper bound of the intra-cellular rate distribution of the basal promoter in 80% of sin-gle-cell profiles. This action of cutting out the higher or lower ranges of the intracellular basal promoter rate range repre-sents a novel functionality of CRMs that operates to reduce variability in intracellular transcription rates, irrespective of
each cell’s average rate (depicted graphically in fig. 7D).
Furthermore, distribution of standard deviations for single-cell transcription rate estimates indicates that variations in intracellular transcription rates are reduced for all CRM containing constructs compared with the promoter-alone (fig. 7E). This reduction is most pronounced for CRMA and
CRMC constructs confirming the capacity ofMsx1CRMs to
reduce intracellular variability in transcription rates. The results
therefore suggest thatMsx1CRMs can function as important
regulators of robustness in the control of gene expression in addition to modulating transcription rates.
Discussion
Random fluctuations in gene expression can be either bene-ficial or deleterious for a number of fundamental biological processes and can be subject to regulatory control. For exam-ple, noise in the expression of key dose-dependent genes must be filtered out to ensure robust cellular function (Newman et al. 2006; Batada and Hurst 2007; Lehner
2008). In this study, we used mathematical modeling to
esti-mate transcription rates for 573 single-cell reporter time courses and analyzed the function of CRMs and promoters
in controlling variability and robustness inMsx1expression at
single-cell resolution.
We assessed the contribution ofMsx1CRMs to the
well-described gene expression level–noise relationship. We found
that both the fugu and mouseMsx1basal promoters and the
heterologous SV40 control promoter displayed a wide range of rates. The shapes of these rate distributions were
deter-mined by the species origins of the component used (fig. 6C
andD). We observed a basal promoter-based robustness
con-trol that is dependent upon the average rate: The higher the average rate within a given cell, the lower the CV and the
higher the SNR (fig. 3E). This observation held true for all CRM
containing constructs (fig. 6B) demonstrating that the noise–
mean rate relationship is indeed solely promoter-controlled in vertebrates. These results imply that distal CRMs do not affect the noise–mean expression relationship and are consistent with studies in yeast implicating promoter sequence and nu-cleosome occupancy at the transcriptional start site in
expres-sion noise control (Tirosh and Barkai 2008; Hornung et al.
2012;Carey et al. 2013). In addition to this, recent work in worms has demonstrated promoter-based robustness control
in spatial expression and suggested that promoter sequence and length can qualitatively affect promoter robustness (Barriere et al. 2011). Our findings expand on this by analyzing the temporal characteristics of promoter function.
We also investigated the mode of CRM action at single-cell resolution and found conservation of CRM function despite low overall DNA sequence similarity, an observation
congru-ent with the billboard model of CRM function (Arnosti and
Kulkarni 2005), as well as divergence of function among
highly similar sequences. We discovered that bothMsx1
en-hancer and silencer CRMs transform basal promoter rate dis-tributions in a CRM-specific but nonlinear fashion across a
population (fig. 7A). This suggests that Msx1 CRMs act to
modulate fluctuating promoter rate distributions (fig. 7E),
and not a single fixed rate as suggested from single time point measurements, in a graded manner. We also show that cell-to-cell variability in transcription rate averages across
a population is log-normally distributed (fig. 7A), whereas the
estimated rates inside a single cell are not, suggesting under-lying multiplicative effects acting upon a fundamentally sto-chastic process within a population in accordance with current thermodynamic models of combinatorial transcription factor
binding (Janssens et al. 2006;Segal et al. 2008;Gertz et al.
2009). Although intercellular variability of transcription rate
averages is dominated by promoter and species-specific
fea-tures (figures 6and7), different CRMs affect inter- and
intra-cellular rates independently (fig. 7Bvs.7C). This leads to mean
and variance shifts in the log-scale (for CRMB, C, and D) across a population and/or to variance reduction (CRMA, C) in the intracellular transcription rate distributions (fig. 7A,E).
Previous single molecule studies have shown that transcrip-tional events are discrete and occur in bursts, interspersed by pauses whose length is proportional to the inverse of the
tran-scription rate (Davenport et al. 2000; Galburt et al. 2009;
Hodges et al. 2009). Although the stability of the fluorescent reporter used in our study limited our ability to detect tran-scriptional bursts, we speculate that distal CRMs may function as individual operating units to regulate either burst size (the number of mRNA molecules produced per burst) or frequency (the rate at which a promoter changes from an inactive to an active state) as shown for promoter proximal transcription
factor binding sites (Suter et al. 2011;Hornung et al. 2012;
Carey et al. 2013). Indeed, studies in yeast have demonstrated that transcriptional variability can be decoupled from mean expression by differential regulation of either burst frequency
or strength (Murphy et al. 2010; To and Maheshri 2010).
Future comparative analyses, using destabilized reporters, are thus needed to understand the molecular causes for these dynamic CRM and promoter functions.
FIG. 4.—Continued
enhancer action does not differ from the basal promoter alone. Note that even under the action of these classical enhancers transcription rate distributions are wide within single cells and many show more than one optimal set of rates, irrespective of copy number. The entire rate distribution (and not a single rate) is modified by enhancer action.
CRMs and Robustness inMsx1
GBE
at University of Warwick on December 11, 2015
http://gbe.oxfordjournals.org/
FIG. 5.—Evolutionary conservation and divergence ofMsx1CRMC and CRMA function. (A) The previously uncharacterized, CRMC from fugu and
mouse, acts as an enhancer upon various promoters. The intracellular rate ranges are narrow compared with the basal promoter. (B) Sequence conservation
Vance et al.
GBE
(continued)
at University of Warwick on December 11, 2015
http://gbe.oxfordjournals.org/
In contrast to promoter-based robustness control that is becoming stronger with higher average transcriptional rates within a population, CRM-mediated reduction in intracellular variability covers the entire spectrum of rates within a
popu-lation (fig. 7CandD). This indicates that CRMs can function as
important regulators of gene expression robustness to ensure that the expression of key developmental transcription factors is precisely controlled. A comparison between fugu and mouse CRMA reveals a change in its function from enhancer
to repressor under the same conditions (fig. 5). Despite this
change, the filter function of CRMA remains shared across
mouse and fugu (fig. 7C), suggesting that this is inherited
from a common ancestor whereas other rate modulating ac-tivities of the same CRMs have evolved separately. Such evo-lutionary decoupling of rate modulating CRM activities from transcriptional robustness control could provide a mechanism for individual genes to be expressed faster (or slower) than others without affecting their accuracy. We expect that tran-scription rate filtering is just one in a large class of dynamic functionalities of vertebrate CRMs that remain to be
discov-ered using quantitative single-cell transcription rate
measurements.
FIG. 5.—Continued
does not guarantee functional conservation. Fugu CRMA acts as an enhancer upon the fugu and mouse promoters, whereas mouse CRMA acts as a silencer of the mouse and SV40 promoters. However, despite this evolutionary change in function revealed here, the intracellular SD of transcription rates is very narrow for CRMA and C compared with the basal promoter and CRMB and CRMD containing constructs. Notably, mouse CRMA conveys pure repression upon the SV40 promoter with an extremely narrow intracellular rate distribution.
FIG. 6.—Differential contributions of promoters and CRMs to single-cell transcription rates. Aligning by average rate and color coding all 573 single-cell
profiles according to either the promoters or CRMs used allows us to quantify complex promoter dynamics at single-cell resolution. (A) The corresponding range of switch times derived from the posterior distribution narrows with increased transcription rate. (B) Intracellular SD of estimated rates increases with mean rate (upper graph). At the same time the mean rate increases more quickly than the width of the intracellular rate spectra, leading to a decrease of the intracellular CV (lower graph). (C) When color-coded by promoter type, different transcription rate ranges are observed within a given population. Purple is overlap of red and blue; white is overlap of red, green, and blue. Their respective order follows that of the basal promoter rate spectra without CRMs. (D) Promoters set specific transcription rate distributions across a population and within each cell.
CRMs and Robustness inMsx1
GBE
at University of Warwick on December 11, 2015
http://gbe.oxfordjournals.org/
F IG .7 . — Ident ificat ion of a n ovel C RM robustn ess contr ol func tion for Msx1 CR M A and C RMC .( A )C RMs affec t means and va ri ances o f av erage ra te s w it hin a populati o n o f cells in a non linear fashion. A cu m ul at ive d istr ibut ion fun cti o n o f singl e-cell ra te av erages in log spac e prov ides a g eneri c descri ption for CRM ac tion at the populati o n scale wi th si ngle-c el l resoluti on. Plott ing enti re si ngle-c el l rate distr ibuti ons re veals d ynamic enhanc er func tion al ities o f C RMB and CRMD ( B ) and n o vel in tracell ular ra te fi lter funct ions of CR MA and C RMC ( C ). In th ese g raphs, all singl e-cell dat a ar e color -c oded as indic ated b ased on th e C R M s they co n tain. ( D )O ve rv iew g ra ph ic displayi ng th e q u ant itati ve p ropert ies o f p ro mot er b ehav ior and C R M ac tion. This hi ghligh ts tw o d iff er en t ac tiv ity stat es (yell ow and p ink) of the b asal promoter , each regulat ed by a d iff er ent CRM. Giv en that the spread of rates (SD) inc reases wi th inc reased av erage ra te s in sho rter p erio ds of ti me, this imp lies acc eleration o f tr ansc ript ion rate choi ces as a means to acc omplish the de scri bed d istr ibuti onal p roperti es. ( E ) Distr ibuti o n o f standard deviati ons for tr ansc ript ion rate esti mates indi cates repr ession of tr anscri ption al noise fo r all CRMs. Gamma di st ribut ions were fit ted to the standard dev iations of the tr ansc ript ion ra te MCMC estimates for ev er y cel li n eac h C RM configurat ion acr oss all promoter ty pes. As all estimations w er e per for med under identi cal par ameteri zati ons, thi s showed th at the unc ertain ty in the transcr iptio n ra te est imat e fo r the pr omot er alo n e w as generall y h igher across th e popu lation, indi cating th at th e ti m e seri es themselv es w ere mo re vari ab le due to transcr ipti onal noise.
Vance et al.
GBE
at University of Warwick on December 11, 2015
http://gbe.oxfordjournals.org/
Supplementary Material
Supplementary text,figure S1, andtable S1are available at
Genome Biology and Evolution online (http://www.gbe. oxfordjournals.org/).
Acknowledgments
The authors thank Professor Laurence Hurst (Bath) for critical reading of the manuscript and Dr Atsushi Miyawaki (RIKEN Institute) for the pCS2Venus plasmid. D.J.W. was funded by BBSRC SABR (BB/F005938/1) and EPSRC (GR/S29256/01) grants and the EU (BIOSIM Network Contract 005137). K.W.V., S.O., and J.E.R. were funded by Wellcome Trust Programme Grants (WT 066790/E/02/Z and 066745/Z/01/Z) and a Human Frontier Science Programme grant (HFSP-RGP0029/2007-C), all awarded to G.K. as principal investigator.
Literature Cited
Alon U, Surette MG, Barkai N, Leibler S. 1999. Robustness in bacterial chemotaxis. Nature 397:168–171.
Arias AM, Hayward P. 2006. Filtering transcriptional noise during devel-opment: concepts and mechanisms. Nat Rev Genet. 7:34–44. Arnosti DN, Kulkarni MM. 2005. Transcriptional enhancers: Intelligent
enhanceosomes or flexible billboards? J Cell Biochem. 94:890–8. Bar-Even A, et al. 2006. Noise in protein expression scales with natural
protein abundance. Nat Genet. 38:636–643.
Barkai N, Leibler S. 1997. Robustness in simple biochemical networks. Nature 387:913–917.
Barriere A, Gordon KL, Ruvinsky I. 2011. Distinct functional constraints partition sequence conservation in a cis-regulatory element. PLoS Genet. 7:e1002095.
Batada NN, Hurst LD. 2007. Evolution of chromosome organization driven by selection for reduced gene expression noise. Nat Genet. 39: 945–949.
Becskei A, Kaufmann BB, van Oudenaarden A. 2005. Contributions of low molecule number and chromosomal positioning to stochastic gene expression. Nat Genet. 37:937–944.
Boettiger AN, Levine M. 2009. Synchronous and stochastic patterns of gene activation in theDrosophila embryo. Science 325:471–473. Cai L, Friedman N, Xie XS. 2006. Stochastic protein expression in individual
cells at the single molecule level. Nature 440:358–362.
Carey LB, van Dijk D, Sloot PM, Kaandorp JA, Segal E. 2013. Promoter sequence determines the relationship between expression level and noise. PLoS Biol. 11:e1001528.
Chang HH, Hemberg M, Barahona M, Ingber DE, Huang S. 2008. Transcriptome-wide noise controls lineage choice in mammalian pro-genitor cells. Nature 453:544–547.
Davenport RJ, Wuite GJ, Landick R, Bustamante C. 2000. Single-molecule study of transcriptional pausing and arrest byE. coliRNA polymerase. Science 287:2497–2500.
Downey MJ, et al. 2011. Extracting fluorescent reporter time courses of cell lineages from high-throughput microscopy at low temporal reso-lution. PLoS One 6:e27886.
Finkenstadt B, et al. 2013. Quantifying intrinsic and extrinsic noise in gene transcription using the linear noise approximation: an application to single cell data. Ann Appl Stat. 7:1837–2457.
Frankel N, et al. 2011. Morphological evolution caused by many subtle-effect substitutions in regulatory DNA. Nature 474:598–603.
Galburt EA, Grill SW, Bustamante C. 2009. Single molecule transcription elongation. Methods 48:323–332.
Gertz J, Siggia ED, Cohen BA. 2009. Analysis of combinatorial cis-regulation in synthetic and genomic promoters. Nature 457:215–218. Goentoro L, Kirschner MW. 2009. Evidence that fold-change, and not absolute level, of beta-catenin dictates Wnt signaling. Mol Cell. 36:872–884.
Granier C, et al. 2011.Nodalcis-regulatory elements reveal epiblast and primitive endoderm heterogeneity in the peri-implantation mouse embryo. Dev Biol. 349:350–362.
Hodges C, Bintu L, Lubkowska L, Kashlev M, Bustamante C. 2009. Nucleosomal fluctuations govern the transcription dynamics of RNA polymerase II. Science 325:626–628.
Hornung G, et al. 2012. Noise-mean relationship in mutated promoters. Genome Res. 22:2409–2417.
Hu JS, et al. 2008. Border formation in a Bmp gradient reduced to single dissociated cells. Proc Natl Acad Sci U S A. 105:3398–3403. Janssens H, et al. 2006. Quantitative and predictive model of
transcrip-tional control of theDrosophila melanogaster even skippedgene. Nat Genet. 38:1159–1165.
Jeziorska DM, Jordan KW, Vance KW. 2009. A systems biology approach to understanding cis-regulatory module function. Semin Cell Dev Biol. 20:856–862.
Jeziorska DM, Koentges G, Vance KW. 2012. Novel cis-regulatory modules control expression of the Hairy and Enhancer of Split-1 (HES1) transcription factor in myoblasts. J Biol Chem. 287:5687–5697.
Lee H, Habas R, Abate-Shen C. 2004. MSX1 cooperates with histone H1b for inhibition of transcription and myogenesis. Science 304: 1675–1678.
Lehner B. 2008. Selection to minimise noise in living systems and its implications for the evolution of gene expression. Mol Syst Biol. 4:170.
MacKenzie A, Purdie L, Davidson D, Collinson M, Hill RE. 1997. Two en-hancer domains control early aspects of the complex expression pat-tern ofMsx1. Mech Dev. 62:29–40.
Macneil LT, Walhout AJ. 2011. Gene regulatory networks and the role of robustness and stochasticity in the control of gene expression. Genome Res. 21:645–657
Mangan S, Alon U. 2003. Structure and function of the feed-forward loop network motif. Proc Natl Acad Sci U S A. 100:11980–11985. Miller KA, et al. 2007. A highly conserved Wnt-dependent TCF4 binding
site within the proximal enhancer of the anti-myogenicMsx1gene supports expression within Pax3-expressing limb bud muscle precursor cells. Dev Biol. 311:665–678.
Murphy KF, Adams RM, Wang X, Balazsi G, Collins JJ. 2010. Tuning and controlling gene expression noise in synthetic gene networks. Nucleic Acids Res. 38:2712–2726.
Newman JR, et al. 2006. Single-cell proteomic analysis ofS. cerevisiae
reveals the architecture of biological noise. Nature 441:840–846. Odelberg SJ, Kollhoff A, Keating MT. 2000. Dedifferentiation of
mamma-lian myotubes induced by msx1. Cell 103:1099–1109.
Paulsson J. 2005. Models of stochastic gene expression. Phys Life Rev. 2:18.
Pedraza JM, Paulsson J. 2008. Effects of molecular memory and bursting on fluctuations in gene expression. Science 319:339–343.
Picot E, Krusche P, Tiskin A, Carre I, Ott S. 2010. Evolutionary analysis of regulatory sequences (EARS) in plants. Plant J. 64:165–176. Raj A, Peskin CS, Tranchina D, Vargas DY, Tyagi S. 2006. Stochastic mRNA
synthesis in mammalian cells. PLoS Biol. 4:e309.
Raj A, van Oudenaarden A. 2008. Nature, nurture, or chance: stochastic gene expression and its consequences. Cell 135:216–226.
Raser JM, O’Shea EK. 2005. Noise in gene expression: origins, conse-quences, and control. Science 309:2010–2013.
CRMs and Robustness inMsx1
GBE
at University of Warwick on December 11, 2015
http://gbe.oxfordjournals.org/
Samoilov MS, Price G, Arkin AP. 2006. From fluctuations to phenotypes: the physiology of noise. Sci STKE. 2006:re17.
Satokata I, Maas R. 1994.Msx1deficient mice exhibit cleft palate and abnormalities of craniofacial and tooth development. Nat Genet. 6:348–356.
Segal E, Raveh-Sadka T, Schroeder M, Unnerstall U, Gaul U. 2008. Predicting expression patterns from regulatory sequence in
Drosophilasegmentation. Nature 451:535–540.
Shetty S, Takahashi T, Matsui H, Ayengar R, Raghow R. 1999. Transcriptional autorepression ofMsx1gene is mediated by interactions of Msx1 protein with a multi-protein transcriptional complex containing TATA-binding protein, Sp1 and cAMP-response-element-binding pro-tein-binding protein (CBP/p300). Biochem J. 339 (Pt 3):751–758. Skupsky R, Burnett JC, Foley JE, Schaffer DV, Arkin AP. 2010. HIV
pro-moter integration site primarily modulates transcriptional burst size rather than frequency. PLoS Comput Biol. 6:e1000952.
Suter DM, et al. 2011. Mammalian genes are transcribed with widely different bursting kinetics. Science 332:472–474.
Takahashi T, Guron C, Shetty S, Matsui H, Raghow R. 1997. A minimal murineMsx-1gene promoter. Organization of its cis-regulatory motifs and their role in transcriptional activation in cells in culture and in transgenic mice. J Biol Chem. 272:22667–22678.
Tirosh I, Barkai N. 2008. Two strategies for gene regulation by promoter nucleosomes. Genome Res. 18:1084–1091.
To TL, Maheshri N. 2010. Noise can induce bimodality in positive transcriptional feedback loops without bistability. Science 327: 1142–1145.
Wang J, Abate-Shen C. 2012. The MSX1 homeoprotein recruits G9a methyltransferase to repressed target genes in myoblast cells. PLoS One 7:e37647.
Wang J, et al. 2011. The Msx1 homeoprotein recruits polycomb to the nuclear periphery during development. Dev Cell. 21:575–588. Wernet MF, et al. 2006. Stochastic spineless expression creates the retinal
mosaic for colour vision. Nature 440:174–180.
Willert J, Epping M, Pollack JR, Brown PO, Nusse R. 2002. A transcriptional response to Wnt protein in human embryonic carcinoma cells. BMC Dev Biol. 2:8.
Woodcock DJ, et al. 2013. A hierarchical model of transcriptional dynam-ics allows robust estimation of transcription rates in populations of single cells with variable gene copy number. Bioinformatics 29:1519–1525.
Associate editor:Soojin Yi
Vance et al.
GBE
at University of Warwick on December 11, 2015
http://gbe.oxfordjournals.org/