VISUALIZING SERVICE CONTRACT
PERFORMANCE AND CUSTOMER
BEHAVIOUR
I
NTERACTIVE
D
ASHBOARDS
BENJAMIN GROENEVELD
BACHELOR INDUSTRIAL ENGINEERING & MANAGEMENT
UNIVERSITY OF TWENTE
Visualising service contract performance and customer
behaviour
Interactive Dashboards
Bachelor Thesis Industrial Engineering and Management
Author
Benjamin Groeneveld S1839942
BSc Industrial Engineering and Management
ASSA ABLOY Entrance Systems University of Twente
Horapark 6 Drienerlolaan 5
6717 LZ, Ede 7522 NB, Enschede
Netherlands The Netherlands
Supervisors ASSA ABLOY Entrance Systems Supervisors University of
Indira Parlov Twente
Manager Customer Services Dr. A.I. Aldea
Gerrit Westhof Prof. dr. J. van Hillegersberg
© ASSA ABLOY, All rights reserved
i
Preface
This bachelor thesis contains the data visualisation of the performance of customers with service contracts and their behaviour and characteristics. This research is done to
graduate from the bachelor Industrial Engineering and Management at the University of Twente.
First, I want to thank Indira Parlov and Gerrit Westhof which are the supervisors of the company where this research is done. I also want to thank Ben Koolstra and Johan Hazenberg for giving support with the collection of the data needed in this thesis.
Second, I want to thank the supervisors of the University of Twente. I want to thank Adina Aldea for guiding me through the whole process and the great feedback that was given. I also want to thank Jos van Hillegersberg for assisting my bachelor project and giving insight in service contract performance.
© ASSA ABLOY, All rights reserved
ii
Management summary
Introduction
ASSA ABLOY entrance systems is a global leader in door opening solutions. The company has several decades of experience in creating automatic entrances. The company delivers automatic entrances to many different industries. Entrances for pedestrians and
entrances for industrial use are both created. The company offers different service packages to service automatic entrances. The service packages that the company issues go from bronze to gold++ where bronze has the least service covered and gold++ has the most service covered within the contract.
This research has been conducted for ASSA ABLOY Entrance systems in Ede. The
department in Ede covers the pedestrian door solutions. Therefore, this study focused on automatic entrances where pedestrians go through and excludes automatic industrial entrances.
The management team of the company asked to make the relation between the
customer service department and the (gold) service contracts clear. To obtain insight in this topic a main research question is made. The main research question is: ‘‘How to gain insight into customer behaviour and the performance of the gold service contracts owned by the customers?’’.
Approach
To gain insight in the performance of service contracts and the behaviour of customers, dashboards are created. The Design Science Research Methodology has been used to solve to core problem. Literature reviews, interviews with managers and directors of the company made the creation of the dashboards possible.
Literature reviews have been done into:
◼ Performance Measurement
◼ Data quality, preparation and cleaning ◼ KPI selection
◼ BI-Dashboard Design ◼ Service Packages
The dashboards
In Excel seven dashboards have been created to visualize the performance of the gold customers and their behaviour.
1. The first dashboard is about the financial performance of the gold customers. In this dashboard a gold customer can be selected.
2. The second dashboard is about the reported malfunctions of gold contracts of customers. This dashboard gives the option to select a gold customer.
3. The third dashboard is about the order types and installation types of the reported malfunctions of the gold contracts. This dashboard gives the option to select a gold customer.
4. The fourth dashboard gives a financial comparison of gold customers and other customers. This dashboard gives the option to select all gold customers, all other customers or both the gold customers and other customers.
5. The fifth dashboard gives a comparison of the total amount of reported
malfunctions of gold customers and other customers. This dashboard gives the option to select all gold customers, all other customers or both gold customers and other customers.
6. The sixth dashboard gives a comparison of the order types and type of
© ASSA ABLOY, All rights reserved
iii
7. The seventh dashboard gives a comparison between bronze, silver and gold contracts. The dashboard displays the order types in three different categories in percentages for every contract type.
Conclusions and recommendations
This research gives insight in the behaviour of customers with service contracts and it shows the performance of these customers. The dashboards that have been created make the relation between the customer service department and the service packages visible. The norm of having insight in customer behaviour and characteristics with service contracts is attained with the help of the dashboards. The company can use the
dashboards to analyse different gold customers and gold contracts. This can help them to adapt their strategy and take decisions based on the visualisation of data.
To improve the insight in customer behaviour and the performance of service contracts, recommendations are given to improve the dashboards. To increase the insight in gold contracts more only the data about the gold contracts of gold customers should be shown in the future. The data used in the dashboards stems from 2018, real-time data would make the dashboard more usable. Extra KPIs and measures can be added to give more insight in customer behaviour and the performance of service contracts.
Gold customers have a slightly higher margin than other contracts. Gold customers are reporting a higher percentage of their total entrances than other customers of the company. In the future it is possible that margins decrease since customers with gold contracts report more malfunctions. On the other hand, gold customers could have even higher margins in the future, because gold customers have a stronger relationship with the company than other customers which make the process between the two more efficient.
© ASSA ABLOY, All rights reserved
iv
Table of Contents
Preface ... i
Management summary ...ii
Reader’s guide ... vi
Definitions ... vii
List of figures ... viii
List of tables ... viii
1. Introduction ... 1
1.1 Introduction to the company ... 1
1.2 Problem statement ... 1
1.2.1 Problem scope ... 1
1.2.2 The core problem ... 3
1.3 Motivation for the research ... 4
1.4 Problem solving approach ... 4
1.4.1 Research methodology ... 4
1.4.2 The research goal... 5
1.4.3 The research questions ... 5
1.5 Norm and reality ... 7
2. Current and desired situation ... 8
2.1 Current situation ... 8
2.2 Desired situation ...10
3. Theoretical framework ...11
3.1 Theory on performance measurement ...11
3.2 Theory on KPI selection ...13
3.2.1 Selecting the KPIs ...14
3.3 Theory on data quality, preparation and cleaning ...16
3.3.1 Quality of the data ...16
3.3.2 Cleaning and preparation of the data ...17
3.4 Theory on BI-dashboard design ...18
3.4.1 Charts and graphs ...19
3.4.2 The layout of the dashboard ...20
3.4.3 Usability of the dashboard ...20
3.5 Theory on service packages ...20
Chapter 4. KPIs in the dashboards ...22
4.1 Selected KPIs in the dashboards ...22
4.1.1 Dashboard 1 – Financial performance Gold Customers ...23
4.1.2 Dashboard 2 – Reported Malfunctions Gold Contracts ...24
© ASSA ABLOY, All rights reserved
v
4.1.4 Dashboard 4 – Financial Comparison Gold Customers & Other Customers ...25
4.1.5 Dashboard 5 – Reported Malfunction Comparison Gold Customers & Other Customers ...25
4.1.6 Dashboard 6 – Entrance malfunction per Contract type ...25
4.1.7 Dashboard 7 – Order Type Percentage per Contract Type ...26
Chapter 5. Dashboard design & development ...27
5.1 Step-by-step plan to create interactive dashboards ...27
5.2 Data gathering ...29
5.3 Combining the data sets ...32
5.4 Cleaning and preparation of the data ...32
5.5 Choice for Excel as BI-tool ...34
5.6 Pivot tables ...34
5.7 Design of the dashboard ...34
5.8 Limitations of the data ...34
Chapter 6. Demonstration of the dashboards and evaluation ...35
6.1 Dashboard 1...35
6.2 Dashboard 2...36
6.3 Dashboard 3 ...37
6.4 Dashboard 4...38
6.5 Dashboard 5...39
6.6 Dashboard 6...39
6.7 Dashboard 7...40
6.8 Evaluation and conclusion ...40
Chapter 7. Conclusion ...44
7.1 Discussion ...44
7.2 Recommendations ...45
7.2.1 Recommendations to improve the dashboards ...45
7.2.2 Recommendations based on the dashboards ...45
7.3 Limitations ...46
7.4 Contributions to theory ...47
7.5 Contribution to practice ...47
References ...49
Appendices ...52
Appendix A - Systematic literature review ...52
Appendix B - Interviews with employees ...56
Appendix C - Evaluation framework BI scorecard ...57
© ASSA ABLOY, All rights reserved
vi
Reader’s guide
In this bachelor thesis research has been done to visualize the performance of a customer service department in relation to their customers and products. This report contains eight chapters, below a short introduction is given.
Chapter 1. Introduction
The first chapter explains the problem as received from the company. It also gives an approach to solve the core problem described. Afterwards the research questions to be answered are given to solve the problem. Then the norm and reality are described to show the current and desired situation.
Chapter 2. Current and desired situation
The second chapter shows the current situation within the company. The desired situation shows the goal that is set to accomplish in this research.
Chapter 3. Theoretical framework
The third chapter gives the theory that is needed to solve the core problem. Theory on performance measurement, data quality, data preparation and date cleaning are
explained. The third chapter also gives a systematic literature review on the selection of KPIs that can help this research. Theory on dashboard design and service packages are also provided.
Chapter 4. KPIs in the dashboard
The fourth chapter elaborates on the KPIs that were depicted from the systematic
literature review and the interviews with managers. Per dashboard the implemented KPIs are explained and the way in how they are calculated is given.
Chapter 5. Dashboard design & development
In the fifth chapter the steps towards the design and development of the dashboard are explained. In this chapter the steps from data gathering to finally designing the
dashboard are clarified. In the end of the fifth chapter the limitations of the data are described.
Chapter 6. Demonstration of the dashboards and evaluation
In the sixth chapter the seven dashboards are demonstrated with the help of
screenshots. For every dashboard an explanation is given on how the dashboard can be used and what each dashboard visualizes. In the end an evaluation on the dashboards is given.
Chapter 7. Conclusion
In the seventh chapter the answer to the core problem is given together with
© ASSA ABLOY, All rights reserved
vii
Definitions
Balanced scorecard A set of measures that gives top managers a fast but
comprehensive view of the business (Kaplan & Norton, 1992).
BI Business intelligence (BI) is about gathering data of a company and/or their customers and process this data into information, that can be used for decision making.
BPMN The Business Process Modelling Notation (BPMN) is the new
standard to model business process flows and web services (Owen & Raj, 2003).
Dashboard A dashboard is a tool that can visualise the performance of a business by making use of key performance indicators and metrics. A dashboard displays information in form of charts and gauges.
DSRM Design Science Research Methodology (Peffers et al., 2007).
Installation Installation is referred to as an automatic entrance.
ISO International Organization for Standardization
KPI KPI means Key Performance Indictor, which is a measurable that can value the success of a company on a certain activity.
Margin (%) Margin (%) is calculated by dividing the total margin and the total sales on a certain product or service.
Margin (€) Margin (€) is a profit that is made on a certain product or service.
Metrics A set of numbers that can give information about a process.
MPSM Managerial Problem-Solving Method, which is a framework to solve managerial problems that contains seven steps (Heerkens et al. ,2017).
© ASSA ABLOY, All rights reserved
viii
List of figures
Figure 1: Service contract types ... 1
Figure 2: Problem cluster ... 3
Figure 3: Relation between customer service centre and service contracts ... 4
Figure 4: Design Science Research Methodology (Peffers et al., 2007) ... 4
Figure 5: BPMN model of solving a malfunction ... 9
Figure 6: Conceptual framework of data quality (Wang & Strong, 1996) ...17
Figure 7: Five dimensions of data quality (Cai, L., & Zhu, Y. 2015) ...17
Figure 8: Final KPI selection ...23
Figure 9: Legend KPI selection ...23
Figure 10: Step-by-step plan to create interactive dashboards ...27
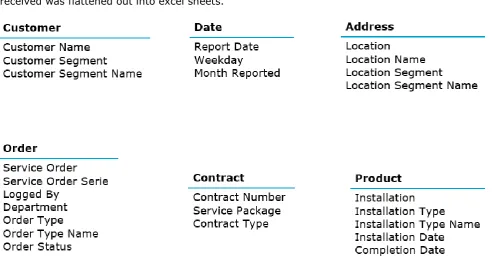
Figure 11: Data tables of reported malfunctions ...29
Figure 12: Data tables of financial data ...30
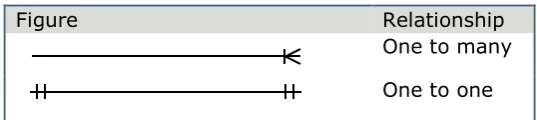
Figure 13: Data model of the received data ...31
Figure 14: Legend data model ...31
Figure 15: Data transfer ...32
Figure 16: Dashboard 1 ...35
Figure 17: Dashboard 2 ...36
Figure 18: Dashboard 3 ...37
Figure 19: Dashboard 4 ...38
Figure 20: Dashboard 5 ...39
Figure 21: Dashboard 6 ...39
Figure 22: Dashboard 7 ...40
Figure 23: Framework BI scorecard (Dyczkowski et al., 2014) ...57
Figure 24: Evaluation Manager Customer Services ...58
Figure 25: Evaluation Director Service Sales ...59
List of tables
Table 1: Legend problem cluster... 4Table 2: Explanation of gold contracts ... 8
Table 3: Criteria to determine contract type of a customer ... 9
Table 4: Overview of perspectives by source from literature ...13
Table 5: KPIs selected from the articles ...15
Table 6: Chart types (Alexander & Walkenbach, 2013) ...19
Table 7: Multi-criteria evaluation about insight in research topic ...41
Table 8: Multi-criteria evaluation design and usability ...41
Table 9: KPIs for assessing service contracts ...48
Table 10: Search strings ...52
Table 11: Inclusion criteria ...52
Table 12: Exclusion criteria ...53
Table 13: Search results Scopus ...53
Table 14: Search results Web of Science ...53
Table 15: Literature list ...54
Table 16: Covered perspectives by articles ...55
© ASSA ABLOY, All rights reserved
1
1. Introduction
In chapter one the company where the bachelor project is done for is introduced. The problem faced by the company is explained and the to be used research methodology is elaborated on. In addition, research questions are made to solve the core problem stated in this chapter.
1.1 Introduction to the company
ASSA ABLOY Entrance systems is a global leader in door opening solutions. The company has several decades of experience in producing automatic entrances for both pedestrian and industrial purposes.
The office of ASSA ABLOY entrance systems in Ede has a customer service department that handles all the problems customers encounter with their automatic entrances.
The company offers different kind of service contracts which go from bronze to gold++. Where the bronze contract has the least service covered and the gold++ has the most service covered.
In table 2 an explanation is given on the gold contracts, since that are the contracts that are important for this research.
1.2 Problem statement
The customer service department of ASSA ABLOY entrance systems in Ede is becoming busier and busier. The number of customers calling increases. This increased amount of calling customers to the customer service department make costs higher. To identify whether the situation of more calling customer to receive service is negative or positive, data will be analysed. By making data visible the directors and managers of the company can make decisions based on the visualisation of the data.
The company already analysis data to get insight in how they perform. But the
relationship between the customer service department and their service contracts needs more attention. Within the company a lot of data is available. To analyse the data several KPIs will be used to gain insight. The chosen KPIs must give insight in the performance of the service contracts the company offers and the behaviour of customers towards the customer service department. The insights can then be used to adapt the strategy of the company to reduce costs and create better agreements in the service contracts.
1.2.1 PROBLEM SCOPE
The scope of the project will be on customers with pedestrian entrances which are entrances where only people go through, since the sales office of that division is located where the bachelor thesis is executed. There are ten weeks available for this research, therefore a scope is determined.
[image:11.595.315.503.276.356.2]The focus of this bachelor thesis is on the reporting behaviour of customers about the malfunctions of their automatic entrances and the gold contracts issued. The costs that are made by the company to solve the malfunctions of the customers are only covered in the gold service contracts and not in other contract forms. These other contracts only provide periodic maintenance activities.
© ASSA ABLOY, All rights reserved
2
A customer with a gold contract pays a fixed amount for the contract per year. The more a customer with a gold contract reports for malfunctions of their installations, the higher the cost will be for the company.
© ASSA ABLOY, All rights reserved
3
Figure 2: Problem cluster
1.2.2 THE CORE PROBLEM
A problem cluster is made to identify the core problem. In the problem cluster the causal relations between the problems within the company are shown. In the top of the problem cluster the core problems are shown. It is important to focus on the core problem that is influenceable. All three paths in the problem cluster create higher costs.
The old intake system that logs the incoming calls about the malfunctions of customers, creates higher cost due to the fact that the problem of the customer is not well identified. The new service engineers are not able to solve the problems, therefore a new visit must be planned. The high amount of new service engineers also creates higher costs. The new service engineers often do not have the right skills to solve the problems of customers. The problems of the old intake system and the high amount of new service engineers cannot be solved in this bachelor thesis. The problem of no data visualization is influenceable. Therefore, the core problem that needs to be solved in order to decrease costs is:
There is no data visualization of the behaviours and characteristics of customers with service contracts towards the customer service centre.
© ASSA ABLOY, All rights reserved
4
1.3 Motivation for the research
The reason for starting the project is that the manager of the customer service department noticed that the incoming reports at the customer service department are rapidly growing. This trend has effects such as longer queues at the customer service department and increased costs.
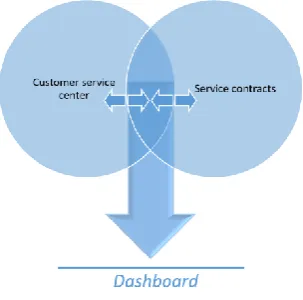
The behaviour of customers and the turnover that are generated with the different service contracts differ a lot. Expectations of the managers that customers with gold contracts are calling more than other contract forms determines the scope of the project. Now they asked to visualize the data concerning this topic. So, the goal of the research will be to get the relationship between the
customer service centre and the service contracts visualised with the help of dashboards. In figure 3 the relation between the customer service centre and the service contracts is shown.
1.4 Problem solving approach
In this section a method to solve the core problem is described. A problem-solving approach is used to have a systematic approach to solve the core problem. In order to find a solution to the core problem a problem-solving approach is chosen and followed.
1.4.1 RESEARCH METHODOLOGY
[image:14.595.391.543.187.337.2]The research methodology chosen to solve the core problem is design science. Design science includes the following steps (Peffers, Tuunamen, Rothenberger, & Chatterjee, 2007):
Figure 4: Design Science Research Methodology (Peffers et al., 2007)
The design science research methodology is chosen because, in this project a dashboard will be made. Therefore, the design science research methodology is more appropriate than the managerial problem-solving method (Heerkens et al., 2017), because in this research methodology there is no step such as design and development included. Therefore, it is hard to use the MPSM in this type of project. So, the design science research methodology is better applicable than the MPSM in this study.
Step 1. Identify problem & motivate
In the first step the problem is identified. First, all the problems within the company are summed up. After that, the relationships between these problems are made in a problem cluster. By applying the four rules of thumb described by (Heerkens et al., 2017) to this problem cluster the core problem is identified. In chapter one the first step of the DSRM is followed.
Table 1: Legend problem cluster
[image:14.595.68.527.542.577.2]© ASSA ABLOY, All rights reserved
5 Step 2. Define objectives of a solution
The second step of the DSRM determines the objectives of the dashboards that will be made and the desired situation according to the company is described. In chapter two the current and desired situation of the company is given. Chapter three provides a theoretical framework that provides the information that is necessary for this research.
Step 3. Design and development
In the third step the design and development of the dashboard will be executed. In this stage, the data will be gathered and prepared to be able to design the dashboard. Chapter four describes all the KPIs that are chosen to use in the dashboards. In chapter five all the steps taken to design and develop the dashboards are described and
explained.
Step 4. Demonstration
In the fourth step the prototype will be demonstrated with the help of screenshots. The demonstration of the prototype will be about what the prototype measures and how it can be used. In chapter six the demonstration of all the dashboards created is provided.
Step 5. Evaluation
In the fifth step the prototype will be evaluated. The feedback and opinions of the company will be described. In chapter six a multi-criteria evaluation on the dashboards by employees of the company is given.
Step 6. Communication
In the last step the product of this research will be communicated with other researchers and the relevant target audience. The evaluation described in step five will help to
communicate the research and to describe the limitations. Recommendations for further research are also given.
1.4.2 THE RESEARCH GOAL
The research goal is to get insight in the reporting behaviour of customers with gold contracts. With the help of this insight, managers can have negotiations with customers that have unhealthy reporting behaviours. The management can improve their contracts with the help of the visualised data. Incentives or disincentives can be created to
influence the behaviour of the customers with gold contracts.
1.4.3 THE RESEARCH QUESTIONS
Research questions are formulated to solve the core problem. First, the current situation should be made clear, then it is important to look at performance measurement. The data that is gathered needs to be prepared and the preferences and needs of the management team must be detected. Afterwards a literature study on the selection of KPIs will be done, KPIs can then be determined. When the literature reviews are done and KPIs are chosen, the dashboard can be created and the design of the dashboard can be determined. In the end the management team should be able to use the dashboard.
The main research question is:
How to gain insight into customer behaviour and the performance of the gold service contracts owned by the customers?
© ASSA ABLOY, All rights reserved
6 1. What is the current situation within the company?
First, the current situation within the company must be clear to be able to know how the company currently acts and handles towards different customers. If the current situation is clear, a more precise way to improve this process is easier. Also, the difference
between the norm and reality can then be shown. This first research question will give insight in how the company currently acts. Insight in the current negotiations and decisions making process concerning the service contacts are provided.
This research question can be answered by interviews with the manager of the customer service centre and employees that sell service contracts. By writing down the strategies and the way they currently work, an insight can be obtained to see what the current situation is.
2. How can performance measurement be used to track the progress of the company?
Performance measurement keeps track of the progress of the business. The balanced scorecard is used to show different perspectives that can help to choose the right
strategy. A link will be made with the KPIs and the different perspectives of the balanced scorecard. In addition, other performance measurement perspectives than the balanced scorecard are given.
To answer this research question, literature on performance measurement will be used. Especially the balanced scorecard will be used to show how KPIs are performing in different perspectives.
3. How to clean and prepare the data from different datasets?
To combine different datasets and to make the data as valid as possible several steps must be taken. When the data is prepared, cleaned and made valid, it can be used for the dashboard.
This research question can be answered by al literature study and interviewing the financial manager and the program manager of the company. First a scope must be determined, then the data that is not relevant can be removed.
A literature study on several dimensions of data quality is done to clean and prepare the data. Afterwards the data can be used into the dashboard.
4. What KPIs should be selected in the dashboards?
This research question is about the KPIs that must be included in the dashboards
according to literature and the management team. The literature review is done to show the available KPIs in literature that can measure the financial performance of service contracts. The literature review looks also at KPIs about the behaviour of customers with service contracts. The already existing KPIs that are in literature should be evaluated to determine the usability of these KPIs in this research.
The interviews with the managers of the company are needed to get insight in what KPIs they need to get the relationship between the service contracts and the customer service department clear.
To answer this research question, a systematic literature review will be done. Based on literature and managers needs a KPI selection can be made. The opinions of the
© ASSA ABLOY, All rights reserved
7 5. How should the design of the dashboard look like according to literature?
In the design and development phase, several aspects of how a dashboard must look like to be able to make the best use of it should be considered. For example, which options to select from and what charts display the data the best.
For this research question a literature review will be done to ensure the usability of the dashboard. To ensure that the data is clearly visible and usable, the dashboard should be clear. The brand style of the company will be kept in mind considering the design of the dashboard.
6. What is the effect of different service packages on customers?
With this research question more insight is gained in what effects different service packages have on the behaviour of customers according to literature. To get a good understanding on what effects service packages have on customers, a better
recommendation can be given with the help of the created dashboards.
This research question will be answered by doing a literature study and interviews with employees of ASSA ABLOY. Based on articles from literature an understanding of the effect of service packages can be obtained. This research question will also be answered by interviewing the sales director and an employee of contract sales. The director service sales will be interviewed, to get a better understanding of how different customers
behave with different service contracts.
7. How should the dashboard be used?
The dashboard should fit the company. The dashboard should perfectly target the needs of the management team. Also, the program in which the dashboard is made should be available to the employees, it must be in line with the current programs used. The way in how the company should use the dashboard to discover possible improvements in their service contracts and customers is considered in this research question.
This research question will be answered by having interviews with the manager of the customer service department and the service sales director. To be able to analyse the data visualisation in the dashboards in the best way, a clear description must be made.
1.5 Norm and reality
It is needed to determine a norm and reality to see whether the solution provided to the company reached the norm. It is important that the norm and reality can be measured. To be able to measure the norm and reality, indicators are needed. A multi-criteria evaluation will be done in the end to show the difference after the implementation of the solution.
In the current situation there is no data visualisation of the characteristics and
behaviours of customers with their contracts. When the data is visualized with the help of KPIs in dashboards, insights in the characteristics and behaviours of customers are generated and can then be used to give recommendations to the management team of the company. The goal of this project is to give the management team insights to be able to act in the best possible way towards customers with service contracts.
© ASSA ABLOY, All rights reserved
8
2. Current and desired situation
In this chapter the first research question: ‘‘What is the current situation within the company’’ is answered. In section 2.1 the current situation within the company is described and an explanation of the relationship that is researched is given. The desired situation is discussed in section 2.2.
2.1 Current situation
In this research the relation between the service contracts of the company and the logged malfunctions of the installations of customers is made. To understand what the two aspects entail an explanation is given on the gold service contracts and the logged malfunctions of customers. It is important that the two aspects are well explained to understand the relation between the two.
ASSA ABLOY entrance systems offers different types of service contracts to customers. The focus of the bachelor assignment is on gold contracts. Within the type gold contracts three distinctions are made. The three different gold service contracts with their
characteristics are shown in table 2. Further on in this thesis, only gold contracts will be referred to. The data used in this research is not divided into Gold, Gold+ and Gold++, but only in gold contracts.
Table 2: Explanation of gold contracts
Second part
name D
Gold Including call out charge and working hours for the execution of periodic maintenance Including call out charge and working hours for malfunctions
Including materials for periodic maintenance and malfunctions
Excluding call out charge, working hours and materials for external causes of malfunctions
Gold+ Including call out charge and working hours for the execution of periodic maintenance Including call out charge and working hours for malfunctions
Including materials for periodic maintenance and malfunctions
Including call out charge, working hours and materials for external causes of malfunctions
Gold++ Including call out charge and working hours for the execution of periodic maintenance Including call out charge and working hours for malfunctions
Including materials for periodic maintenance and malfunctions
Including call out charge, working hours and materials for external causes of malfunctions
© ASSA ABLOY, All rights reserved
9
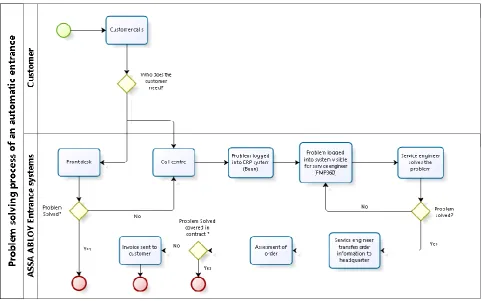
ASSA ABLOY entrance systems has a customer service department which handles all the reported malfunctions of the entrances of customers. The malfunctions of the customers are logged into the system at the customer service department. After a malfunction is logged into the system a service engineer will solve the problem of the installation of the customer. Afterwards an invoice will be sent to the customer which depends on the type of contract the customer has. The gold contract only gets an invoice when the cause of the malfunction is an external cause. The gold+ and gold++ contract cover also the costs for external reasons of malfunctions.
To better understand the process from a customer calling for help and have their problem solved in the end, a BPMN model is given in figure 5 to visualize this process.
To get a better understanding of how contracts are given to customers interviews were arranged with an employee of contract sales and the service specialist. These interviews gave several criteria to determine a contract type of a customer. In table 3 a list of all the criteria is given.
Having a long-term relationship with customers was the first thing the seller of the contracts mentioned. According to the employee from ASSA ABLOY a contract is not beneficial when it is not for the long term. To keep a customer for the long term a good set of adaptive service packages must be chosen for the customer. The service contracts given to automatic entrances of the customers depend on different aspects.
Table 3: Criteria to determine contract type of a customer
Criteria Explanation
[image:19.595.72.555.199.500.2]Ratio maintenance costs/ purchase price when maintenance cost is high and the new price of an entrance is low, entrances tend to be replaced faster.
© ASSA ABLOY, All rights reserved
10
Criteria Explanation
Frequency of usage When the frequency of usage is high, more service is needed to keep the entrance running.
Importance of the installation An important entrance such as an entrance of a room for surgery, needs a contract that makes sure the entrance is always running.
Mindset of customer When an advice is given to the customer, the mindset of the customer must also be considered.
Amount of entrances of customer Customers with a high amount of entrances often get discounts. Age of entrance(s) Old entrances (often) do not get
all-inclusive contracts which are known as gold contracts.
Type of customer The amount of risk a customer takes
depends the contract type.
Type of entrance The type of the entrance determines the
amount of service needed. Ratio of Cost of Maintenance/ Price of
installation When the costs to maintain a certain installation exceeds a certain value, the installation often does not get a service contract.
2.2 Desired situation
The ideal situation for the company is that they can predict how much malfunctions a customer will report. Then a perfect adapting contract can be made that optimises the margin on a particular customer. Of course, it is not possible to perfectly identify future customer behaviours and characteristics. Therefore, it is important to learn from the past. A selection of KPIs is made to measure the performance of the contracts and the reporting behaviour of the customers. The created dashboards give insight in the relationship between the reported malfunctions of customers with gold contracts. The insights the dashboards provide is on the type of entrances and the order type of the reports.
The negotiations of future customers must be made easier. The goal in this research is to give more insight into the behaviour of customers with gold contracts to create better negotiations and agreements with future customers.
© ASSA ABLOY, All rights reserved
11
3. Theoretical framework
This chapter answers several research questions. The research questions where literature is needed for to answer them is given in this chapter. This theoretical framework
describes all the theory that is necessary to guide the whole research process. First theory on performance measurement is used to allocate the KPIs form literature into different perspectives. Afterwards, theory on data management is provided to be able to prepare and clean the data in this research. Also, theory on the design of a dashboard and the graphs that can help display the data is given. Lastly, theory on service packages is given to get insight in what effect service packages have on customers. Section 3.1 answers research question 2. In Section 3.2 the answer is given to research questions 4. Section 3.3 answers research question 3 and section 3.4 answers research question 5. In Section 3.5 the answer is given to research question 6.
3.1 Theory on performance measurement
The theoretical perspective is performance measurement. Performance measurement is about tracking the performance of an organization. The key elements of this performance measurement is its focus on program results rather than the physical outputs that an agency provides (Hatry & Bryant, 1998).
The balanced scorecard is used to distinguish different perspectives of performance measurement. Within the balance scorecard four different perspective are available. Namely: the financial perspective, internal business perspective, innovation and learning perspective and the customer perspective. The balanced scorecard is like the dials in an airplane cockpit: it gives managers complex information at a glance (Kaplan & Norton, 1992). These four different perspectives will be considered while selecting the KPIs applicable to this research from the articles.
The balanced scorecard gives a balanced representation of financial and operational measures. The financial measures are complemented with customer, internal processes, innovation and improvement activities. It is important that the focus should be on multiple activities and not only on the financial aspects.
The first perspective is about the customers. This perspective is about how to give value to customers. The company should set goals to improve the value for the customer. Evaluation of the customers opinions should be gathered to get an impression of how the customers thinks about the service a company provides. Four types of measures are considered in the customer perspective which are about time, quality, performance and service.
The second perspective elaborates on the internal business. This perspective tells what must be done internally in the business to serve the customers. The focus in the business should be on the processes, decisions and the actions within the organization.
Information systems can help to boost improvements and detect problems.
The third perspective concerns innovation and learning. Continuous improvement is needed to grow the value of the company. Revenues and margins can be improved with the help of new products and services. New markets can be tapped into when new or improved products or services are established.
© ASSA ABLOY, All rights reserved
12
The balanced scorecard approaches performance measurement with the relationships of the four perspectives. The relationships between these four perspectives is important. For example, financial performance depends on the other three relating perspectives. The decision-making process of managers can be improved by not only focusing on the
financial performance but also on the other aspects.
Measures should focus on the four perspectives of the balanced scorecard. Performance measurement traditionally has the focus on the financial perspective according to Kaplan & Norton (1992). The balanced scorecard shows that measures on the three other
aspects are important, because there is a relationship between the perspectives. When in one aspect improvements are made, the other perspectives can be positively influenced. To track the performance or progress of a company measures of the four perspectives of the balanced scorecard should be considered.
In addition to the balanced set of measures retrieved from the balanced scorecard from Kaplan & Norton (1992), more essentials of performance measurement are given by Moulin (2004). Measures that are imported to different stakeholders and staff should be considered since they are executing plans within the company. Outcome and process measures should be included. The amount of measures should be cost effective to be able to be valuable. Finally, the measurement system needs to have to focus on continuous improvement (Moulin, 2004).
Alternatives to the perspectives of the balanced scorecard are also discussed. The other perspectives will help to understand where the success of a company can come from. To get an understanding of how performance measurement can help the success of a company, different perspectives are looked at. With the help of several perspectives an insight is obtained in how success is determined.
Another performance measurement perspective is described by Lakhal (2009). The three different perspectives of this framework are quality, competitive advantage and
organizational performance. The focus of this framework is on these three perspectives. Many companies have improved the quality of their products and services in order to enhance organizational performance and to be competitive (Lakhal, 2009).
The first perspective is on the quality of the service or product provided by the company. In this research the quality of the service is important. Quality is perceived differently by customers, therefore Lakhal (2009) defines quality of products in different ways. Garvin (1987) describes eight different quality dimensions. The most important two of the eight in this research is serviceability and reliability. Serviceability is important because the capability of the company to deliver a good service is important to the customer. The reliability of the installation of the company is also important, because a reliable product tends to break down less often than an unreliable installation. The combination of these two quality dimensions described by Garvin (1987) are of importance in this research.
The second perspective of Lakhal (2009) is on competitive advantage. Competitive advantage is the extent to which an organization is able to create a defensible position over its competitors (Porter, 1985).
Two models that are described by Lakhal (2009) are the market-based model and the resources of a firm. The market-based model is about cost and differentiation. The second model focuses on the firm’s resources and is driven by factors that are internal to the firm (Lakhal, 2009). The reduction of cost and the differentiation of a product or service can give a competitive advantage. The second models show that a competitive advantage can arise from internal factors of a firm.
© ASSA ABLOY, All rights reserved
13
approach to performance measurement using solely financial performance measure is flawed (Tangen, 2004).
The research of Lakhal (2009) shows the importance of the three perspectives
mentioned. According to Lakhal (2009) the quality enhances the other two perspectives. Therefore, a good quality of the installations of a company are of great importance to boost organizational performance and competitive advantage of the company.
Khan, Chaabane, & Dweiri (2019) describes long-term and short-term decisions. Performance measurement is critical to the success of the Supply chain (Khan,
Chaabane, & Dweiri, 2019). The success of a company depends on short-term and long-term decisions. Long-long-term decisions making is strategical and tactical. The strategic level includes decisions that have a long-lasting effect on the firm (Khan et al., 2019). Short-term decisions making is on operation level. These are all the decisions a company has to make on a daily level.
The two perspectives described by Khan et al. (2019) show the importance of focusing on both long-term and short-term decision making. Khan et al. (2019) states that the
relationship of the two perspectives allows decision makers to see the impact of their decisions.
All the perspectives explained in this section give different insight in how to measure the success of a company. The solution created in this research should consider the different perspectives to give a balanced overview of the whole company.
[image:23.595.65.532.435.625.2]In table 4 an overview is given of the source from literature and their perspectives.
Table 4: Overview of perspectives by source from literature
Article Perspectives
(Kaplan & Norton, 1992) Financial
Internal business
Innovation and learning Customer
(Moulin, 2004) Stakeholders & Staff
Outcome & Process measures Cost effectiveness
Continuous improvement
(Lakhal, 2009) Quality
Competitive advantage Organizational performance (Khan, Chaabane, & Dweiri, 2019). Long-term decisions
Short-term decisions
3.2 Theory on KPI selection
© ASSA ABLOY, All rights reserved
14
3.2.1 SELECTING THE KPIS
Four articles have been selected out of the systematic literature review. Out of these articles KPIs are selected that are relevant to solve knowledge question 4. Thereby KPIs are chosen that the management of the customer service department wanted into the dashboard. The KPIs are divided under the perspective of the balanced scorecard of Kaplan & Norton (1992).
To determine the right KPIs to visualise the relation of service contracts and customer behaviour, it is important that different approaches on the kind of relationship with a customer is gained insight in.
An approach described by Akkermans, H., van Oppen, W., Wynstra, F., & Voss, C. (2019) is collaborative service design. According to this article collaboration of buyer and
provider is needed. The close collaboration made the two parties both committed. Since problems often must be solved by both parties, the close collaboration is important to optimise the service process. The key performance indicators chosen from Akkermans et
al. (2019) mainly focus on the cooperation performance of the two parties. The
relationship described concerns the IT business and in this bachelor thesis it concerns a company that provides automatic entrances. Therefore, the applicability of the KPIs out of this article to the company where this research is done should be closely looked at.
Mourtzis, D., Fotia, S., Vlachou, E., & Koutoupes, A. (2018) describes a product service
system and gives a framework of how a product service system must look like. Three aspects are involved in the product service system which are the KPI, lean rules and feedback provided by the customers. These three aspects are needed to make a good dashboard of the customer service contracts performance and behaviour according to Mourtzis et al. (2018).
KPIs for maintenance purposes where depicted from the article. Mourtzis et al. (2018) displays the importance of the improvement of a product-service system and not only on issues concerning this system. Also, a clear framework of KPIs for product-service
systems is provided, which can be used in the dashboards.
Legnani, E., & Cavalieri, S. (2009) describes an after-sales service system. Satisfaction and, hopefully, loyalty have a significant influence on the company profitability (Legnani,
E., & Cavalieri, S. , 2009). A company must work closely together with other parties to
provide the service to the customers. Legnani, E., & Cavalieri, S. (2009) gives KPIs to measure the performance of this relationship and the importance of the performance measurement system with their actors by a set of KPIs is explained. Also, the variety of the KPIs which say something about reliability, responsiveness, agility, assets, costs and growths are given by Legnani, E., & Cavalieri, S. (2009). These different types of
perspectives are customer, service-network and the company perspective. The relation between all the perspectives of after sales systems with correlated KPIs helps to
understand what positive and negative effects indictors have on each other.
Fugini & Siadat (2010) describes that service systems have an influence on the business processes. Five major phases: (1) Identifying KPI, KGI and IT infrastructure parameters; (2) SLA Contract creation; (3) Evaluation and monitoring; (4) Adaptation; (5) Contract Update(Fugini & Siadat, 2010). The third step contains monitoring. By monitoring the execution of the processes of the business, an optimisation of the contract is possible. Fugini & Siadat (2010) gives several KPIs which are shown in table 5.
Akkermans et al. (2019) focuses on the performance of the cooperation between the
© ASSA ABLOY, All rights reserved
15
service contracts. The KPIs given from this article have the goal of monitoring and adapting service contracts to make improvements.
In conclusion, the articles give insight in the relation in service systems and provides KPIs that are relevant to this topic. The combinations of the four articles show the importance of the collaboration of the customer and service provider. Thereby the improvement of a service system is discussed and different perspectives are given. All these aspects give an overview of what KPIs and collaboration issues are important to take into consideration the relation between customer and service supplier.
In table 5 all the KPIs from literature out of section 3.2.1 that can measure the performance of the customer service centre and the different service contracts are shown.
Table 5: KPIs selected from the articles
Financial perspective Internal business perspective Learning and innovation
perspective Customer perspective. Title and source
Contracting
outsourced services with collaborative key performance indicators
(Akkermans et al., 2019)
Cost
reduction Fulness of file systems First time right Prevention
Customer order changes
Customer satisfaction
Revenues Work pressure Quality Customer queries
Customer calls
A Lean PSS design and evaluation framework supported by KPI monitoring and context sensitivity tools
(Mourtzis et al. ,2018). Corrective maintenance costs Amount of preventive maintenance activities Actual maintenance time Percentage of maintenance rework Maintenance effectiveness
Exploring the causal relationships of KPIs in after sales service systems
(Legnani & Cavalieri, 2009)
Fraction to
invest Assist agility Quality of investments New customers
Return on
assist assets Loyalty
Revenue Responsiveness Recruitment Rate
Assist operating income
Pending
© ASSA ABLOY, All rights reserved
16 Financial
perspective
Internal business perspective
Learning and innovation
perspective Customer perspective.
Spare parts costs
Reliability of the firm
Non-monetary costs
Growth Agility Product-service quality
perceived
Planned request rate
Unplanned request rate
SLA Contract for Cross-Layer Monitoring and Adaptation
(Fugini & Siadat, 2010)
Price Service Level Reputation Response Time
Cost Availability Acceptable Downtime
Downtime
3.3 Theory on data quality, preparation and cleaning
The used KPIs from both literature and interviews can be measured accurately when the quality of the data is ensured. Several steps are needed to provide the quality of the data to be able to use it for a dashboard. In this section literature is given to be able to
increase data quality.
3.3.1 QUALITY OF THE DATA
© ASSA ABLOY, All rights reserved
17
A conceptual
framework about data quality is described by (Wang & Strong, 1996). The framework is a hierarchal
framework with four different roots. The four different categories are intrinsic data quality,
contextual data quality,
representational data quality and
accessibility data quality.
Intrinsic data quality is about accuracy and objectivity. It is important that the data is interpret in the right way, therefore the objectivity must be guaranteed. The believability and reputation are also important according to (Wang & Strong, 1996). Accuracy and objectivity alone are not sufficient for data to be considered of high quality (Wang & Strong, 1996).
Contextual data quality considers that data must be within the context of the task that has to be executed. The type of task and the data user itself tell whether the data is of high quality or not. Data quality is perceived differently in other situations, therefore it is important to consider the context.
Representational data quality regards the format of the data. The data must be
understandable and interpretable. The data can be better understood when it is concise and consistently represented.
Accessibility of data is important for a user. Wang & strong (1996) found that data consumers on computers see accessibility as an important aspect of data quality.
The conceptual framework of (Wang & Strong, 1996) shows four important categories of data quality. The four categories give insight on what high data quality is.
3.3.2 CLEANING AND PREPARATION OF THE DATA
To ensure valid data and high-quality data, cleaning and preparation is needed. The purpose of data cleaning (data scrubbing) is to detect and remove errors and
inconsistencies from data in order to improve their quality (Cai, L., & Zhu, Y. 2015).
The data quality standard is composed of five dimensions of data quality - availability, usability, reliability, relevance, and presentation quality (Cai, L., & Zhu, Y. 2015).
First, the
availability of the data is looked at. The availability of data depends on the
accessibility and the
authorisation.
[image:27.595.73.523.65.258.2]due to Figure 7: Five dimensions of data quality (Cai, L., & Zhu, Y. 2015)
[image:27.595.96.525.639.752.2]© ASSA ABLOY, All rights reserved
18
confidentiality it is possible that data is not available for usage. When a person is not authorized by a company, the data is not accessibly.
Second, the usability of the data depends on whether the values in the data are usable or not. The acceptability of the data should be considered. The data that is outside of the acceptability of certain values that has been determined is not usable.
Third, the reliability of the data depends on several aspects. Consistency of the data is important to have the same values over a whole data set. Also, the consistency between different data sets is important. The data can then be combined. Data completeness is important to be able to use the data. Missing data decreases the insight in the overall dataset.
Fourth, another dimension of data quality is the relevance. Relevant data is about the data fitting the needs of the research. The amount of the data is also important for the relevance.
Lastly, the presentation quality is looked at. The data must be understandable and readable. Structured data increases the ability to understand the data.
Sidi et al. (2012) describes two strategies to improve the data quality. The two types are data-driven and process-driven. Data-driven is strategy for improving the quality of data by modifying the data value directly (Sidi et al., 2012). Techniques to improve the data quality described by Sidi et al. (2012) are: acquisition of new data, standardization or normalisation, error localisation and correction. Process-driven is another strategy that redesigns the process which is produced or modified data in order to improve its quality (Sidi et al., 2012). The two main techniques used according to Sidi et al. (2012) are process control and process redesign.
In practice, it has been generally found that data cleaning and preparation takes approximately 80% of the total data engineering effort (Zhang, Zhang & Yanh, 2003). This shows that the cleaning and preparation of the data takes a lot of time. Data that is not well prepared and cleaned creates several issues: (1) disguising useful patterns that are hidden in the data, (2) low performance, and (3) poor-quality outputs (Zhang, Zhang & Yanh, 2003). By cleaning and preparing data, better quality of the data is obtained. It must be possible to prepare quality data from the raw data to enable efficient and quality knowledge discovery from the data given (Zhang, Zhang & Yanh, 2003).
In this section five standards of (Cai, L., & Zhu, Y. 2015) are described about the quality of data. To improve and clean the data, these five dimensions of data quality must be kept in mind. (Sidi et al., 2012) describes two strategies to improve data quality. (Zhang, Zhang & Yanh, 2003) gives several issues that bad quality data creates.
3.4 Theory on BI-dashboard design
To draw the right conclusions from a dashboard not only the right KPIs should be
selected, but also a close look must be taken to the design of the dashboard. The chosen KPIs can be visualised by a lot of different charts and graphs. In this section an overview is given on what the design of a dashboard must look like to ensure better interpretations and visibility.
To determine the best design of a dashboard several things must be considered. First, the management team must be considered. The managers are the one that are going to use the dashboard. The combination of literature and the outcomes of the interview with the manager of the customer services determines the design.
© ASSA ABLOY, All rights reserved
19
Third, the way in how the different charts and graphs are set out on the page is important.
3.4.1 CHARTS AND GRAPHS
When a clear need of the management team is determined and the data is ready to use, charts can be made from this prepared data.
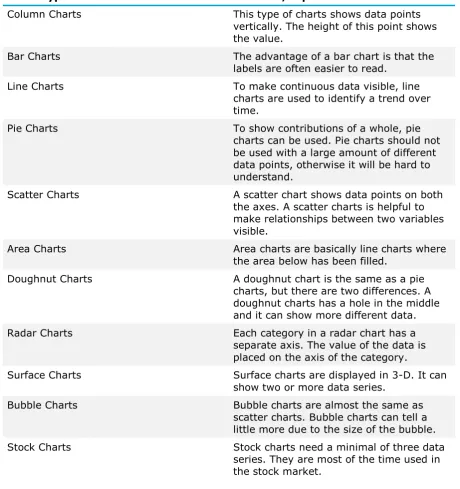
[image:29.595.68.529.233.723.2]A set of charts described by Alexander & Walkenbach (2013) with their purpose is shown in table 6.
Table 6: Chart types (Alexander & Walkenbach, 2013)
Chart Type Function/Explanation
Column Charts This type of charts shows data points
vertically. The height of this point shows the value.
Bar Charts The advantage of a bar chart is that the
labels are often easier to read.
Line Charts To make continuous data visible, line
charts are used to identify a trend over time.
Pie Charts To show contributions of a whole, pie
charts can be used. Pie charts should not be used with a large amount of different data points, otherwise it will be hard to understand.
Scatter Charts A scatter chart shows data points on both
the axes. A scatter charts is helpful to make relationships between two variables visible.
Area Charts Area charts are basically line charts where
the area below has been filled.
Doughnut Charts A doughnut chart is the same as a pie
charts, but there are two differences. A doughnut charts has a hole in the middle and it can show more different data.
Radar Charts Each category in a radar chart has a
separate axis. The value of the data is placed on the axis of the category.
Surface Charts Surface charts are displayed in 3-D. It can
show two or more data series.
Bubble Charts Bubble charts are almost the same as
scatter charts. Bubble charts can tell a little more due to the size of the bubble.
Stock Charts Stock charts need a minimal of three data
© ASSA ABLOY, All rights reserved
20
3.4.2 THE LAYOUT OF THE DASHBOARD
It is crucial that the dashboard features (visual and functional) and the contents fit with the dashboard purpose (Vilarinho, Lopes, & Sousa, 2018).
There are several aspects that need to be taken into account when considering the layout of the dashboard.
End users such as executive members can only perform simple filtering and layout changes in most of the cases(Chua et al., 2018). So, it is important to keep the dashboard simple to make sure managers can easily use the dashboards. Kwapien (2018) defines several design principles.
First, not all the information has to be on the same page, using several dashboards can make the information come across easier.
Second, not too much different colours must be used to enhance the attention.
Third, providing context is important to show whether the data is normal or not. Colours can be added to a value to understand the value better. Also, comparisons values help to understand whether a certain value is normal or not.
3.4.3 USABILITY OF THE DASHBOARD
The ISO standards defined usability as the software's capacity to be understood, learned, used, and to be attractive to the user in specific use conditions (Dyczkowski, Korczak, & Dudycz, 2014). Usability enables the users to easily access BI functionalities and it ensures developers and administrators a high productivity (Golfarelli, 2009). The four basic principles on usability according to the ISO are: ease of learning, ease of use, flexibility and robustness.
Gulati (2016) describes several ways of creating a usable dashboard. First, the consistency is important. Words and actions on a dashboard should mean the same. Second, errors should be prevented. When a user of a dashboard performs an action, the action should not generate an error. Third, a minimalistic design can help to only show the relevant information on a dashboard.
3.5 Theory on service packages
Over the last several decades, leading-edge firms, as well as many business scholars and consultants, have advocated the need for refocusing substantial firm activity or
transforming the entire firm orientation from producing output, primarily manufactured goods, to a concern with service(s) (Vargo & Lusch, 2008).
The common justification is that these initiatives are analogous with the shift from a manufacturing to a service economy in developed countries, if not globally (Vargo & Lusch, 2008). The question asked by the article of Vargo & Lusch (2008) is whether this trend is positive or not to a company’s success. First the focus was only on the output of products, whereas now the focus is also on service.
Vargo & Lusch (2008) states that collaborations and partnerships with customers are of importance in business to business marketing. The relationships create strong ties amongst companies. According to (Vargo & Lusch, 2008) when service is seen as a process instead of the perception of output of units, the locus of value creation, then moves from the “producer” to a collaborative process of co-creation between parties (Vargo & Lusch, 2008).
Hadayati, Ginting & Nasution (2018) describes the behaviour of customers choosing a service provider, this article is used to understand what decisions customers make in choosing a certain provider of service. Hadayati et al. (2018) describes the
© ASSA ABLOY, All rights reserved
21
Customers have different preferences on what kind of service they want to receive. When the behaviour of customers is known, a better adaption in offering the service can be given. Customers focus on different aspects of service such as the quality of service and the price of the service according to Hadayati et al. (2018). The culture of the customer also depends preferences in what kind of service they want. Applicable criteria given by Hadayati et al. (2018) that give additional insight are satisfaction, price, quality & speed and influence of circumstances. All these criteria have an influence on customer
behaviour.
Satisfaction and image of the company are a big factor on the decisions of customers (Hadayati et al., 2018). Also, the quality is important to customers. The price and the extern influences do not have that much influence on the behaviour of the customers according to (Hadayati et al., 2018). Satisfaction is of great importance to have a long-term relationship with customers.
In business markets, suppliers often create customized service packages (CSPs) to avoid difficult pricing decisions or tedious negotiations (Steiner, Eggert, Ulaga, & Backhaus, 2014). The suppliers of complex goods in business markets allow their business customers to choose the service elements they need and want for their specific applications (Steiner et al., 2014). So, the customer voice is of great importance choosing the amount of service a customer wants.
The literature in this section provides an insight of what effect service packages have on customers. The insight obtained help to understand the service contracts of the company better. There is a shift in companies providing services next to their output of products. When this service is seen as a process, relationships and partnerships between
businesses are developed. The difficult negotiations and decisions parties have to make are easier with service packages. The behaviour of customers choosing a service provider in the telecommunication business is mostly about the quality of the service. Customizing the service packages to customers target the needs and desires of customers.
All the insights obtained from the literature in this section helps this research to
© ASSA ABLOY, All rights reserved
22
Chapter 4. KPIs in the dashboards
In chapter 4 the KPIs used in the dashboard are explained. This chapter answers research question 4: ‘‘What KPIs should be selected in the dashboards?’’.
4.1 Selected KPIs in the dashboards
To measure the performance of customer service contracts and the behaviour of
customers several KPIs have been chosen. Both the literature review and the interviews with the management team of the company provided a selection of KPIs which could be used in the dashboard.
List of requirements of the management team:
• Visualisation of the financial performance of the gold contract
• Visualisation of the relation between gold customers and their reporting behaviour
• Visualisation of the characteristics of the reports made by gold customers
• Visualisation of the amount of reports of a gold customer
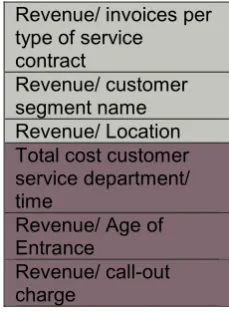
In figure 8 the overall KPI selection is given. The KPIs in figure 8 are divided into the following categories: used KPIs in research, KPI not necessary for the research, data not available for this KPI and KPI that gives helpful additional insight. Seven dashboards are developed. In this chapter all the selected KPIs per dashboard are explained and an explanation of the coherence of the KPIs on one dashboard is given.
Financial Customer Learning and Growth Internal Process
Total Sales/ customer # Entrances/ customer # malfunctions per Entrance type
# Of gold contract/ total contracts over time
Total Cost/ customer # Malfunctions/
customer # malfunctions per order type # Innovations in the process
Margin/ customer # Total malfunctions/ # total entrances per customer
# Contracts continued # First time fix
Fee Sales/ customer # Malfunctions over
time per customer # Contract cancelled Time to solve malfunctions Cost per malfunction/
customer # visits/ service contract type # Days materials not available # Materials wasted Sales per malfunction/
customer
# visits/ customer # Unsuccessful visits
Sales upgrades & modernisation/ customer
# visits/ entrance type # Customer complaints
Sales repair/ customer # visits/ age of
entrance Customer satisfaction
Sales planned maintenance/ customer
# Malfunctions /
customer segment # Repeated calls/ time
Cost planned maintenance / customer
Order types/ service
contract type Price of maintenance per year/ price of entrance
Cost upgrades & modernisation / customer
# Malfunctions / age of Entrance