JHEP09(2015)108
Published for SISSA by SpringerReceived: June 4, 2015 Accepted: August 12, 2015 Published: September 16, 2015
Search for heavy lepton resonances decaying to a
Z
boson and a lepton in
pp
collisions at
√
s
= 8
TeV
with the ATLAS detector
The ATLAS collaboration
E-mail:
atlas.publications@cern.ch
Abstract:
A search for heavy leptons decaying to a
Z
boson and an electron or a muon
is presented. The search is based on
pp
collision data taken at
√
s
= 8 TeV by the ATLAS
experiment at the CERN Large Hadron Collider, corresponding to an integrated luminosity
of 20.3 fb
−1. Three high-transverse-momentum electrons or muons are selected, with two
of them required to be consistent with originating from a
Z
boson decay. No significant
excess above Standard Model background predictions is observed, and 95% confidence level
limits on the production cross section of high-mass trilepton resonances are derived. The
results are interpreted in the context of vector-like lepton and type-III seesaw models. For
the vector-like lepton model, most heavy lepton mass values in the range 114–176 GeV
are excluded. For the type-III seesaw model, most mass values in the range 100–468 GeV
are excluded.
Keywords:
Hadron-Hadron Scattering
JHEP09(2015)108
Contents
1
Introduction
1
2
The ATLAS detector
3
3
Object reconstruction and event selection
3
4
Monte Carlo simulation
6
5
Background estimation
7
6
Systematic uncertainties
8
7
Signal and background model
10
8
Results
12
9
Conclusion
17
The ATLAS collaboration
22
1
Introduction
Searches for new particles often utilize decays to electrons or muons, which allow for full
four-momentum reconstruction with a mass resolution better than that achievable using
hadronic or semileptonic decay modes. Dilepton resonance searches led to the discovery of
the
J/ψ
[
1
,
2
], the
Υ
[
3
], and the
Z
boson [
4
,
5
], and they have been used at the CERN
Large Hadron Collider (LHC) to place strong constraints on a variety of new particles such
as additional gauge bosons [
6
,
7
]. Searches for low-mass trilepton resonances have been
used to constrain lepton flavour violation in muon and
τ
lepton decays [
8
,
9
].
High-mass trilepton resonances are motivated by several extensions of the Standard
Model (SM). Vector-like leptons (VLL) are invoked to explain the mass hierarchy between
the different lepton generations [
10
]. They also arise in composite Higgs models [
11
,
12
]
and models of warped extra dimensions [
13
,
14
]. Such leptons have masses much larger
than those of the SM leptons, and are defined as colourless, spin-1/2 fermions whose
left-and right-hleft-anded chiral components have the same transformation properties under the
weak-isospin SU(2) gauge group. Another set of models predicting trilepton resonances is
based on the type-III seesaw mechanism [
15
], which explains the origin of small neutrino
masses through the introduction of heavy SU(2) triplets with zero hypercharge.
JHEP09(2015)108
qq
Z/γ∗ L+
L−
Z l
+
l−
l+
ν, l−, l−
W−, Z, H
(a)
q
q′
W+ L
+
N0
Z l
+
l−
l+
l±, ν, ν
W∓, Z, H
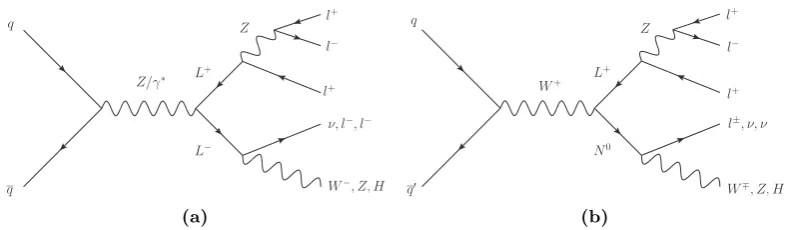
[image:3.595.100.494.97.212.2](b)
Figure 1. Feynman diagrams for the production and decay of new heavy leptons (L±,N0) to final states resulting in a trilepton resonance. Diagram (a) shows the pair production of two charged heavy leptons, and (b) shows the associated production of a charged and a neutral heavy lepton.
in
pp
collisions at
√
s
= 8 TeV at the LHC. This search uses data events with at least three
charged leptons (electrons or muons), two of which are consistent with originating from a
Z
-boson decay. Several signal regions are defined to be sensitive to the pair-production
of heavy leptons that decay to SM leptons and
W
,
Z
, or
H
bosons. The backgrounds,
dominated by SM diboson production, are estimated using Monte Carlo (MC) simulation
and control regions in data, and the predictions are validated in dedicated data samples.
The results of the search are interpreted in the context of vector-like lepton [
16
] and
type-III seesaw [
17
] scenarios in which the new heavy leptons decay through mixing with
electrons or muons (
`
) induced by off-diagonal Yukawa couplings. In the type-III seesaw
model, the masses of the three heavy leptons are assumed to be identical. Feynman
di-agrams of the production and decay of the heavy leptons in both models are shown in
figure
1
. The heavy leptons are produced in pairs through Drell-Yan processes, with cross
sections of roughly 34 fb and 844 fb for the VLL and type-III seesaw models, respectively,
assuming heavy lepton masses of 200 GeV. The difference in the production cross section is
due to the different gauge couplings of the models, as well as the additional neutral fermion
in the type-III seesaw model. The heavy leptons decay via the mixing terms into an SM
lepton and a
W
,
Z
, or
H
boson. The charged states
L
±exist in both models, and have
decay modes to
W ν
,
Z`
, and
H`
; the neutral state
N
0is only present in the type-III seesaw
model, and decays to
W `
,
Zν
, and
Hν
. The charged lepton branching fractions approach
B
(
L
±→
W
±ν
) = 50%,
B
(
L
±→
Z`
±) = 25% and
B
(
L
±→
H`
±) = 25% for
m
L±m
H,
in accordance with the Goldstone boson equivalence theorem [
18
]; at lower masses, the
branching fractions to
H
and
Z
decrease as they become kinematically disfavoured. For
the neutral lepton, the branching fractions to
W `
,
Zν
, and
Hν
are identical to those of
the charged leptons to
W ν
,
Z`
, and
H`
, respectively.
Searches for heavy leptons were previously performed at LEP, excluding vector-like
leptons with masses below
m
L±= 101
.
2 GeV using the
L
±→
W
±ν
decay mode [
19
]. A
search for type-III seesaw heavy leptons was performed by CMS in
pp
collision data at
√
s
= 7 TeV, using non-resonant trilepton signatures to exclude seesaw fermions with
JHEP09(2015)108
2
The ATLAS detector
The ATLAS detector [
21
] is a multi-purpose detector covering nearly the full solid angle
1around the
pp
interaction region. The beam pipe is surrounded by the inner detector (ID),
consisting of silicon pixel and microstrip detectors and a transition radiation tracker. The
ID is enclosed in a superconducting solenoid providing a 2 T axial magnetic field, and
performs charged particle tracking for
|
η
|
<
2
.
5.
The calorimeter system surrounds the solenoid, and consists of electromagnetic and
hadronic components. The electromagnetic calorimeter is a lead/liquid argon (LAr)
sam-pling calorimeter, and comprises a barrel (
|
η
|
<
1
.
475) and two endcaps (1
.
375
<
|
η
|
<
3
.
2).
In the range
|
η
|
<
2
.
5, the detector is finely segmented in
η
to provide good spatial
resolution. The hadronic calorimeter (HCAL) uses steel/scintillator tiles in the barrel
(
|
η
|
<
1
.
7) and copper/LAr in the endcaps (1
.
5
<
|
η
|
<
3
.
2). In the forward region
(3
.
1
<
|
η
|
<
4
.
9), electromagnetic and hadronic calorimetry is performed using copper/LAr
and tungsten/LAr technology.
The muon spectrometer (MS) features high-precision tracking chambers interleaved
with dedicated trigger chambers located in a toroidal magnetic field. The magnetic field
is generated by a system of three large superconducting air-core toroid magnets, with a
bending integral of about 2
.
5 T
·
m in the barrel and up to 6 T
·
m in the endcaps. The
precision tracking is provided by monitored drift tubes (
|
η
|
<
2
.
7), complemented by
cathode strip chambers in the forward region (2
<
|
η
|
<
2
.
7). Triggering is performed by
resistive plate chambers in the barrel (
|
η
|
<
1
.
05) and thin gap chambers in the endcaps
(1
.
05
<
|
η
|
<
2
.
4).
Events are recorded using a three-level trigger system. The first level, implemented
in hardware, reduces the event rate to less than 75 kHz using a subset of the detector
information. The second and third levels are implemented in software, and reduce the
event rate to less than 400 Hz using the full detector information.
3
Object reconstruction and event selection
The data were collected during 2012 using triggers requiring either an electron or a muon
with transverse momentum relative to the beam axis,
p
T, greater than 24 GeV. The
trig-gered electron or muon must also satisfy loose isolation requirements. These triggers are
supplemented by triggers without isolation requirements, but with higher
p
Tthresholds
of 60 (36) GeV for electrons (muons). Only data taken while the ID, calorimeters, and
MS were functioning normally are considered. Events are required to have a reconstructed
primary vertex having at least three associated tracks with
p
T>
400 MeV, consistent with
the beamspot envelope. If more than one such vertex is found, the vertex with the largest
P
p
2Tof its associated tracks is chosen as the hard-scatter primary vertex.
1
JHEP09(2015)108
Electron candidates are selected as energy clusters within a small window of size
∆
η
×
∆
φ
= 0
.
075
×
0
.
125 in the electromagnetic calorimeter matched to a track in the ID.
They are required to fulfil tight identification criteria [
22
], have
|
η
cluster|
<
2
.
47, and not be
in the transition region between the barrel and the endcap calorimeter (1
.
37
<
|
η
cluster|
<
1
.
52), where
η
clusteris the pseudorapidity of the barycentre of the energy cluster. Muon
can-didates are selected as tracks reconstructed in the MS matched to tracks in the ID [
23
] and
are required to satisfy
|
η
|
<
2
.
5. The muon momentum is determined from combining the
information from the two tracks. Muons and electrons are required to have transverse
mo-menta greater than 15 GeV and to be isolated from tracks and calorimeter energy deposits
using the criteria described in ref. [
24
]. To ensure that the lepton track is consistent with
originating from the primary event vertex, the ID track is required to satisfy
|
d
0/σ
d0|
<
3
and
|
z
0sin
θ
|
<
0
.
5 mm, where
d
0and
z
0are the transverse and longitudinal impact
param-eters of the track with respect to the primary vertex, respectively, and
σ
d0is the uncertainty
on the transverse impact parameter. In order to ensure constant trigger efficiency as a
func-tion of lepton
p
T, at least one electron or muon must have
p
T>
26 GeV and a separation
∆
R
=
p
(∆
η
)
2+ (∆
φ
)
2less than 0
.
2 from the triggered electron or muon. The trigger
efficiency is evaluated to be larger than 95% when all offline selection criteria are applied.
Jets are reconstructed from topological clusters built from energy deposits in
calorime-ter cells using the anti-
k
tjet algorithm [
25
] with a radius parameter of
R
= 0
.
4. The
measured jet energy is calibrated using
p
T- and
η
-dependent corrections for instrumental
effects (e.g. passive material and non-compensating response of the calorimeters) derived
from MC simulations and in situ techniques applied to data, and is corrected for additional
pp
interactions per bunch crossing (pileup) [
26
,
27
].
After energy calibration, jets are required to have
p
T>
30 GeV and
|
η
|
<
4
.
5. In order
to suppress jets from pileup interactions, if a jet has
p
T<
50 GeV and
|
η
|
<
2
.
5, then
at least 50% of the scalar sum of the
p
Tof all tracks associated with the jet is required
to come from tracks associated with the primary event vertex. Jets are also required to
pass jet-quality selections to reject jets reconstructed from non-collision signals, such as
beam-related background, cosmic rays or detector noise.
Since leptons and jet candidates can be reconstructed as multiple objects, the overlap
between the various objects is resolved by applying the following procedure. If two electrons
are separated by ∆
R <
0
.
1, the electron with the lower
p
Tis removed. If an electron and
a jet are separated by ∆
R <
0
.
2, the jet is removed. If an electron and a jet satisfy 0
.
2
<
∆
R <
0
.
4, and the jet’s transverse momentum also satisfies
p
T,jet>
30 GeV + 0
.
05
p
T,e, the
electron is removed. If a muon and an electron satisfy ∆
R <
0
.
1, the electron is removed. If
a muon and a jet are separated by ∆
R <
0
.
1, the jet is removed if its transverse momentum
satisfies
p
T,jet<
0
.
5
p
T,µif
p
T,µ<
200 GeV, or
p
T,jet<
100 GeV if
p
T,µ>
200 GeV. Finally,
if a muon and a jet not removed by the previous requirement are separated by ∆
R <
0
.
3,
the muon is removed.
The missing transverse momentum,
p
missT, and its magnitude,
E
Tmiss, are calculated
from the vector sum of the transverse momenta of all calibrated electrons, muons,
τ
JHEP09(2015)108
Events are required to have at least three leptons (electrons or muons) passing the
selection requirements above. At least one pair of leptons with the same flavour and
opposite electric charge must have an invariant mass within 10 GeV of the
Z
boson mass,
m
Z[
28
]. Events with four leptons consistent with the decay of two
Z
bosons, also within
10 GeV of
m
Z, are vetoed. For the remaining events with four leptons, the lepton closest
in ∆
R
to the
Z
boson candidate, referred to here as the off-
Z
lepton, is used to form
the trilepton mass. For the range of heavy lepton masses considered in this analysis,
the
Z
boson and the off-
Z
lepton tend to be collimated; hence, to improve the signal to
background ratio, events where the
Z
candidate and the off-
Z
lepton are separated by
∆
R >
3 are vetoed.
For simulated events with an
L
±decaying to three leptons with
p
T>
15 GeV and
|
η
|
<
2
.
5, of which two originate from a
Z
boson and have an invariant mass within 10 GeV
of
m
Z, the efficiency of this event selection for the
Z
+
e
(
Z
+
µ
) decay channel ranges from
20% (36%) at
m
L±= 100 GeV to 35% (38%) at
m
L±= 400 GeV. The determination of
the efficiency is discussed in section
8
.
Since the heavy leptons are produced in pairs, in addition to the identified
L
±→
Z
+
`
decay, signal events contain either a second
L
∓or an
N
0, which decays to a
W
,
Z
, or
H
boson and a charged or neutral lepton. A large fraction of events therefore contain
a fourth lepton and/or a hadronically decaying boson. The sensitivity of the analysis
is significantly improved by separating the events selected above into the following three
exclusive categories:
•
4
`
: at least four leptons are required using the same identification criteria as described
above.
•
3
`
+jj: exactly three leptons are required, along with two jets with an invariant mass
satisfying
m
W−
20 GeV
< m
jj<
150 GeV, where
m
Wis the
W
boson mass [
28
].
•
3
`
-only: the event does not fulfil the criteria of either the 4
`
or the 3
`
+jj categories.
Subdividing the 4
`
category based on the presence of a dijet does not significantly
improve the sensitivity due to the small number of expected events with both a fourth
lepton and a hadronically decaying boson. Finally, events are separated into two channels
based on whether the off-
Z
lepton is an electron or a muon. This classification results in
six independent signal regions.
The search is performed by looking for a narrowly peaked excess of events in the
distributions of the mass difference defined by ∆
m
≡
m
3`−
m
`±`∓, where the invariant
mass of the two leptons associated with the
Z
-boson decay is subtracted from the trilepton
invariant mass. This reduces the impact of the lepton momentum resolution, and thus
enhances the narrow resonance structure of the signal. The resulting reconstructed width
in ∆
m
is 5
.
9 GeV (15
.
5 GeV) for a mass hypothesis of
m
L±= 120 GeV (400 GeV), while
the corresponding width in the trilepton invariant mass is 7
.
3 GeV (18 GeV), for final
states where the off-
Z
lepton is an electron. For final states where the off-
Z
lepton is
a muon, the corresponding width in ∆
m
is 5.1 GeV (31.5 GeV) for a mass hypothesis of
JHEP09(2015)108
6.7 GeV (33.5 GeV). The intrinsic width of the resonance is a few MeV at
m
L±= 120 GeV,
rising to 0
.
5 GeV at
m
L±= 400 GeV.
4
Monte Carlo simulation
The analysis uses MC samples of VLL and type-III seesaw events generated with
Mad-Graph
4.5.2 and 5.2.2.1 [
29
], respectively, using the CTEQ6L1 [
30
] parton distribution
functions (PDF) and the AU2 underlying event tune [
31
]. Showering is performed with
Pythia
8 [
32
]. Decays of the heavy leptons in the VLL model are performed using
bridge
[
33
], while decays in the type-III seesaw samples are performed by
MadGraph
.
For the type-III seesaw model, the charged and neutral heavy leptons are generated with
identical masses. Vector-like lepton samples are generated for eleven mass hypotheses for
100 GeV
≤
m
L±≤
400 GeV, while the type-III seesaw samples are generated for ten mass
hypotheses for 100 GeV
≤
m
L±,N0≤
500 GeV. The cross sections for both samples are
calculated at leading order (LO) in QCD.
The main backgrounds originate from SM diboson production, in particular
W Z
and
ZZ
production. Contributions from
W Z
(
ZZ
) are modelled using the
Sherpa
[
34
] MC
generator version 1.4.3 (1.4.5), using the internal showering algorithm [
35
–
37
], with the
CT10 [
38
] PDF set and normalized to the next-to-leading-order (NLO) prediction from
vbfnlo
-2.6.2 [
39
]. The generation includes up to three additional parton emissions in
the matrix element. Samples of simulated events based on the NLO generator
powheg-box
[
40
] are used to derive systematic uncertainties on the shapes of distributions predicted
by
Sherpa
. The diboson samples are showered with
Pythia
8, and use the CT10 PDF
set and AU2 underlying event tune.
Drell-Yan production in association with a photon that converts in the detector,
de-noted
Z
+
γ
, is modelled using
Sherpa
1.4.1, also using the CT10 PDF set and including up
to three additional parton emissions in the matrix element. Production of top-quark pairs
in association with a
W
or
Z
boson (
t
¯
t
+
V
) and triboson production (
V V V
(∗)) are modelled
using
MadGraph
5.1.3.33, with
Pythia
6.426 for the parton shower and hadronization,
AUET2B underlying event tune [
41
], and the CTEQ6L1 PDF set. The
t
¯
t
+
V
processes are
normalized to the corresponding NLO cross sections [
42
,
43
], while the
Z
+
γ
and
V V V
(∗)processes are normalized to their LO cross sections from the respective generator.
For all samples, the response of the ATLAS detector is modelled using the
geant4
toolkit [
44
,
45
]. Additional
pp
interactions in the same or nearby bunch
cross-ings are included in the simulation by overlaying minimum-bias interactions modelled with
Pythia
6.425 onto the hard-scatter event. The simulated events are reweighted to
re-produce the distribution of the average number of
pp
interactions per crossing observed
in data. The generator, parton shower, PDF set, underlying event tune, and accuracy of
JHEP09(2015)108
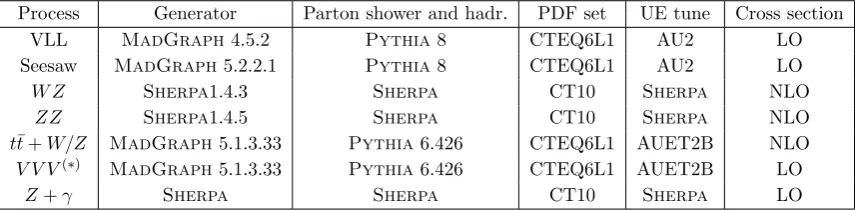
Process Generator Parton shower and hadr. PDF set UE tune Cross sectionVLL MadGraph4.5.2 Pythia8 CTEQ6L1 AU2 LO
Seesaw MadGraph5.2.2.1 Pythia8 CTEQ6L1 AU2 LO
W Z Sherpa1.4.3 Sherpa CT10 Sherpa NLO
ZZ Sherpa1.4.5 Sherpa CT10 Sherpa NLO
tt¯+W/Z MadGraph5.1.3.33 Pythia6.426 CTEQ6L1 AUET2B NLO V V V(∗)
MadGraph5.1.3.33 Pythia6.426 CTEQ6L1 AUET2B LO
[image:8.595.84.512.84.189.2]Z+γ Sherpa Sherpa CT10 Sherpa LO
Table 1. Summary of the primary signal and background MC samples used in this analysis. The generator, parton shower and hadronization, PDF, underlying event tune, and the order of the cross-section calculation are shown for each sample.
5
Background estimation
Standard Model processes containing three or more lepton candidates can be classified into
two categories. The first category consists of events with three prompt leptons produced in
the decays of electroweak gauge bosons, which are estimated using the simulated samples
described above. The second consists of events where at least one reconstructed lepton
arises from a misidentified jet, hadron decay, or photon conversion, and is referred to as
reducible background. For muons, reducible backgrounds arise from semileptonic
b
- or
c
-hadron decays and from in-flight decays of pions or kaons. Reducible electron backgrounds
can arise from semi-leptonic
b
- or
c
-hadron decays, photon conversions and misidentified
hadrons or jets. Drell-Yan production of a lepton pair with an associated photon that
converts in the detector and is reconstructed as an isolated lepton (
Z
+
γ
) is estimated
using simulation. The remainder of the reducible background is estimated by scaling control
samples in data, following a method similar to that described in ref. [
46
]. The control
samples consist of events with one or more leptons that do not satisfy the nominal selection
criteria, but instead satisfy a set of relaxed criteria, defined separately for each lepton
flavour. The events are weighted with scale factors computed for each such lepton, defined
as the ratio of misidentified or non-prompt lepton candidates that satisfy the nominal
criteria to those which only fulfil the relaxed criteria. For electrons, the identification
requirement is changed from tight to loose [
22
]. For muons, the requirements on the lepton
isolation and on
|
d
0/σ
d0|
are relaxed. The scale factors are measured as a function of the
candidate’s
p
Tand
η
in samples of data that are enriched in non-prompt and misidentified
lepton candidates. The contamination from prompt leptons in the background-enriched
samples is removed using simulation.
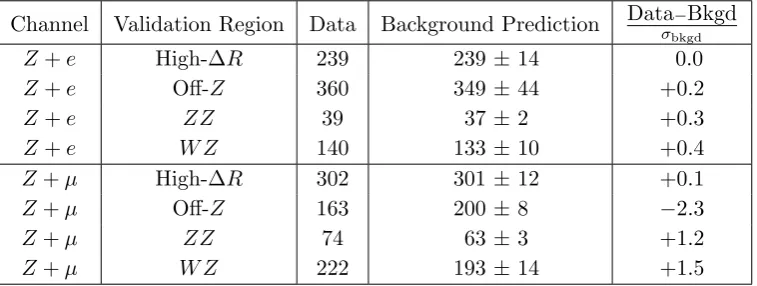
The background estimates are validated in four validation regions. The high-∆
R
region
consists of events where the
Z
boson candidate and the off-
Z
lepton are separated by ∆
R >
3. The background composition in this region is similar to that in the signal regions. The
off-
Z
region contains events with exactly three leptons, where no opposite-sign same-flavour
pair of leptons is reconstructed with an invariant mass within 20 GeV of
m
Z. This region is
designed to test the
Z
+
γ
background estimate. The
ZZ
region consists of events with two
JHEP09(2015)108
Channel
Validation Region
Data
Background Prediction
Data
σ−Bkgd
bkgd
Z
+
e
High-∆
R
239
239
±
14
0.0
Z
+
e
Off-
Z
360
349
±
44
+0.2
Z
+
e
ZZ
39
37
±
2
+0.3
Z
+
e
W Z
140
133
±
10
+0.4
Z
+
µ
High-∆
R
302
301
±
12
+0.1
Z
+
µ
Off-
Z
163
200
±
8
−
2.3
Z
+
µ
ZZ
74
63
±
3
+1.2
[image:9.595.110.489.84.227.2]Z
+
µ
W Z
222
193
±
14
+1.5
Table 2. Summary of the number of events observed and predicted for each validation region. The uncertainty on the background prediction is the total systematic uncertainty. The difference between the observed and predicted number of events divided by the combined statistical and systematic uncertainty on the prediction is also shown.
signal selection. The fourth region is designed to test the modelling of SM
W Z
production.
Events in this region must have exactly three leptons, zero jets, 40
< E
Tmiss<
100 GeV,
and 40
< m
WT<
90 GeV, where
m
WT=
q
2
p
`T
E
Tmiss(1
−
cos(∆
φ
)) is the transverse mass
and ∆
φ
is the azimuthal angle between the missing transverse momentum and the off-
Z
lepton with momentum
p
`T. This region is not completely orthogonal to the signal regions,
but signal processes are expected to account for less than 3% of the expected event yield
for type-III seesaw leptons with
m
L±>
160 GeV.
The expected and observed numbers of events are given in table
2
for all validation
regions, separately for the
Z
+
e
and the
Z
+
µ
channels. The largest difference is seen in the
off-
Z
region in the
Z
+
µ
flavour channel, where there is a deficit in the data corresponding
to 2
.
3 standard deviations (
σ
). The region is dominated by contributions from
ZZ
, where
only three leptons pass the selection requirements and no same-flavour, opposite-sign lepton
pair is reconstructed with invariant mass within 20 GeV of
m
Z. In the other seven regions,
agreement better than 1
.
5
σ
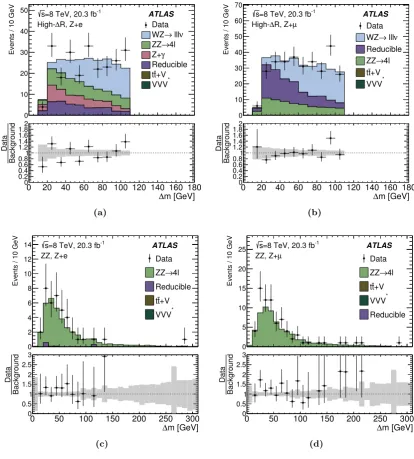
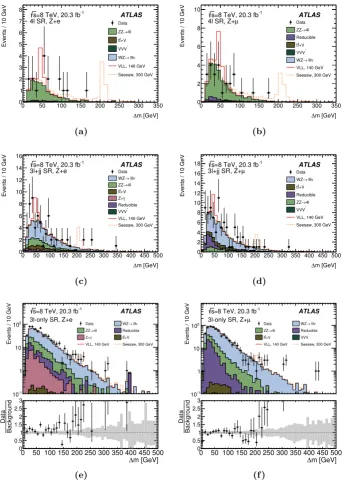
is observed. Figure
2
shows the ∆
m
distributions for the
high-∆
R
and
ZZ
validation regions in the
Z
+
e
and the
Z
+
µ
flavour channels.
6
Systematic uncertainties
Systematic uncertainties are assigned to the signal and background predictions derived
from simulation to account for possible modelling inaccuracies. Sources of uncertainty
affecting all simulated signal and background processes are the cross sections of SM
pro-cesses, trigger efficiencies, lepton energy scales and resolutions (LES/LER), jet energy scale
and resolution (JES/JER), lepton reconstruction and selection efficiencies, MC statistical
uncertainties, and luminosity. The cross-section uncertainties, evaluated for the SM
back-ground samples, include renormalization and factorization scale and PDF uncertainties.
The scale uncertainties are determined by varying the renormalization and factorization
scales up and down by factors of two. PDF uncertainties are obtained using the PDF4LHC
quadra-JHEP09(2015)108
Events / 10 GeV
0 10 20 30 40 50 Data ν lll → WZ 4l → ZZ γ Z+ Reducible +V t t * VVV m [GeV] ∆
0 20 40 60 80 100 120 140 160 180
Background Data 0 0.2 0.4 0.6 0.81 1.2 1.4 1.6 1.82 -1
=8 TeV, 20.3 fb s R, Z+e ∆ High-ATLAS (a)
Events / 10 GeV
0 10 20 30 40 50 60 70 Data ν lll → WZ Reducible 4l → ZZ +V t t * VVV m [GeV] ∆
0 20 40 60 80 100 120 140 160 180
Background Data 0 0.2 0.4 0.6 0.81 1.2 1.4 1.6 1.82 -1 =8 TeV, 20.3 fb s µ R, Z+ ∆ High-ATLAS (b)
Events / 10 GeV
0 2 4 6 8 10 12 14 Data 4l → ZZ Reducible +V t t * VVV m [GeV] ∆
0 50 100 150 200 250 300
Background Data 0 0.5 1 1.5 2 2.5 3 -1 =8 TeV, 20.3 fb s
ZZ, Z+e
ATLAS
(c)
Events / 10 GeV
0 5 10 15 20 25 Data 4l → ZZ +V t t * VVV Reducible m [GeV] ∆
0 50 100 150 200 250 300
Background Data 0 0.5 1 1.5 2 2.5 3 -1 =8 TeV, 20.3 fb s
µ ZZ, Z+
ATLAS
[image:10.595.88.503.145.605.2](d)
Figure 2. The ∆m =m3`−m`+`− distributions for the high-∆R validation region (a) and (b)
JHEP09(2015)108
ture to obtain the total uncertainty on the inclusive cross section. For the dominant
W Z
and
ZZ
backgrounds, the resulting theoretical uncertainty on the NLO predictions from
vbfnlo
are 7
.
6% and 4
.
3%, respectively. A further uncertainty is assigned to the
W Z
and
ZZ
backgrounds to account for potential generator-level mismodelling of the shape of the
∆
m
spectrum. The uncertainty is the difference between the predictions from
Sherpa
and
powheg-box
, symmetrized around the value from
Sherpa
.
For the
Z
+
γ
backgrounds, an uncertainty of 30% is assigned to the modelling of prompt
photons converting in the inner detector, based on comparisons of conversion processes in
Z
→
ee
events between data and simulation. The reducible backgrounds are assigned an
uncertainty related to the data-driven scaling procedure described in section
5
, primarily
due to the extrapolation of the scale factors from the measurement sample to the signal
regions and to the correction for the presence of prompt leptons in the background-enriched
samples. The uncertainties on the electron factors range from 24% to 30% as a function of
p
T, and the uncertainties on the muon factors range from 25% to 50%.
The uncertainties on the lepton reconstruction and selection efficiencies, energy scales,
and energy resolutions [
23
,
48
,
49
] affect all simulated backgrounds, with combined
uncer-tainties of 1% to 2% on the normalizations. The jet energy scale and resolution
uncertain-ties [
27
,
50
] only significantly affect the 3
`
+jj signal regions, with a total uncertainty of 3%.
Statistical uncertainties due to the finite number of events in the MC samples range from
1% to 5%. The luminosity uncertainty is 2
.
8%, and is derived using the same methodology
as that described in ref. [
51
]. In total, the systematic uncertainties on the background
predictions in each signal region range from 6% to 9%.
The largest sources of uncertainty affecting the signal predictions are the lepton
re-construction and selection efficiencies, the luminosity, and, for the 3
`
+jj category, the jet
energy scale and resolution. The total uncertainties on the signal normalizations range
from 3% to 7% depending on the signal region and
m
L±.
7
Signal and background model
The numbers of signal and background candidate events in data are determined from an
unbinned maximum-likelihood fit of a combination of signal and background models to the
∆
m
distributions in each signal region. The details of the fit procedure and the models are
described below.
The signal and background processes are modelled with probability density functions
(p.d.f.s). The parameters of the p.d.f.s are determined from fits to the background estimates
described in section
5
. The fit to data using the combined signal and background model
is performed simultaneously on the three categories for each of the two flavour channels.
In each signal region, the normalization of the dominant background (
ZZ
or
W Z
) is a
JHEP09(2015)108
The VLL and type-III seesaw signal models are parameterized separately as the sum
of a Voigtian function (the convolution of a Breit-Wigner and a Gaussian function) for
the trilepton resonance peak and a Landau distribution for the combinatorial part of the
signal, where the three reconstructed leptons do not originate from the same
L
±decay.
The signal parameterization at a certain heavy lepton mass
m
L±is given as a function of
∆
m
by the following expression:
S
(
m
L±) =
f
VF
V(∆
m
; Γ
V, m
V, σ
V) + (1
−
f
V)
F
L(∆
m
;
m
L, σ
L)
,
(7.1)
where
f
Vdenotes the fraction of events in the resonance peak (Voigtian function), Γ
V,
m
Vand
σ
Vare the width, mean, and Gaussian smearing terms of the Voigtian function
F
V,
and
m
Land
σ
Lare the parameters of the Landau distribution
F
L. The six parameters are
determined at each simulated mass point by fitting
S
(
m
L±) to the simulated ∆
m
distribu-tions, separately for the two flavours. For mass points
m
L±that lie between those assumed
in the MC samples, the parameters of the signal templates are obtained by linearly
inter-polating the fitted values determined at the nearest simulated mass points. The fraction
of events in the Voigtian part of the signal,
f
V, is
∼
60%(
∼
70%) at 120 GeV, decreasing
to
∼
58%(
∼
55%) at 400 GeV for the type-III seesaw signal (VLL). The uncertainties on
the fit parameters of the signal p.d.f. are incorporated as Gaussian-distributed nuisance
parameters in the combined fits to data.
The combined background model consists of five different p.d.f.s, corresponding to
W Z
,
ZZ
,
Z
+
γ
, reducible, and the sum of the
t
¯
t
+
V
and triboson backgrounds. The leading
W Z
and
ZZ
backgrounds are both modelled with a modified Bukin function [
52
], a
three-parameter function designed to model peaks with asymmetric tails using the convolution of
a Gaussian and an exponential function. To mitigate the impact of MC statistical
uncer-tainties, the parameterizations for the 4
`
and 3
`
-only categories are determined from the
combination of all three categories; for the 3
`
+jj category, a separate parameterization is
used to account for possible kinematic effects from the two additional jets. The uncertainty
on the shape of the ∆
m
distribution predicted by the generator is taken into account with
a Gaussian-distributed nuisance parameter multiplying a template given by the difference
between the p.d.f.s determined from
Sherpa
and
powheg-box
. Finally, in the 3
`
+jj and
3
`
-only categories, the ratio of normalizations of the
W Z
and
ZZ
backgrounds is fixed to
the prediction from MC simulation, due to the inability of the fit to resolve the similar
shapes of the ∆
m
distributions. In the 4
`
category, the contribution from
W Z
events is
negligible, so only the
ZZ
background normalization is left as a free parameter.
The most important remaining backgrounds are due to reducible processes and
Z
+
γ
production. The reducible background is parameterized with a Landau distribution,
determined from the data-driven estimate described above. Due to the low number of
events in the reducible background estimates, the corresponding shape is obtained by fitting
the combined distribution of all six signal regions.
The
Z
(
``
) +
γ
background contributes significantly only to the
Z
+
e
, 3
`
-only category.
This background is modelled with the sum of a Landau distribution and a Gaussian
func-tion. The normalizations of the reducible and
Z
+
γ
backgrounds are constrained to the
JHEP09(2015)108
Z+e Z+µ
Process 4l SR 3l+jjSR 3l-only SR 4lSR 3l+jjSR 3l-only SR
Before combined background-only fit
ZZ 10.9 ±0.6 11.7 ±0.8 91 ±5 21.4 ±1.1 7.5 ±0.6 90 ±5
W Z 0.08±0.01 35.3 ±3.1 337 ±28 — 46 ±4 480 ±40
Z+γ — 2.3 ±0.8 35 ±11 — — —
Reducible — 1.6 ±0.5 38 ±14 1.5 ±0.3 8.8 ±3.0 79 ±22
tt+V, V V V(∗) 1.2 ±0.2 7.8 ±1.7 2.3 ±0.4 1.5 ±0.2 9.5 ±2.1 3.3 ±0.5
Total Background 12.2 ±0.7 59 ±4 504 ±34 24.4 ±1.2 72 ±6 650 ±50
After combined background-only fit
ZZ 15 ±4 13.4 ±2.3 107 ±9 22 ±5 10.1 ±1.6 88 ±8
W Z 0.08±0.03 39 ±6 393 ±28 0.02±0.02 56 ±9 460 ±40
Z+γ — 2.2 ±0.8 34 ±11 — — —
Reducible — 1.8 ±1.2 37 ±13 1.8 ±0.9 10.2 ±2.8 92 ±24
tt+V, V V V(∗) 1.1 ±0.3 7.5 ±1.7 2.5 ±0.6 1.5 ±0.4 9.1 ±2.1 3.3 ±0.8
Total Background 16 ±4 64 ±7 574 ±34 25 ±5 85 ±10 640 ±40
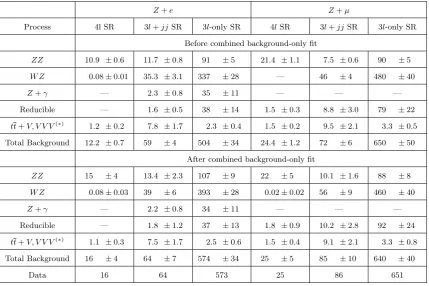
[image:13.595.84.514.83.369.2]Data 16 64 573 25 86 651
Table 3. Observed and expected number of events in the six signal regions, before and after the combined unbinned maximum-likelihood fit. The pre-fit uncertainties represent the total system-atic uncertainties on the background estimates. The post-fit uncertainties are determined by the maximum-likelihood fit.
Finally, the background contributions from triboson and
t
t
¯
+
W/Z
production are
mod-elled together using a Landau distribution, due to their similar shape and small contribution
to the total background estimate. The normalization in the combined fit is also constrained
to the expected value from simulation, with a 30% Gaussian-distributed uncertainty.
8
Results
The total number of events observed in each signal region is shown in table
3
, along with
the estimated backgrounds before and after fitting the total background model to the data.
The corresponding ∆
m
distributions for the pre-fit background estimates and the data are
shown in figure
3
. The signals expected for the VLL model with
m
L±= 140 GeV and
the type-III seesaw model with
m
L±= 300 GeV are superimposed on the background as
illustrative examples. The data agree with the background expectation in all cases, and no
clear peak indicating resonant trilepton production is seen in any of the signal regions.
Good agreement is seen between the pre-fit and post-fit normalizations for the 4
`
and
3
`
+jj categories in the
Z
+
µ
flavour channel. The largest change in normalization due to
the fit is in the 4
`
category for the
Z
+
e
flavour channel, where the fitted
ZZ
normalization
exceeds the prediction by 35%. The
W Z
and
ZZ
normalizations increase by roughly 15%
JHEP09(2015)108
m [GeV]
∆
0 50 100 150 200 250 300 350
Events / 10 GeV
0 1 2 3 4 5 6 7 8 Data 4l → ZZ +V t t * VVV ν lll → WZ VLL, 140 GeV Seesaw, 300 GeV -1
=8 TeV, 20.3 fb s
4l SR, Z+e
ATLAS
(a)
m [GeV] ∆
0 50 100 150 200 250 300 350
Events / 10 GeV
0 2 4 6 8 10 Data 4l → ZZ Reducible +V t t * VVV ν lll → WZ VLL, 140 GeV Seesaw, 300 GeV -1
=8 TeV, 20.3 fb s
µ 4l SR, Z+
ATLAS
(b)
m [GeV]
∆
0 50 100 150 200 250 300 350 400 450 500
Events / 10 GeV
0 2 4 6 8 10 12 14 16 Data ν lll → WZ 4l → ZZ +V t t γ Z+ Reducible * VVV VLL, 140 GeV Seesaw, 300 GeV -1
=8 TeV, 20.3 fb s
3l+jj SR, Z+e
ATLAS
(c)
m [GeV] ∆
0 50 100 150 200 250 300 350 400 450 500
Events / 10 GeV
0 2 4 6 8 10 12 14 16 18 Data ν lll → WZ +V t t Reducible 4l → ZZ * VVV VLL, 140 GeV Seesaw, 300 GeV -1
=8 TeV, 20.3 fb s
µ
3l+jj SR, Z+
ATLAS
(d)
Events / 10 GeV
-1
10 1 10
2
10 Data WZ→ lllν
4l
→
ZZ Reducible
γ
Z+ tt+V VLL, 140 GeV Seesaw, 300 GeV
m [GeV] ∆
0 50 100 150 200 250 300 350 400 450 500
Background Data 0 0.5 1 1.5 2 2.5 3 -1
=8 TeV, 20.3 fb s
3l-only SR, Z+e
ATLAS
(e)
Events / 10 GeV
-1 10
1 10 2
10 Data WZ→ lllν
4l →
ZZ Reducible
+V t
t VVV*
VLL, 140 GeV Seesaw, 300 GeV
m [GeV]
∆
0 50 100 150 200 250 300 350 400 450 500
Background Data 0 0.5 1 1.5 2 2.5 3 -1
=8 TeV, 20.3 fb s
µ
3l-only SR, Z+
ATLAS
[image:14.595.127.470.116.598.2](f )
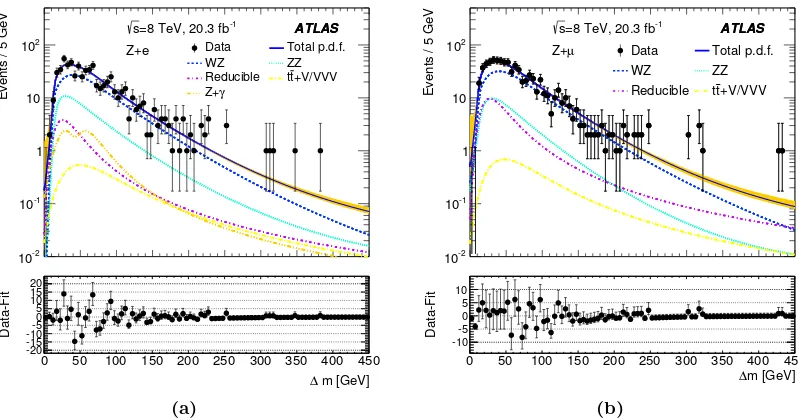
Figure 3. The ∆m = m3`−m`+`− distributions for the 4` (top), 3`+jj (middle), and 3`-only
JHEP09(2015)108
Events / 5 GeV
-2 10
-1 10
1 10 2
10 Data Total p.d.f.
WZ ZZ
Reducible tt+V/VVV
γ
Z+ -1 =8 TeV, 20.3 fb s
Z+e
ATLAS ATLAS
m [GeV]
∆
0 50 100 150 200 250 300 350 400 450
Data-Fit
-20 -15 -10-5 0 5 10 15 20
(a)
Events / 5 GeV
-2 10
-1 10
1 10 2
10 Data Total p.d.f.
WZ ZZ
Reducible tt+V/VVV -1
=8 TeV, 20.3 fb s
µ
Z+
ATLAS ATLAS
m [GeV]
∆
0 50 100 150 200 250 300 350 400 450
Data-Fit
-10 -5 0 5 10
[image:15.595.99.498.97.307.2](b)
Figure 4. Projections onto the ∆mvariable of the background-only unbinned maximum-likelihood fits, shown superimposed on the data with the three categories in each flavour channel added together. The Z +e flavour channel is shown in (a), and the Z+µ channel is shown in (b). The contributions of the separate background components to the total background-only fit are also shown. The error bars on the data points represent statistical uncertainties. Good agreement is observed between the background model and the data.
category in the
Z
+
µ
flavour channel. The projections of the fit results in the
background-only hypothesis are shown in figure
4
for the combination of the three categories in each
flavour channel.
The data are well described by the combined fit to the three categories in each flavour
channel. The consistency of the data with the background-only hypothesis is evaluated
by scanning the local
p
0-value for the ∆
m
distribution in 3 GeV intervals for signal mass
hypotheses in the range 100
−
400 GeV for the VLL model, and 100
−
500 GeV for the
seesaw model, using the unbinned maximum-likelihood fit described in section
7
with the
signal strength set to zero. The
p
0-value, which corresponds to the probability to observe at
least as many events as observed in the present measurement assuming the background-only
hypothesis, is calculated using the frequentist hypothesis test based on the profile likelihood
ratio test statistic and approximated with asymptotic formulae [
53
]. The minimum
p
0-value
is
p
0= 0
.
02 at a mass of 183 GeV for the
Z
+
e
flavour channel, and
p
0= 0
.
05 at a mass
of 109 GeV for the
Z
+
µ
flavour channel.
Since no significant excess above the background expectation is observed, the fit model
is used to derive 95% confidence level (CL) exclusion limits on the heavy lepton
pair-production cross section,
σ
, using the
CL
smethod [
54
]. The limits are shown for the
VLL model in figure
5
, and for the type-III seesaw model in figure
6
, evaluated in the same
3 GeV intervals as the
p
0-values. The VLL model is excluded for electron-only mixing in the
JHEP09(2015)108
[GeV]
± L
m 100 150 200 250 300
[fb]
σ
95% CL Limit on 102 3
10 s = 8 TeV, 20.3 fb-1
VLL, Z+e ATLAS Expected σ 1 ± σ 2 ± Observed
Theor. Cross Section
(a)
[GeV]
±
L
m 100 150 200 250 300
[fb]
σ
95% CL Limit on 102 3
10 s = 8 TeV, 20.3 fb-1 µ VLL, Z+ ATLAS Expected σ 1 ± σ 2 ± Observed
Theor. Cross Section
[image:16.595.91.506.97.262.2](b)
Figure 5. 95% CL upper limits on the vector-like lepton cross section. The left (right) plot shows the limits assuming 100% branching fraction to e/νe (µ/νµ). The solid line shows the observed
limit. The dashed line shows the median expected limit for a background-only hypothesis, with green and yellow bands indicating the expected fluctuations at the±1σand±2σlevels. The limit is evaluated in 3 GeV intervals.
[GeV] ±
L
m
100 200 300 400 500
[pb]
σ
95% CL Limit on
-2 10 -1 10 1 -1 = 8 TeV, 20.3 fb s Seesaw, Z+e ATLAS Expected σ 1 ± σ 2 ± Observed
Theor. Cross Section
(a)
[GeV]
±
L
m
100 200 300 400 500
[pb]
σ
95% CL Limit on
-2 10 -1 10 1 -1 = 8 TeV, 20.3 fb s µ Seesaw, Z+ ATLAS Expected σ 1 ± σ 2 ± Observed
Theor. Cross Section
(b)
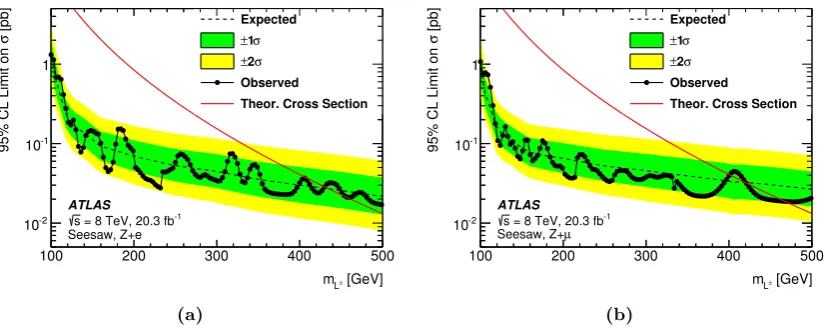
Figure 6. 95% CL upper limits on the type-III seesaw production cross section. The left (right) plot shows the limits assuming 100% branching fraction to e/νe (µ/νµ). The solid line shows the
observed limit. The dashed line shows the median expected limit for a background-only hypothesis dataset, with green and yellow bands indicating the expected fluctuations at the ±1σ and ±2σ levels. The limit is evaluated in 3 GeV intervals.
[image:16.595.95.508.369.534.2]JHEP09(2015)108
The constraints shown in figures
5
and
6
are relevant to the specific VLL and type-III
seesaw models considered, and are not necessarily applicable to other scenarios predicting
trilepton resonances with an intermediate
Z
boson. A more model-independent observable
is the
visible cross section
,
σ
vis, defined as the number of observed events with
Z
+
`
-induced
trilepton resonances for a given resonance mass divided by the integrated luminosity of the
data sample, 20.3 fb
−1. The 95% CL upper limits on
σ
vis
, denoted
σ
95vis, are derived from
a fit to each flavour channel with
f
V= 1, i.e. using only the peak component of the signal.
The results for the two flavour channels, derived from the inclusive event selection without
dividing the events into the three categories, are shown in figure
7
.
The limits on
σ
viscan be used to test specific models after taking into account the
model’s acceptance with respect to a fiducial volume,
A
, and reconstruction and selection
efficiency of events within the fiducial volume,
fid. The 95% CL upper limit on the cross
section for the model is given by:
σ
95=
σ
vis95
A ×
fid.
(8.1)
The acceptance
A
is defined as the probability for generated signal events to lie within
a fiducial volume defined by the kinematics of the generated leptons. The leptons are
considered at
particle level
, i.e. after parton shower and hadronization and with lifetimes
longer than 10
−11s, and are
dressed
, including the contributions from radiated photons
within a cone of ∆
R
= 0
.
1. The fiducial volume requires that events contain an
L
±decaying to a prompt electron or muon and a
Z
boson that then decays to electrons or
muons. The three leptons from the
L
±decay are required to have
p
T>
15 GeV and lie
within
|
η
|
<
2
.
5, with at least one lepton satisfying
p
T>
26 GeV. Two of the leptons must
form a same-flavour opposite-sign pair with a mass within 10 GeV of
m
Z, and the
Z
boson
and the off-
Z
lepton must be separated by ∆
R <
3. The events are divided into flavour
channels according to the flavour of the off-
Z
lepton. For the VLL and type-III seesaw
models used in this analysis, the acceptance of events containing an
L
±→
Z
(
``
)
`
decay
to fall within the fiducial volume is in the range 60%–65% for most of the mass range,
decreasing at higher masses due to the cut on the ∆
R
between the
Z
boson and the off-
Z
lepton. The acceptance decreases at low masses due to the lepton
p
Trequirement, reaching
30%–35% at
m
L±= 100 GeV.
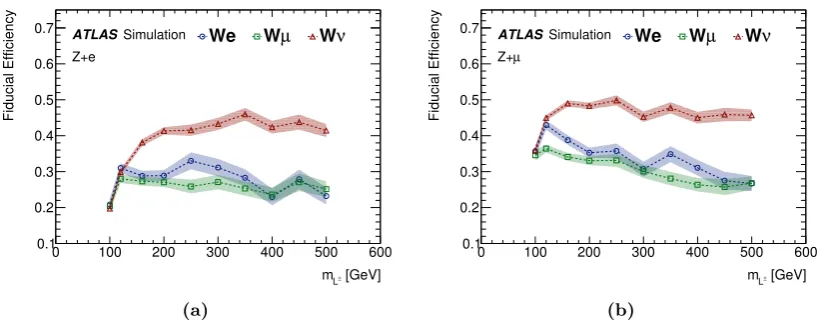
For type-III seesaw and VLL events within the fiducial volume,
fidranges from 20%
to 49% if the other heavy lepton decays to a neutrino and a
W
,
Z
, or
H
boson.
2If the
other heavy lepton decays to an electron or a muon, the efficiency is 10%–20% lower, due
to the increased probability of incorrectly selecting the off-
Z
lepton. The event selection
efficiencies for the type-III seesaw model in scenarios where the second heavy lepton decays
to a
W
boson are shown in figure
8
as a function of
m
L±; the efficiencies for scenarios where
the second heavy lepton decays to a
Z
or
H
boson and for the VLL model are consistent
with these efficiencies within the statistical uncertainties.
2Note that the quoted efficiencies are dependent on the modelling of the polarization of theZ bosons,
JHEP09(2015)108
[GeV]± L
m 100 200 300 400 500
[fb]
vis
σ
95% CL Limit on
-1
10 1 10
-1 = 8 TeV, 20.3 fb s Z+e ATLAS Expected σ 1 ± σ 2 ± Observed (a) [GeV] ± L m 100 200 300 400 500
[fb]
vis
σ
95% CL Limit on
-1
10 1 10
[image:18.595.92.502.95.258.2]-1 = 8 TeV, 20.3 fb s µ Z+ ATLAS Expected σ 1 ± σ 2 ± Observed (b)
Figure 7. Upper limits at 95% CL on σvis for the Z+e (left) and Z+µ (right) flavour chan-nels, derived without dividing events into the three categories. The limits are evaluated in 3 GeV intervals.
[GeV] ± L m
0 100 200 300 400 500 600
Fiducial Efficiency 0.1 0.2 0.3 0.4 0.5 0.6 0.7 We µ
W Wν
ATLASSimulation Z+e (a) [GeV] ± L m
0 100 200 300 400 500 600
Fiducial Efficiency 0.1 0.2 0.3 0.4 0.5 0.6 0.7 We µ
W Wν
ATLASSimulation
µ
Z+
(b)
Figure 8. Efficiencies for reconstructing and correctly identifying the L± → Z(``)`± decay in events within the fiducial volume for the type-III seesaw model. The left (right) plot shows the efficiencies for events containing a L± → Z(``)e (L± → Z(``)µ) decay. The decay of the second
heavy lepton is specified in the legend. The shaded bands show the statistical uncertainty.
9
Conclusion
A search for trilepton resonances decaying to a
Z
boson and an electron or a muon has been
presented. The search is based on
pp
collision data taken at
√
s
= 8 TeV corresponding to an
integrated luminosity of 20.3 fb
−1, collected by the ATLAS experiment at the CERN Large
Hadron Collider. Events are selected requiring at least three electrons or muons with high
transverse momentum, with two of the leptons consistent with the decay of a
Z
boson. The
events are categorized based on the presence or absence of additional leptons or dijet pairs
in the event consistent with the decay products of a second heavy lepton, and separated
into channels based on the flavour of the lepton associated with the
Z
boson to form a
[image:18.595.92.512.331.494.2]JHEP09(2015)108
candidate masses, a search for a narrow resonance is performed in each of these categories
using a maximum-likelihood fit of parameterized signal and background shapes to the data.
No significant excess above Standard Model predictions is observed, and 95% CL limits on
the production of trilepton resonances beyond the Standard Model are derived. The results
are interpreted in the context of two models of new heavy leptons decaying to three charged
leptons. In the vector-like lepton model, new heavy charged leptons are excluded in the
mass range 129–176 GeV (114–168 GeV) for electron-only (muon-only) mixing, except for
the interval 144–163 GeV (153–160 GeV). In the type-III seesaw model, the corresponding
exclusion is in the mass range 100–430 GeV (100–468 GeV) for electron-only (muon-only)
mixing, except for the interval 401–419 GeV in the muon case. Limits are also set on the
visible cross section of trilepton resonance productions, and fiducial efficiencies are derived
to facilitate model testing.
Acknowledgments
We thank CERN for the very successful operation of the LHC, as well as the support staff
from our institutions without whom ATLAS could not be operated efficiently.
We acknowledge the support of ANPCyT, Argentina; YerPhI, Armenia; ARC,
Aus-tralia; BMWFW and FWF, Austria; ANAS, Azerbaijan; SSTC, Belarus; CNPq and
FAPESP, Brazil; NSERC, NRC and CFI, Canada; CERN; CONICYT, Chile; CAS, MOST
and NSFC, China; COLCIENCIAS, Colombia; MSMT CR, MPO CR and VSC CR,
Czech Republic; DNRF, DNSRC and Lundbeck Foundation, Denmark; EPLANET, ERC
and NSRF, European Union; IN2P3-CNRS, CEA-DSM/IRFU, France; GNSF, Georgia;
BMBF, DFG, HGF, MPG and AvH Foundation, Germany; GSRT and NSRF, Greece;
RGC, Hong Kong SAR, China; ISF, MINERVA, GIF, I-CORE and Benoziyo Center,
Is-rael; INFN, Italy; MEXT and JSPS, Japan; CNRST, Morocco; FOM and NWO,
Nether-lands; BRF and RCN, Norway; MNiSW and NCN, Poland; GRICES and FCT, Portugal;
MNE/IFA, Romania; MES of Russia and NRC KI, Russian Federation; JINR; MSTD,
Serbia; MSSR, Slovakia; ARRS and MIZˇ
S, Slovenia; DST/NRF, South Africa; MINECO,
Spain; SRC and Wallenberg Foundation, Sweden; SER, SNSF and Cantons of Bern and
Geneva, Switzerland; NSC, Taiwan; TAEK, Turkey; STFC, the Royal Society and
Lever-hulme Trust, United Kingdom; DOE and NSF, United States of America.
JHEP09(2015)108
Open Access.
This article is distributed under the terms of the Creative Commons
Attribution License (
CC-BY 4.0
), which permits any use, distribution and reproduction in
any medium, provided the original author(s) and source are credited.
References
[1] SLAC-SP-017collaboration, J.E. Augustin et al.,Discovery of a Narrow Resonance in
e+e− Annihilation,Phys. Rev. Lett.33(1974) 1406 [INSPIRE].
[2] E598collaboration, J.J. Aubert et al.,Experimental Observation of a Heavy Particle J,
Phys. Rev. Lett.33(1974) 1404[INSPIRE].
[3] S.W. Herb et al.,Observation of a Dimuon Resonance at 9.5-GeV in 400-GeV
Proton-Nucleus Collisions,Phys. Rev. Lett.39(1977) 252[INSPIRE].
[4] UA1collaboration, G. Arnison et al.,Experimental Observation of Lepton Pairs of Invariant
Mass Around 95 GeV/c2 at the CERN SPS Collider,Phys. Lett.B 126(1983) 398[INSPIRE].
[5] UA2collaboration, P. Bagnaia et al., Evidence forZ0→e+e− at the CERNpp¯ Collider,
Phys. Lett.B 129(1983) 130[INSPIRE].
[6] CMScollaboration,Search for physics beyond the standard model in dilepton mass spectra in
proton-proton collisions at√s= 8TeV,JHEP 04(2015) 025[arXiv:1412.6302] [INSPIRE].
[7] ATLAScollaboration,Search for high-mass dilepton resonances inpp collisions at √s
= 8TeV with the ATLAS detector, Phys. Rev.D 90(2014) 052005[arXiv:1405.4123]
[INSPIRE].
[8] SINDRUMcollaboration, U. Bellgardt et al.,Search for the Decaymu+→e+e+e−,Nucl.
Phys.B 299(1988) 1[INSPIRE].
[9] LHCb collaboration,Searches for violation of lepton flavour and baryon number in tau lepton
decays at LHCb,Phys. Lett.B 724(2013) 36[arXiv:1304.4518] [INSPIRE].
[10] A. Falkowski, D.M. Straub and A. Vicente,Vector-like leptons: Higgs decays and collider
phenomenology,JHEP 05(2014) 092[arXiv:1312.5329] [INSPIRE].
[11] K. Fujikawa,A vector-like extension of the standard model,Prog. Theor. Phys.92 (1994)
1149[hep-ph/9411258] [INSPIRE].
[12] B. Keren-Zur, P. Lodone, M. Nardecchia, D. Pappadopulo, R. Rattazzi and L. Vecchi, On
Partial Compositeness and the CP asymmetry in charm decays,Nucl. Phys. B 867(2013)
394[arXiv:1205.5803] [INSPIRE].
[13] M. Redi, Leptons in Composite MFV,JHEP 09(2013) 060[arXiv:1306.1525] [INSPIRE].
[14] R. Contino, T. Kramer, M. Son and R. Sundrum, Warped/composite phenomenology
simplified,JHEP 05(2007) 074[hep-ph/0612180] [INSPIRE].
[15] R. Foot, H. Lew, X.G. He and G.C. Joshi,Seesaw Neutrino Masses Induced by a Triplet of
Leptons,Z. Phys.C 44(1989) 441[INSPIRE].
[16] S.P. Martin, Extra vector-like matter and the lightest Higgs scalar boson mass in low-energy
supersymmetry,Phys. Rev. D 81(2010) 035004[arXiv:0910.2732] [INSPIRE].
[17] C. Biggio and F. Bonnet,Implementation of the Type III Seesaw Model in
FeynRules/MadGraph and Prospects for Discovery with Early LHC Data,Eur. Phys. J.C
JHEP09(2015)108
[18] M.S. Chanowitz and M.K. Gaillard,The TeV Physics of Strongly Interacting W’s and Z’s,Nucl. Phys.B 261(1985) 379[INSPIRE].
[19] L3collaboration, P. Achard et al.,Search for heavy neutral and charged leptons in e+e−
annihilation at LEP,Phys. Lett.B 517(2001) 75[hep-ex/0107015] [INSPIRE].
[20] CMScollaboration, Search for heavy lepton partners of neutrinos in proton-proton collisions
in the context of the type-III seesaw mechanism,Phys. Lett.B 718(2012) 348
[arXiv:1210.1797] [INSPIRE].
[21] ATLAScollaboration,The ATLAS Experiment at the CERN Large Hadron Collider,2008
JINST 3S08003[INSPIRE].
[22] ATLAScollaboration,Electron reconstruction and identification efficiency measurements
with the ATLAS detector using the 2011 LHC proton-proton collision data,Eur. Phys. J.C
74(2014) 2941[arXiv:1404.2240] [INSPIRE].
[23] ATLAScollaboration,Measurement of the muon reconstruction performance of the ATLAS
detector using 2011 and 2012 LHC proton-proton collision data,Eur. Phys. J.C 74(2014)
3130[arXiv:1407.3935] [INSPIRE].
[24] ATLAScollaboration,Search for new phenomena in events with three or more charged
leptons inppcollisions at √s= 8TeV with the ATLAS detector,arXiv:1411.2921
[INSPIRE].
[25] M. Cacciari, G.P. Salam and G. Soyez,The Anti-kt jet clustering algorithm,JHEP 04(2008)
063[arXiv:0802.1189] [INSPIRE].
[26] ATLAScollaboration,Jet energy measurement with the ATLAS detector in proton-proton
collisions at √s= 7TeV, Eur. Phys. J.C 73 (2013) 2304[arXiv:1112.6426] [INSPIRE].
[27] ATLAScollaboration,Jet energy resolution in proton-proton collisions at √s= 7TeV
recorded in 2010 with the ATLAS detector,Eur. Phys. J.C 73(2013) 2306
[arXiv:1210.6210] [INSPIRE].
[28] Particle Data Groupcollaboration, J. Beringer et al.,Review of Particle Physics (RPP),
Phys. Rev.D 86(2012) 010001 [INSPIRE].
[29] J. Alwall, M. Herquet, F. Maltoni, O. Mattelaer and T. Stelzer,MadGraph 5: Going Beyond,
JHEP 06 (2011) 128[arXiv:1106.0522] [INSPIRE].
[30] P.M. Nadolsky et al.,Implications of CTEQ global analysis for collider observables,Phys. Rev.D 78(2008) 013004[arXiv:0802.0007] [INSPIRE].
[31] ATLAS collaboration, ATLAS Run 1 PYTHIA8 tunes,ATL-PHYS-PUB-2014-021(2014).
[32] T. Sj¨ostrand, S. Mrenna and P.Z. Skands,A Brief Introduction to PYTHIA 8.1,Comput. Phys. Commun.178(2008) 852[arXiv:0710.3820] [INSPIRE].
[33] P. Meade and M. Reece,BRIDGE: Branching ratio inquiry/decay generated events,
hep-ph/0703031[INSPIRE].
[34] T. Gleisberg et al.,Event generation with SHERPA 1.1,JHEP 02(2009) 007
[arXiv:0811.4622] [INSPIRE].
[35] S. Hoeche, F. Krauss, S. Schumann and F. Siegert, QCD matrix elements and truncated
showers,JHEP 05(2009) 053[arXiv:0903.1219] [INSPIRE].
[36] T. Gleisberg and S. Hoeche,Comix, a new matrix element generator,JHEP 12(2008) 039