http://wrap.warwick.ac.uk
Original citation:
Barchiesi, Daniele, Preis, Tobias, 1981-, Bishop, Steven R. and Moat, Helen Susannah.
(2015) Modelling human mobility patterns using photographic data shared online. Royal
Society Open Science , 2 (8). 150046.
http://dx.doi.org/10.1098/rsos.150046
Permanent WRAP url:
http://wrap.warwick.ac.uk/73247
Copyright and reuse:
The Warwick Research Archive Portal (WRAP) makes this work of researchers of the
University of Warwick available open access under the following conditions.
This article is made available under the Creative Commons Attribution 4.0 International
license (CC BY 4.0) and may be reused according to the conditions of the license. For
more details see:
http://creativecommons.org/licenses/by/4.0/
A note on versions:
The version presented in WRAP is the published version, or, version of record, and may
be cited as it appears here.
rsos.royalsocietypublishing.org
Research
Cite this article:Barchiesi D, Preis T, Bishop
S, Moat HS. 2015 Modelling human mobility patterns using photographic data shared online.R. Soc. open sci.2: 150046. http://dx.doi.org/10.1098/rsos.150046
Received: 28 January 2015 Accepted: 15 July 2015
Subject Category:
Computer science
Subject Areas:
mathematical physics/environmental science/complexity
Keywords:
computational social science, data science, social media,Flickr, human mobility, complex systems
Author for correspondence:
Daniele Barchiesi
e-mail:[email protected]
Electronic supplementary material is available at http://dx.doi.org/10.1098/rsos.150046 or via http://rsos.royalsocietypublishing.org.
Modelling human mobility
patterns using photographic
data shared online
Daniele Barchiesi
1
, Tobias Preis
1,2,3
, Steven Bishop
1
and
Helen Susannah Moat
1,2,3
1Department of Mathematics, University College London , Gower Street,
London WC1E 6BT, UK
2Warwick Business School, University of Warwick, Scarman Road,
Coventry CV4 7AL, UK
3Department of Physics, Boston University, 590 Commonwealth Avenue, Boston,
MA 02215, USA
Humans are inherently mobile creatures. The way we move around our environment has consequences for a wide range of problems, including the design of efficient transportation systems and the planning of urban areas. Here, we gather data about the position in space and time of about 16 000 individuals who uploaded geo-tagged images from locations within the UK to theFlickrphoto-sharing website. Inspired by the theory of Lévy flights, which has previously been used to describe the statistical properties of human mobility, we design a machine learning algorithm to infer the probability of finding people in geographical locations and the probability of movement between pairs of locations. Our findings are in general agreement with official figures in the UK and on travel flows between pairs of major cities, suggesting that online data sources may be used to quantify and model large-scale human mobility patterns.
1. Introduction
Human mobility is governed by individuals’ decisions, habits and life experiences. Yet, whenever analysed across large segments of the population, movements exhibit surprising statistical regularities that have been studied in contexts as diverse as anthropology [1], urban mobility and planning [2–4], crime modelling [5], advertising [6] and epidemic spread [7–9].
Recent years have witnessed a rapid increase in the adoption of new communication channels such as mobile phones and online social media. This has opened up an opportunity to create improved models of human mobility, which allow us to better
2
rsos
.ro
yalsociet
ypublishing
.or
g
R.
Soc
.open
sc
i.
2
:1
50046
...
understand the influence of social networks on how people move around [10,11], and even generate predictions on where people might move next [12,13]. New data sources have enabled research about human mobility and, more generally, about human behaviour [14–29].
Previous work drawing on data from mobile phone logs and recorded movements of bank notes has suggested that the travel lengths of journeys people make follows a power-law distribution [30,31]. This corresponds to a behaviour whereby a large number of small movements are occasionally followed by very large ones, a property associated with so-called Lévy flights. Here, we start from this observation, and draw on data from the photo-sharing website Flickr, to propose a model of mobility where displacements are grouped together into geographical clusters. We argue that these clusters correspond to latent states or ‘contexts’ that drive the emergence of Lévy flights. Whereas previous work in this vein has been limited to the analysis of the movements of one individual [32], our model is based on the observation of trajectories of 16 000 photographers, and allows us to infer general patterns from the behaviour of many individuals.
2. Results
2.1. Individuals’ mobility model
The location of individuals who posted photos onFlickrdisplays a Lévy-flight pattern, whereby local movements around a relatively small area are occasionally followed by larger movements to a distant area (electronic supplementary material, figure S1). We propose that this behaviour can be modelled by clustering the geo-tagged information for each user into local groups of photos taken in distinct geographical areas, and by studying the statistical properties of sequences of photos within and between clusters.
To cluster groups of local geo-tagged pictures, we employ DBSCAN [33], a clustering technique used to identify an unspecified number of clusters of arbitrary shape. This method is suited to the problem considered here, where we do not have prior information about the number or shape of clusters. Using DBSCAN, two pointsp1andp2are regarded as belonging to the same cluster if there is a sequence of
intermediate points{pn}that connect them, such that every intermediate pointpncontainsMother points within a Euclidean distance offrompn. The set of points within the distanceofpnare considered to be in the neighbourhood ofpn. Hence, the number of clusters and the number of pictures associated with any cluster depend on the sizeof the neighbourhood and on the minimum number of pointsM
that must be present within each neighbourhood. We setMto 2% of the number of photos uploaded by any given user, and=0.5. This value is expressed in coordinate units, and sets the area of each neighbourhood at a value approximately equal to that of the Greater London metropolitan area.
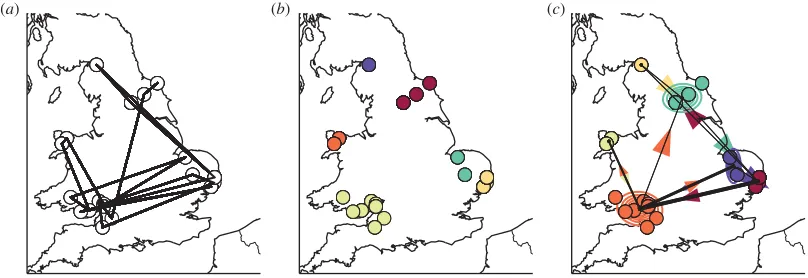
Figure 1ashows the set of locations and the trajectory obtained from geo-tagged photos uploaded by a user, andfigure 1bdisplays the result of clustering. Six distinct clusters are identified by the DBSCAN algorithm and are located, from south-west clockwise, around Bristol, northern Wales, Glasgow, North York Moors National Park, Norfolk and Suffolk.
We propose that the movement ofFlickrusers, observed by collecting geo-tagged metadata, is driven by unobserved factors. For example, one individual might reside in Bristol, visit relatives in Suffolk, and spend holidays in northern Wales. To model these high-level driving factors, we employ a Hidden Markov Model (HMM) [34]. HMMs are statistical models that comprise hidden states and emission probability distributions. Continuing with our example, the hidden state might take one of four values in the set{’Home in Bristol’, ’Family visit in Suffolk’, ’Holiday in Wales’}. Each of the hidden states will generate observations according to a probability distribution conditional on the hidden state. In this study, we employ Gaussian emissions, which means that given a state, the observed location of geo-tagged photos emitted by that state follows a Gaussian probability distribution. Fitting the model to the observed data produces estimates of the parameters of the Gaussian distributions associated with each state, and of the transition probability describing how likely a user is to switch from one state to another. We infer a sequence of most likely states by using the Viterbi algorithm [35], which yields a trajectory between hidden states where each photo together with its corresponding time stamp is associated with a particular state.
3
rsos
.ro
yalsociet
ypublishing
.or
g
R.
Soc
.open
sc
i.
2
:1
[image:4.522.60.464.43.182.2]50046
...
(a) (b) (c)
Figure 1.Model of an individual’s mobility. (a) Individual trajectory depicting the location of geo-tagged photos uploaded by one of
the users in theFlickrdatabase. (b) Different colours indicate clusters discovered by the DBSCAN algorithm. (c) Different colours identify hidden states learned by a Hidden Markov Model, while the contour plots indicate Gaussian distributions learned for each state. The thickness of lines between different clusters is proportional to the number of times the user has moved between the two states, as estimated by the Viterbi algorithm. Arrows indicate the relative proportion of incoming and outgoing movements from one hidden state to the other.
we see that the clusters identified by the DBSCAN algorithm have been retained by the HMM. This is not guaranteed to be true in general, as DBSCAN only takes into account the spatial distribution of geo-tagged photos, whereas the HMM also incorporates information about the sequence of visited places that might determine a different mapping between locations and hidden states. The contour plots infigure 1crepresent the Gaussian distributions learned for each hidden state, and the thickness of the lines connecting any two hidden states is proportional to the number of transitions between states, as estimated by the Viterbi algorithm. We note that the transition matrix is sparse, meaning that large movements only occur between some hidden states. This is also evident from figure 1a, as no movements are registered, for example, between northern Wales and Glasgow. We recognize the area around Bristol as the main source and destination of transitions, which suggests that this particular person might live there. Finally, the arrows in figure 1c depict the relative volume of incoming and outgoing transitions between any pair of clusters, hinting at the fact that there might be preferred travel sequences (for example, going from Bristol, to North York Moors National Park and Suffolk, but not in the opposite order).
2.2. Aggregate mobility model
Having analysed the trajectory of a single user, we now focus on deriving aggregate results for all the users in the dataset. This will allow us to infer general patterns that describe the probability of finding anyFlickruser in a given geographical area, and the probability of transition between pairs of areas. Figure 2adisplays the function logp(x) derived in equation (4.1) that describes the log-likelihood of finding a Flickruser in a given geographical location. The silhouette of Great Britain and Northern Ireland are clearly visible, along with areas of high probability corresponding to main UK cities. To obtain a set of points corresponding to maximum values of the functionp(x), we employ a maximum filter. This is a commonly used tool in image processing that operates on a two-dimensional function by applying a sliding rectangular window of dimensions (dx,dy), selecting the local maximum within each window, and setting to zero all the other values. Since some areas do not contain notable local maxima (for example, regions located in open sea), we also thresholded the local maxima retaining only the ones with probability greater than a levelφ.
4
rsos
.ro
yalsociet
ypublishing
.or
g
R.
Soc
.open
sc
i.
2
:1
50046
...
(b)
(a)
Figure 2.Aggregate model of mobility. (a) Probability of an individual’s location derived from data uploaded by all the users in theFlickr
dataset. The plot depicts the natural logarithm ofp(x) as defined in equation (4.1). This describes the likelihood of finding aFlickruser in each geographical location and, since the dataset contains photos uploaded in the UK, it resembles the shape of the UK. The points in the map are local maxima identified with a maximum filter and thresholding, and correspond to the location of main UK cities. The names indicated in black indicate cities that do not appear in the list of the 20 most populous UK cities. (b) Aggregate transition probability between pairs of main UK cities. The line widths are proportional top(xd,xo)+p(xo,xd) as defined in equation (4.2) and represent the probability of observing a transition between any two pairs of cities, aggregated over all the users in the dataset.
15 km from the centre of the corresponding city, as computed by comparing the coordinates obtained from Wikipedia and the coordinates of the local maxima. Figure3adepicts the tradeoff between precision and recall obtained by varying the sizes (dx,dy) between (18 km, 28 km) and (90 km, 140 km) expressed in terms of the radiusr=dxdy, and the thresholdφbetween 10−3and 10−4. TheF-measure is defined as the harmonic mean between precision and recall, and is a measure of the overall accuracy of the cities’ identification. The maximumF-measure obtained was 0.63, corresponding to a size of (54 km, 84 km) and a thresholdφ=2.78×10⁻³.Figure 2aindicates the cities identified with these parameters, highlighting
the ones that appear on the list of 20 most populous UK cities.
From the set of HMM models learned from all the users in our dataset, we can infer the probability that a user travels from any pair of geographical locations, hence obtaining a map of travel volumes between origin and destination pairs.Figure 2bdepicts the aggregated transition probabilities between the cities corresponding to local maxima identified infigure 2a. For any pair of cities (xd,xo), the functionp(xd,xo)
derived in equation (4.2) describes the probability of observing a transition between cityxoand cityxd
across allFlickrusers. If we assume that the sump(xd,xo)+p(xo,xd) is a proxy for the mobility flow
occurring in both directions between the pair, we obtain values proportional to the thickness of the lines connecting any two cities infigure 2b. The largest flux is registered between London and Edinburgh, while other main fluxes are estimated between the capital and other major cities, as well as between Edinburgh and Glasgow and Cardiff and Birmingham. In general, fluxes between two cities appear to be positively correlated to the cities’ sizes and negatively correlated to their mutual distance, that is in agreement with previous research on gravity models of human mobility [36].
5
rsos
.ro
yalsociet
ypublishing
.or
g
R.
Soc
.open
sc
i.
2
:1
[image:6.522.59.470.43.242.2]50046
...
0.2 0.1 0.2 0.3 0.4 0.5
recall
p
(no. journeys)
0.6 0.7 0.8
(a) (b)
0.3 0.4 0.5 0.6 precision
0.7 0.8 0.9
F-measure = 0.63
rª100 km
rª80 km
rª60 km
rª40 km
rª20 km
max. filter radius
10 102
data lognormal fit
no. journeys
Flickr 92% better than random
103
1.0 10
–4
10–3
10–2
10–1
Figure 3.Evaluation of the aggregate model of mobility. (a) Identification of the 20 most populous UK cities. The plot depicts a tradeoff
between precision (the number of correct identifications divided by the total number of cities identified) and recall (the number of correct identifications divided by 20) when a maximum filter is applied to the functionp(x). Different lines correspond to different radii of the maximum filter, and values along the lines are obtained by varying the thresholdφbetween 10−3and 10−4. The optimal parameters for the maximum filter corresponding to anF-measure of 0.63 arer≈60 km andφ=2.78×10⁻³. (b) The number of journeys per city pair as estimated from the NTS data is consistent with a lognormal distribution, with most pairs corresponding to less than 100 observed journeys, and a few pairs with at most about 400 journeys. We generated random variables according to this lognormal distribution, and computed their distance to the NTS estimates. We find that 92 out of 100 trials, the distance between theFlickrand NTS estimates is smaller than the distance between the randomly generated estimates and the NTS estimates.
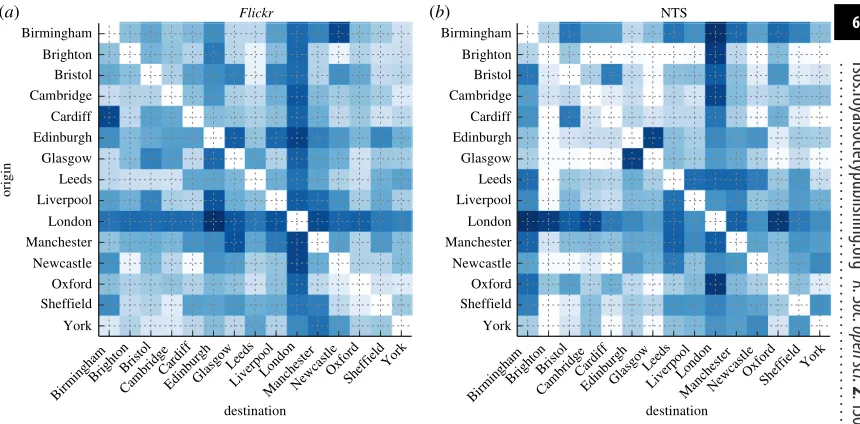
and reasons of journeys. Each record in the NTS database also specifies the origin and destination of journeys at the unitary authority boundary level (see the electronic supplementary material), that is an administrative entity which can be typically associated with a city in the UK. We selected data for the years from 2007 to 2013 (the same period covered by theFlickrdataset), counted the number of journeys for each origin/destination pair between the cities considered infigure 2a, and arranged the totals in a matrix of travel volumes across origin/destination pairs, as depicted infigure 4. For comparison, we also show the matrix of travel volumes obtained from theFlickrdataset. Some of the main trends are consistent across the two matrices, such as the prevalence of London as a source and destination of large travel volumes, and the large amount of journeys between Glasgow and Edinburgh. Other trends present in the NTS matrix, on the other hand, are not reflected by the data derived fromFlickr, such as the very large travel volumes between London and nearby commuting cities like Brighton and Oxford.
In interpreting these results, two main factors regarding the NTS dataset need to be taken into account. On the one hand, unitary authority boundaries only loosely map to the areas covered by main UK cities, while our method uses the probability distribution learned from theFlickrdatasetp(xd,xo), that
6
rsos
.ro
yalsociet
ypublishing
.or
g
R.
Soc
.open
sc
i.
2
:1
50046
... Birmingham Brighton Bristol Cam bridge Cardiff Edinburgh Glasgoworigin LiverpoolLeeds
London Manchester Newcastle Oxford Sheffield York Birmingham Brighton Bristol Cam bridge Cardiff Edinburgh Glasgow Leeds Liverpool London Manchester Newcastle Oxford Sheffield York Birmingham BrightonBristol Cam bridge Cardiff EdinburghGlasgow Leeds LiverpoolLondon Man chester Newcastle Oxford Sheff
ield York
Flickr destination Birmingh am Brig hton Brist ol Cam brid ge Cardiff EdinburghGl asgowLeeds LiverpoolLondo n ManchesterNewcastle Oxfo rd Sheffiel d York destination NTS (b) (a)
Figure 4.(a,b) ComparingFlickrestimates with official data. Number of journeys for each pair of cities of origin and destination as
estimated by the model based onFlickrdata and by the National Travel Survey (NTS) data. Each matrix displays values on a logarithmic scale from light blue (small number of journeys) to dark blue (large number of journeys). Units are not comparable between the two estimates, therefore the figures have been independently normalized in each matrix prior to visualization. The correlation between the two (non-normalized) estimates is moderate, but significant (Kendall’s tau coefficientτ=0.45,p<0.001,N=210). Kendall’s tau has been used instead of Pearson’s correlation because the data are not normally distributed.
3. Conclusion
We propose a method for inferring in what geographical areas individuals are likely to be found, and between which areas they are likely to travel, by modelling data obtained from the photo-sharing website
Flickr. Our approach is motivated by the finding that human mobility obeys universal statistical patterns mathematically described by Lévy flights, and that hidden or ‘latent’ factors that drive the emergence of these patterns can be modelled using machine learning techniques, yielding estimates of geographical location probabilities and transition probabilities between distant areas.
We aggregate models independently learned from the movements of about 16 000Flickr users to infer general patterns of human mobility in the UK, essentially learning maps and travel flows from data alone. Although the evaluation of our method is sometimes difficult due to the lack of extensive official surveys on mobility at the country level, our findings appear to be in general agreement with the evidence available, providing a novel statistical tool for the analysis of online data sources, and adding to the evidence that online data can be used to quantify human travel.
The analysis presented here can also be extended by considering different spatio-temporal scales, such as movements between different city neighbourhoods, or by exploring seasonal patterns that may arise from individuals’ trajectories or from aggregated travel patterns.
4. Material and methods
4.1. Data collection
We used the flickr.photo.search API to download metadata on all the publicly viewable photographs uploaded on the site between 2007 and 2013, for which both timestamps and geographical coordinates were available. The dataset was downloaded in March 2014. The resulting dataset consists ofjsonrecords describing more than 140 million pictures uploaded by about 1.7 million users.
7
rsos
.ro
yalsociet
ypublishing
.or
g
R.
Soc
.open
sc
i.
2
:1
50046
...describes photographs taken by roughly 1 million users. From this dataset, we selected photos taken in the UK, obtaining about 8 million photos uploaded byca16 thousand users.
Considering data from online photo-sharing platforms as a proxy for human mobility has inherent limitations, including the fact that pictures taken by a user a long time apart are likely to show an incomplete trajectory. However, this problem is mitigated by the fact that the time elapsed between consecutive photos follows a heavy tailed distribution (electronic supplementary material, figure S2), with most photos taken only a few hours or a few days apart, and only a small number of photos taken as much as a few years apart.
4.2. Aggregate model
The aggregate probability of finding a Flickruser in a geographical areax=[xlon,xlat] defined by its
longitude and latitude coordinates is given by the function:
p(x)= N
n=1
p(x|un)p(un). (4.1)
This is a sum of the probabilitiesp(x|un) which represent the likelihood of finding a given userunin the locationxweighted by the probability that the observed data have been generated by userun. The derivation of equation (4.1) from theFlickrdataset is detailed in the electronic supplementary material.
The probability of observing a transition between the origin coordinates xo and the destination
coordinatesxdis given by the function:
p(xd,xo)=
N
n=1
p(xd,xo|un)p(un). (4.2)
This is a sum of the probabilitiesp(xd,xo|un) which represent the likelihood of observing the userun making a transition between the two geographical areas, weighted byp(un) that indicates the likelihood of observing a transition generated by userun. The derivation of equation (4.2) from theFlickrdataset is detailed in the electronic supplementary material.
Data accessibility. A dataset containing metadata about the geo-tagged photos uploaded onFlickris available as electronic supplementary material. This can be used to reproduce the results presented in this paper.
Authors’ contributions. D.B. acquired data and drafted the manuscript, all authors contributed to the conception of the work and the analysis of the data, revised the manuscript and approved it for publication.
Competing interests. We declare we have no competing interests.
Funding. All authors acknowledge support from the RCUK Digital Economy grant EP/K039830/1 via the EPSRC. Acknowledgements. The authors thank Christian Alis for discussions.
References
1. Raichlen DA, Wood BM, Gordon AD, Mabulla AZ, Marlowe FW, Pontzer H. 2014 Evidence of Lévy walk foraging patterns in human hunter–gatherers.
Proc. Natl Acad. Sci. USA111, 728–733. (doi:10.1073/
pnas.1318616111)
2. Rozenfeld HD, Rybski D, Andrade JS, Batty M, Stanley HE, Makse HA. 2008 Laws of population growth.Proc. Natl Acad. Sci. USA105, 18 702–18 707. (doi:10.1073/pnas.0807435105)
3. Berlingerio M, Calabrese F, Lorenzo GD, Nair R, Pinelli F, Sbodio ML. 2013 Allaboard: a system for exploring urban mobility and optimizing public transport using cellphone data. InECML/PKDD 2013, Part 3, 23–27 September 2013, Prague, Czech
Republic, pp. 663–666. Berlin, Germany:
Springer-Verlag.
4. Botta F, Moat HS, Preis T. 2015 Quantifying crowd size with mobile phone andTwitterdata.R. Soc.
open sci.2, 150162. (doi:10.1098/rsos.150162)
5. Chaturapruek S, Breslau J, Yazdi D, Kolokolnikov T, McCalla SG. 2013 Crime modeling with Lévy flights.
SIAM J. Appl. Math.73, 1703–1720. (doi:10.1137/1208
95408)
6. Aalto L, Göthlin N, Korhonen J, Ojala T. 2004 Bluetooth and wap push based location-aware mobile advertising system. InProc. 2nd Int. Con. on Mobile Systems, Applications, and Services, MobiSys
’04,6–9 June 2004, Boston, MA, USA, pp. 49–58.
New York, NY: ACM.
7. Hufnagel L, Brockmann D, Geisel T. 2004 Forecast and control of epidemics in a globalized world.Proc.
Natl Acad. Sci. USA101, 15 124–15 129. (doi:10.1073/
pnas.0308344101)
8. Colizza V, Barrat A, Barthelemy M, Valleron A-J, Vespignani A. 2007 Modeling the worldwide spread of pandemic influenza: baseline case and containment interventions.PLoS Med.4, e13. (doi:10.1371/journal.pmed.0040013) 9. Gonçalves B, Balcan D, Vespignani A. 2013 Human
mobility and the worldwide impact of intentional localized highly pathogenic virus release.Sci. Rep.3, 1–7. (doi:10.1038/srep00810)
10. Wang D, Pedreschi D, Song C, Giannotti F, Barabási A-l. 2011 Human mobility, social ties, and link prediction categories and subject descriptors. In
Proc. 17th ACM SIGKDD Int. Conf. on Knowledge
Discovery and Data Mining,21–24 August 2011, San
Diego, CA, USA, pp. 1100–1108. New York,
NY: ACM.
11. Musolesi M, Mascolo C. 2007 Designing mobility models based on social network theory.ACM
SIGMOBILE Mobile Comput. Commun. Rev.11, 59–70.
(doi:10.1145/1317425.1317433) 12. De Domenico M, Lima A, Musolesi M. 2013
Interdependence and predictability of human mobility and social interactions.Pervasive Mobile
Comput.9, 798–807. (doi:10.1016/j.pmcj.
2013.07.008)
13. Hawelkaa B, Sitkoa I, Beinat E, Sobolevsky S, Kazakopoulosa P, Ratti C. 2014 Geo-located Twitter as the proxy for global mobility patterns.Cartogr.
Geogr. Inform. Sci.41, 260–271. (doi:10.1080/15230
8
rsos
.ro
yalsociet
ypublishing
.or
g
R.
Soc
.open
sc
i.
2
:1
50046
...
14. Lazer Det al.2009 Computational social science.
Science323, 721–723. (doi:10.1126/science.
1167742)
15. Vespignani A. 2009 Predicting the behavior of techno-social systems.Science325, 425–428. (doi:10.1126/science.1171990)
16. Schweitzer F, Fagiolo G, Sornette D, Vega-Redondo F, Vespignani A, White DR. 2009 Economic networks: the new challenges.Science325, 422–425. (doi:10.1126/science.1173644) 17. King G. 2011 Ensuring the data-rich future of the
social sciences.Science331, 719–721. (doi:10.1126/ science.1197872)
18. Schich M, Song C, Ahn Y-Y, Mirsky A, Martino M, Barabási A-L, Helbing D. 2014 A network framework of cultural history.Science345, 558–562. (doi:10.1126/science.1240064)
19. Moat HS, Preis T, Olivola CY, Liu C, Chater N. 2014 Using big data to predict collective behavior in the real world.Behav. Brain Sci.37, 92–93. (doi:10.1017/ S0140525X13001817)
20. Baronchelli A, Radicchi F. 2013 Lévy flights in human behavior and cognition.Chaos, Solitons Fractals56, 101–105. (doi:10.1016/j.chaos.2013.07.013) 21. Petersen AM, Fortunato S, Pan RK, Kaski K, Penner
O, Rungi A, Riccaboni M, Stanley HE, Pammolli F. 2014 Reputation and impact in academic careers.
Proc. Natl Acad. Sci. USA111, 15 316–15 321.
(doi:10.1073/pnas.1323111111)
22. Paldino S, Bojic I, Sobolevsky S, Ratti C, González MC. In press. Urban magnetism through the lens of geo-tagged photography. (http://arxiv.org/abs/ 1503.05502)
23. Preis T, Moat HS, Stanley HE, Bishop SR. 2012 Quantifying the advantage of looking forward.Sci. Rep.2, 350. (doi:10.1038/srep00350) 24. Preis T, Moat HS. 2014 Adaptive nowcasting of
influenza outbreaks using Google searches.R. Soc.
open sci.1, 140095. (doi:10.1098/rsos.140095)
25. Curme C, Preis T, Stanley HE, Moat HS. 2014 Quantifying the semantics of search behavior before stock market moves.Proc. Natl Acad. Sci. USA111, 11 600–11 605. (doi:10.1073/pnas.1324054111) 26. Moat HS, Curme C, Avakian A, Kenett DY, Stanley
HE, Preis T. 2013 QuantifyingWikipediausage patterns before stock market moves.Sci. Rep.3, 1801. (doi:10.1038/srep01801)
27. Alanyali M, Moat HS, Preis T. 2013 Quantifying the relationship between financial news and the stock market.Sci. Rep.3, 3578. (doi:10.1038/srep03578) 28. Barchiesi D, Moat HS, Alis C, Bishop S, Preis T. 2015
Quantifying international travel flows using Flickr.
PLoS ONE10, e0128470.
(doi:10.1371/journal.pone.0128470)
29. Preis T, Moat HS, Bishop SR, Treleaven P, Stanley HE. 2013 Quantifying the digital traces ofHurricane
Sandyon Flickr.Sci. Rep.3, 3141.
(doi:10.1038/srep03141)
30. Brockmann D, Hufnagel L, Geisel T. 2006 The scaling laws of human travel.Nature439, 462–465. (doi:10.1038/nature04292)
31. González MC, Hidalgo CA, Barabási A-L. 2008 Understanding individual human mobility patterns.Nature453, 779–782. (doi:10.1038/nature 06958)
32. Jeung H, Shen HT, Zhou X. 2007 Mining trajectory patterns using Hidden Markov models. InDaWak ’07 Proc. 9th Int. Conf. on Data Warehousing and Knowledge Discovery, 3–7 September 2007,
Regensburg, Germany, pp. 470–480. Berlin,
Germany: Springer-Verlag. 33. Ester M, Kriegel H-p, Sander J, Xu X. 1996
A density-based algorithm for discovering clusters in large spatial databases with noise. InProc. Second Int. Conf. on Knowledge Discovery and Data
Mining(KDD-96), 2–4 August 1996, Portland,
Oregon, USA, pp. 226–231. Menlo Park, CA:
AAAI Press.
34. Rabiner LR. 1989 A tutorial on hidden Markov models and selected applications in speech recognition.Proc. IEEE77, 257–286. (doi:10.1109/5.18626)
35. Forney, Jr GD. 1973 The viterbi algorithm.Proc. IEEE
61, 268–278. (doi:10.1109/PROC.1973.9030) 36. Erlander S, Stewart TP. 1990The gravity model in
transportation analysis. Utrecht, The Netherlands: