(In)Capable Deceivers
What a game of poker tells about possible individual deceiving differences
Quinten Mandjes
S1842978
University of Twente
Behavioural Management Studies
Psychology of Conflict, Risk, and Safety
1
“There are three types of lies -- lies, damn lies, and statistics.”
2
Abstract
Over the past years, deception detection research has mainly focussed on the deception detector, but not on the one trying to deceive. Studies have uncovered some results about the effects of the relations between the liar and the detector, characteristics, questioning methods, knowledge of deception, and more. Yet, the influence a liar has on the deception detection is unknown. Studies have pointed out that people try to control their behaviour while deceiving others (Interpersonal Deception Theory) and that this leads to differences in how people move when they deceive (Rigidity Effect). Yet, it is not researched how capable people are in controlling their own behaviour and if there is a difference between people in this capability of control. Therefore, this study measured a difference in the movement of the legs, arms, head, and torso when someone was deceiving others versus when someone was not deceiving others and if there is a difference between people in this movement contrast.
These differences were measured in a total of 53 participants during multiple Texas Hold’em Poker games of 60 minutes with a maximum of 4 players and a minimum of 3 at the time. From this game, three clips of the participant bluffing and three clips of the participant participating but not bluffing were selected. From these two different observations, the average movement a participant made in these clips was calculated. To investigate if an individual’s deceitful movement is less compared to when that person moves truthfully a within-subject design was used and a between-subject design was used to investigate if there are liars who are more capable to deceive because their movement contrast is less influenced by deceit.
When participants deceived others, they significantly moved their head and overall body less compared to when they were truthful. This means that a rigidity effect was found, but not on all body parts. The cluster analysis showed that there are more individual differences in truthful behaviour compared to deceitful behaviour, which is in line with finding a rigidity effect. Because when there is less movement to detect the individuality will also decline. The cross-cluster analysis showed there is a possible predictability for some people because they belonged to one truthful cluster and one deceitful cluster. Meaning that for some participants specific types of movements when being truthful lead to specific types of movements when they deceived. However, there were no relations found between these cluster combinations and other variables. Participants who performed the worst based on what they earned during the game, had more truthful-deceitful movement contrast in comparison with those who performed the best, the second best, and the second worst. Those who performed better in the poker game were more capable deceivers because they had less truthful-deceitful moving contrast on which a lie detector can base a decision.
Some of the study’s findings can be linked to the poker game set-up which was used to gather the data. Poker showed to be a challenging, but fruitful study environment for deception. The results are promising to find further evidence that people differ in their movements when they deceive others and that people differ on their capability to deceive others. Subsequent poker studies will likely add to these findings and expand the knowledge of deception in more real-life situations compared to the lab experiment studies.
3
Introduction
People want to be able to recognize deception and are willing to spend their money on commodities that enlighten them in this subject, but this profitable opportunity created a strain on scientific findings. Individuals and companies invest thousands in those that claim they can train others into becoming a human lie detector (Denault et.al., 2019). The internet is filled with instructional videos on how to recognize cues and bookstores are stacked with informational books on how to tell whether someone is lying to you or not. On Google alone ‘lie detection' generates circa 63 million results and Amazon offers 410 books on the same search. These books, videos, and courses are often based on results from peer-reviewed research, but made more comprehensible for non-scientific audiences. This leads to people thinking the information they get is always applicable and everywhere. However, scientific research focusses on very specific circumstances because the environment needs to be controlled in laboratory research. Real life situations are less controlled and influenced by more stimulations making significant research findings unreliable or invalid for real life. Over the years studies that have focused on deception detection have produced many inconsistent findings and are often criticized by those who study it making some of the findings still uncertain (Shaw & Lyons, 2017). One thing that is certain, there is not one simple solution when it comes to detecting deception (Burgoon, Guerrero, & Floyd, 2010; Knapp, Hall, & Horgan, 2014; Moore, Hickson, & Stacks, 2014; Patterson, 2011).
Many still ponder over the definition of deception. Some use deception and lying interchangeably, while others look for a clear distinction (DePaulo, et al., 2003). Buller and Burgoon, (1996) define deception as “a message knowingly transmitted by a sender to foster a false belief or conclusion by the receiver”. In most cultures, deception is deemed a violation of cultural norms (National Research Council, 1991). Therefore, people who deceive do not want to get caught in fear of repercussions. This leads a liar to concentrate highly while lying, become psychologically and physiologically aroused, and experience strong feelings of guilt and anxiety (Vrij, 2007). Having to deal with these internal factors and having to suppress these behaviours can lead an individual to make mistakes. These mistakes are called “leakage” or “cues” (Zuckerman, DePaulo, & Rosenthal, 1981; Hearn, 2006).
These cues can be verbal and non-verbal. Non-verbal cues can be physiological signs, e.g. sweating, or body language, e.g. gestures, movements, and certain mannerisms (Merriam-Webster, 2019). Verbal cues can be a slip of the tongue in which a person says something they were trying to conceal. Deception detection depends on these cues because it is assumed that these signals reflect an inner state of the person (Druckman & Bjork, 1991). If the liar does not emit these cues induced by the internal conflict of lying, then a lie catcher has nothing to spot. Based on these descriptions the chances of catching a liar depend on at least three things: (1) the lie catchers’ abilities to recognize these cues, because better knowledge and understanding of these cues allow one to read the behaviour of another, (2) the liars’ ability to suppress these cues, because fewer cues means less concrete evidence for the lie catcher, and (3) the circumstances in which the conversation is held that heighten or lower the abilities of the lie catcher or the liar (Hearn, 2006). Circumstances can be the methods of interrogation, but also the relationship between the liar and the lie receiver. Most research has focussed on lie catcher’s abilities to discriminate lies from truth and some on the circumstances all from the perspective of the lie catcher, yet research into the abilities of the liar has been slim to none as will become clear later on.
4 always judged by others to be deceiving when (s)he is deceiving and always judged to be telling a truth when (s)he is telling a truth (Bond & DePaulo, 2008). Considering IDT, a capable deceiver would try and perform behaviour as close to the truthful behaviour as possible, to have a limited truth-lie contrast in movement (Hartwig, Granhag, Strömwall, & Doering, 2010). That way a lie catcher has fewer cues to detect the deception. So far, no one has measured the contrast in movement when an individual is lying versus when that same person is truthful and if there is a difference in this contrast between liars.
Therefore, to determine if these inferences are right this study sets out to compare an individual’s deceitful movement and truthful movement to test if people’s movement is influenced by deceit and if there are better liars whose movements are less influenced by deceit.
Lie catching
Deception detection research typically follows two different approaches. Both approaches compare one group, deceptive participants, with another group, truth-telling participants, to examine between-group differences. Both of these approaches often aim to improve the abilities of the detector (Dunbar et al., 2011; Chan, Khader, Ang, Chin, & Chai, 2016).
The first deception detection approach examines the ability of the deception detector. This includes research aiming to improve deception detection through training and is often subjected to law enforcement settings (Levine, Feeley, McCornack, Hughes, & Harms, 2005; Frank & Feeley, 2003). These studies have found that detectors vary little from each other and that their accuracy is around 54% (Bond & DePaulo, 2008). On the other hand, studies involving Paul Ekman which focussed on specific groups with pre-existing talent, relevant experience, and who were highly motivated to catch a liar (O’Sullivan, 2008), found that within these groups the accuracy rates of catching a liar was higher than 54%. Research showed that federal polygraphers and robbery investigators were equally accurate in discriminating between lies and truth, however within that same study more than 20% of the federal polygraphers and robbery investigators were highly accurate in discriminating lies from the truth (Ekman & O'Sullivan, 1991). After these findings, they did more research and found a mean accuracy of 73% and 67% in a preselected group of law enforcers (Ekman, O'Sullivan, & Frank, 1999). Subsequently, they found groups of professionals that scored significantly higher than chance: clinical/forensic psychologists (68%), forensic psychiatrists (69%), secret service agents (64%) (Ekman & O'Sullivan, 1991), and federal judges (62%) (Ekman et al., 1999).
The second deception detection approach examines the behaviours of those who deceive to find specific cues which would make a deceiver more detectable (Dunbar et al., 2011). This often focusses on universal cues. A specific behaviour that is portrayed by everyone when lying. A meta-analysis from DePaulo et al. (2003) found up to 158 different cues that were portrayed by subjects when deceiving. The analysis of these cues showed that there is only a weak link or no link to deception. However, studies have shown that people vary considerably in demeanour, even when they are not trying to deceive others. A person’s demeanour can also explain up to 98% of the variance in deception detection accuracy (Levine et.al, 2011). Perhaps there is no universal cue, because behaviours, truthful or deceitful, are so different from each other. A focus on a more individual cue to deception might give different results in these cues to deception.
5 detection, but the number of these studies is still low. These studies focus on ways to enhance deception detection by influencing the participants with e.g. familiarity or a questioning method. Brandt, Miller, and Hocking (2009) found detectors who had prior exposure to the liar were significantly better at detecting deception than those who did not meet the liar before, yet meeting the liar multiple times did not significantly increase accuracy. This was also reported by Palena, Caso, Carlotto, De Mizio, and Marciali, (2017) who studied the effects of baseline information. A truth baseline has potential as an interviewing technique for its efficacy which could be rooted in the interpersonal dynamics or intrapersonal differences that may cause different cues to deception.
Research in interviewing techniques also found better truth-lie discrimination results. Vrij, Mann, Robbins, and Robinson (2006) found a truth-lie discrimination mean accuracy of 72% when liars were questioned in a high cognitive questioning method. Finally, Levine, Shaw, and Shulman (2010) found a positive influence of strategic interrogative questioning on detecting deception. Research into differences in characteristics has generally reported negative findings. So far no reliable effect has been found on a detectors Machiavellianism, self-monitoring, or gender (Zuckerman, DePaulo, & Rosenthal, 1981) age, education, expertise, confidence (Aamodt & Mitchell 2006), or demographics (Levine, Park, & McCornack, 1999) on the ability to discriminate lies from truth. Only a few researchers have studied individual differences in lie detection abilities and there has not yet been a large-scale analysis of this ability (Bond & DePaulo, 2008).
Thus, while people are on average no better than chance to catch a liar, there are influences which creates better chances to catch a liar. These influences can heighten the accuracy from 10% to up to 15%. These influences could be the profession of the lie catcher, a training which influences the ability of the lie catcher or only a subject’s engagement or a questioning method which influence the abilities of the deceiver. However, the ability of the deceiver is not included or researched in these kinds of studies nor the effect the deceivers' ability has on the accuracy.
Studying deception
Deception detection research is often criticized on whom was studied, the way the research was designed, the validity, and the generalizability (O'Sullivan, 2008, Denault et al, 2019; Bond & DePaulo, 2008). Experiments are often done in laboratories where conditions are managed, therefore natural behaviour is often disturbed. During experiments, judges are asked to identify from one clip if the person that is shown is lying or telling the truth. They have to base their decision on the speech and body part that is shown in the clip. In the real world, people can rely on motivational information, (more) physical evidence, and information from others (Bond & DePaulo, 2008). Most research uses students to study deception detection because they are available at universities and are cost effective. However, research has shown that motivation is a big part of deception detection as well as for the detector as for the deceiver (DePaulo & Kirkendol, 1989; O’Sullivan, 2008; Levine et al., 2005; Shaw & Lyons, 2017). Yet, this group often lacks the motivation and expertise to detect deception which could explain why most of these studies have resulted in only a slightly higher than chance correct discrimination between truth and lies (Bond & DePaulo, 2006; 2008). Who would be appropriate to study deception detection, has not yet been determined (O’Sullivan, 2008). All these flaws and limitations could explain why there are so many inconsistent findings in deception detection research (Shaw & Lyons, 2017).
6 necessary to increase winning chances (Chen & Ankenman, 2006; Vrij, Semin, & Bull, 1996). Therefore, participants will need to be engaged in the game to win and will have to deceive other players in order to win. Paul Ekman (2001) has long argued that to study and detect lies and deceit, high stakes should be involved. Otherwise, the subject might not be sufficiently emotionally or cognitively engaged to provide needed cues to detect deceit. Poker can naturally create or mimic high stake situations and this engagement that coincides with high stakes is needed to evoke and study these elicited cues.
A well-known form of deception in poker is called bluffing. Bluffing refers to betting or raising (showing strength) while having a weak hand (cards with low winning chances) to make the opponent fold (give up). Another form of deception in poker is slow-playing (comparable to trapping an opponent). This is the opposite of bluffing. A player bets weakly or not at all with a very strong hand to trap the opponent into betting or raising with a weaker hand. Both strategies increase the profitability of playing with weak or strong poker hands by inducing a false belief in one’s opponent about what cards the player is holding (Palomäki, Yan, & Modic, 2016).
Thus, while many criticisms exist on deception detection research, new technology opens a way to study other environments that are less controlled as an experiment and mimic better real-life situations with better generalizability to other settings and higher cognitive engagement.
Liar’s ability
Bond, Kahler, and Paolicelli (1985) concluded that the detection of deception depends more on the individual lying than the individual trying to detect the lie. Bond and DePaulo (2008) discovered that individuals differ in detectability and credibility. They discovered that some individuals are easier detected when lying than others and that some people are found more credible than others. Credibility differences are even higher when people are lying, meaning that people find it harder to judge if someone is lying to them when they are being lied to, compared to when someone is telling them the truth (Bond & DePaulo, 2008).
As part of the IDT, Zuckerman et al. (1981) theorized that liars adopt a stiff, wooden posture due to over controlling their behaviour to not look like the stereotype fidgety and nervous liar – called the Rigidity effect. This means that someone moves less when they lie than when that person is being honest. Several experiments confirmed that those who deceive, suppress their gestures to limit compromising behaviours (Buller and Aune, 1987; Vrij, 1995; Vrij, et al., 1996; DePaulo et al., 2003; Caso, Vrij, Mann, & De Leo, 2006; Mullin, 2012). Rigidity studies have been successful in discriminating truthful from deceptive responses with accuracies between 60% and 81% (Twyman, Elkins, & Burgoon, 2011). When participants were informed about the rigidity effect, they still failed to control their behaviour (Vrij, et al., 1996). This effect infers a visible difference in behaviour people could see when trying to detect deception even during short and controlled interviews (Twyman et.al., 2011) and explains the differences found in detectability (Bond & DePaulo, 2008). Rigidity was previously researched with the use of trained human coders. These coders used a Likert scale to code the behaviour and then the average of the coders was the data. This required many man-hours and afterwards was still not as reliable as the use of technology (Twyman et.al., 2011). With the use of technology, this effect could be studied in a more objective manner.
7 taxonomies of gestures to clarify the behaviours (Buller, Burgoon, Buslig, & Roiger, 1994; Caso, Maricchiolo, Bonaiuto, Vrij, & Mann, 2006) and the differences of this individual movement between others is still unclear.
Also, other research supports that when people lie, they would all lie differently and with different nuances. According to Masip, Garrido, and Herrero (2004), people are born advantaged or disadvantaged when it comes to lying. Those who are born with a so-called ‘baby face' are often more believed than those who have a more mature face. During childhood, this can influence how an individual grows up, as a capable liar or as someone who is more honest. By social reinforcement, baby face children discover they can avoid punishment when lying and therefore learn to develop their lying abilities. Those with a dishonest face learn to tell the truth after failed attempts of deception and never discover their possible potential (Zebrowitz, Voinescu, & Collins, 1996). Another reinforcement is that people choose the persons they surround themselves with. In some cases, highly detectable liars and some cases advanced liars. Those who interact with the latter develop better lie detection skills in the real world than others (Bond & DePaulo, 2008). Other possibilities are that these persons developed ethical compunctions towards lying, are not able to regulate deception-related emotions, poor at masking emotions, or perhaps they are cognitively not strong enough to compute plausible tales. (Bond & DePaulo, 2008). Finally, a study of the brain with fMRI scans revealed that when different people are tested in the same situation different patterns of brain activity are shown on the fMRI scans (interpersonal differences). When the same person was subjected to a different situation, also different patterns of brain activity emerged (intrapersonal differences) (Vrij, 2008a, p.371).
Some researchers have tried to define capable and incapable liars and investigated if there is a recognizable difference between them. For instance, Levine (2016) examined the variability of deceivers and found data suggesting the existence of an unusually transparent liar. His results highlighted the importance of individual differences in deceivers that influence deception detection. Caso, Maricchiolo, Livi, Vrij, and Palena (2018) identified a capable liar as someone who was correctly identified by no more than 30% of observers and a bad liar someone who is judged as a liar by at least 70% of observers. This study seemed to categorize liar differences, however, the used footage for that research came from another research where the participants were subjected to a mock crime. So, participants in this study were not intrinsically motivated to deceive. Moreover, these statistics were based on the subjectivity of the detectors, therefore the individual differences between deceivers are not defined. Others, such as Aldert Vrij (2008b), tried to define it more subjectively by defining “8 characteristics of good liars”. He concluded people could be better liars if they were (1) natural performers, (2) well prepared, (3) original, (4) rapid thinkers, (5) eloquent, (6) have a good memory, (7) do not experience guilt, fear, or delight, and (8) are good at acting (p. 378-379). Caso et al. (2006) found that deceivers find it more difficult to control their body than their rhetoric’s. Subsequently, Hartwig, Granhag, Trömwall, and Doering (2010) claim that the difference between a capable deceiver and an incapable deceiver might be related to the ability to control one’s own demeanour as well as verbal content. Yet, this still does not give an actual and clear distinction in people’s deceiving capabilities.
Thus, theory shows that people differ in body language when they deceive others and that there are considerable variances in this behaviour. Research has tried to define a clear distinction in the capability of deceivers but has not yet managed to do so.
The current study
8 round. This creates a truthful movement-baseline and a deceitful movement-baseline. These baselines are compared to study individual differences and afterwards are used to study the presence of better deceivers. The difference between Truthful behaviour and Deceitful behaviour should be negative according to the rigidity effect.
H1: People show less movement when trying to deceive their opponents than when they were not trying to deceive their opponents.
Research supports there being different kinds of liars and truth tellers (Buller et al., 1994; Caso, et al., 2006). People have a harder time to judge is some is lying compared to when someone is truthful. The closer people’s behaviours are to each other, the harder it is to tell if it is different. So it suggests that there is little variance when people are deceitful. Theory infers that people will try to move less to deceive others. Decreasing behaviour also would also suggest less variance.
H2: People have a higher individual difference (variance) in movement when they are truthful versus when they are deceitful.
Research has found evidence of transparent and less capable deceivers. Furthermore, from birth, someone’s liars' abilities are influenced by internal and external factors that support or counter the development of developing this skill. To determine if there are skilled and unskilled deceivers this study had to determine factors that would distinguish these deceivers from each other. Chen and Ankenman (2006) found that deception during poker increases winning chances. Therefore, to win a game of poker one should be a better deceiver than his or her opponents. That way opponents have fewer cues to detect the bluff. Based on these conclusions, this study infers that winners of a poker game are better deceivers then those who lost that game of poker. Comparing these groups might show if there is a difference within deceivers.
H3: The winners of the 60-minute poker games show less contrast in movement between being deceitful and truthful compared to those who lost in the poker games.
Furthermore, to compare better players to worse players another group is created. Since deception increases winning chances better deceivers should have deceived other opponents out of more money. So those who earned the most chips should show less contrast in their truthful and deceitful movement.
H4: The highest earners (top 25% of all participants) from a 60-minute poker game show less contrast in movement between being deceitful and truthful than the lowest earning players (bottom 25% of all the participants).
Method
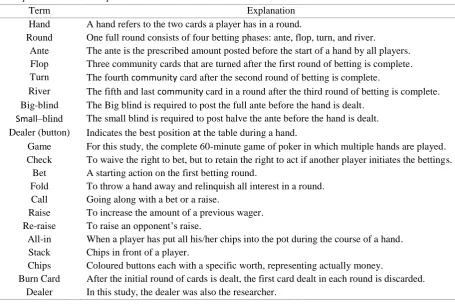
9 Table 1
Used poker terms and explanation
Term Explanation
Hand A hand refers to the two cards a player has in a round.
Round One full round consists of four betting phases: ante, flop, turn, and river.
Ante The ante is the prescribed amount posted before the start of a hand by all players. Flop Three community cards that are turned after the first round of betting is complete. Turn The fourth community card after the second round of betting is complete.
River The fifth and last community card in a round after the third round of betting is complete. Big-blind The Big blind is required to post the full ante before the hand is dealt.
Small–blind The small blind is required to post halve the ante before the hand is dealt.
Dealer (button) Indicates the best position at the table during a hand.
Game For this study, the complete 60-minute game of poker in which multiple hands are played. Check To waive the right to bet, but to retain the right to act if another player initiates the bettings.
Bet A starting action on the first betting round.
Fold To throw a hand away and relinquish all interest in a round. Call Going along with a bet or a raise.
Raise To increase the amount of a previous wager. Re-raise To raise an opponent’s raise.
All-in When a player has put all his/her chips into the pot during the course of a hand. Stack Chips in front of a player.
Chips Coloured buttons each with a specific worth, representing actually money.
Burn Card After the initial round of cards is dealt, the first card dealt in each round is discarded. Dealer In this study, the dealer was also the researcher.
Participants
A total of 58 participants voluntarily participated in the experiment and signed their informed consent to agree that their data would be used for analysis (Appendix 1) and no one objected after the debrief (Appendix 2). Participants were collected through the University of Twente's student participation program (SONA) and by the social network of the researchers. They were asked to perform in a study about betting behaviour. From these 58 participants, 5 participants were excluded, because they had pre-knowledge of the experiment. Participants were told that the best participant of the whole study would receive a €100,- reward and the second best would receive €50,- reward. In the end, 53 participants were used in the study where 45 were men (84.9%) and 8 were women (15.1%). Their age ranged between 18 and 59 years with a mean of 23 (SD = 5.91). Most participants originated from the Netherlands (53), 25 participants were German and two participants had other nationalities. The most frequently completed level of education was high school (56.6%), 32.1% received an HBO or WO diploma, and 11.3% received an MBO diploma. Participants averaged their poker skill to 2.5 on a scale from 1 being bad at poker to 5 being very well at poker.
Design
10 deceiving) was calculated together [Analysis]. This resulted in five ‘Truthful movement’ variables and five ‘Deceitful movement’ variables per participant. The dependent movement variables that could be compared for every participant to investigate the impact of the within independent variable Deception were: Head movement, Arms movement, Torso movement, Legs movement, and the Overall movement. The movement variables are dependent because the movement changes because of deception. For a better understanding of the differences in movement, the difference was calculated in percentages by (deceitful movement – truthful movement)/truthful movement * 100.
Variables used for the between-subjects part of this study were the group variables ‘Stack Ranking' and ‘Place’. Stack Ranking is an ordinal variable based on a boxplot from the variable ‘Stack Ending’ which participants answered on their questionnaire. This way the 25% best performing participants are grouped together and so are the second best, third best, and the 25% worst performing participants. The End Place is the ordinal variable of the final place a participant ended up. This could be the first place, second place, third place, or fourth place.
Game procedure
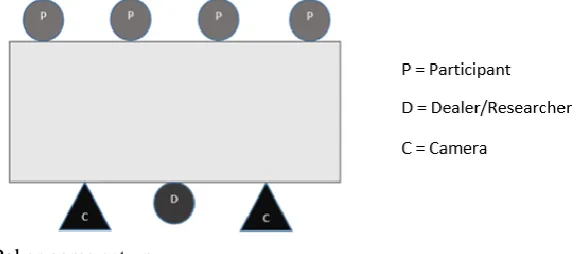
[image:11.595.119.408.419.546.2]A poker game only started with a minimum of 3 and a maximum of 4 participants. If there were 3 participants, the dealer dealt himself in. This way a participant always had 3 opponents. There was no game data recorded for the dealer, only for those that were participants in the study. Figure 1 shows the room set up for this study. At the dealers' seat, a bel was present. When playing, the dealer hit the bell every time to mark a new phase. E.g. the participants have their cards; the round of betting has passed; the dealer burns a card; hits the bell, and lays down three cards face up (flop). The purpose of the bell is for creating smaller clips from the whole recordings and has no other purpose. The participants were made aware of this function at the beginning of the game.
Figure 1. Pokergame set up.
11 there were any ambiguities for the participants an official rule book was at their disposal to consult during the game.
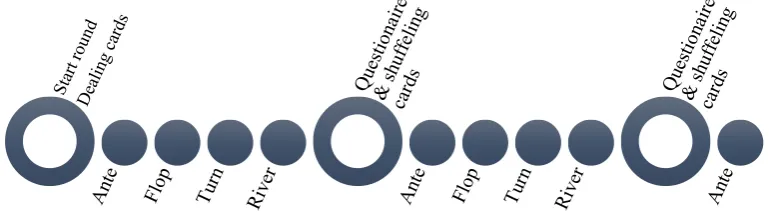
Figure 2. Poker round sequence and when participants were able to fill in their questionnaire.
The second step was performing a 60-minute poker game. After the mock round, the timer for 60 minutes started. Between phases, the dealer hits the bell for the recording. The participants were free to bet as they like and use their own strategy. After every round, they had to fill in the questionnaire. The time was not made known to the participants to prevent an "all in last round". If the 60 minutes were up during a round, then that round was finished. After 60 minutes the participants were asked to count their stack and were presented a second questionnaire to fill in, afterwards they were free to leave.
Clip selection
The clip selection for the 6 clips from each participant was done after the game based on participants own subjective judgements. After every round of poker, while the cards were reshuffled and divided, the participants filled in a short questionnaire about the previous round (Appendix 3). Within the questionnaire, the participants could declare if they were deceiving or not and to what level they were deceiving. They indicated this for every phase of the round. The clip selection started for each participant from the latest round they played to the first. This choice was made because at the end of the game the participants are more engaged compared to the beginning and they had a better understanding of the game. For the selection, the first part of the game, the ante, in the questionnaire it is called ‘before the flop', is looked at last. This choice was made because during this part of the game the most movement was for looking at the cards and rearranging the big and small blind buttons. If this part of the game was used, the clip selection started for the participant at the point he/she looked at the cards for the first time and put the cards back on the table. For each participant, three clips were selected in which they declared not to be deceiving but still participating in the round. Not every participant tried to deceive as much as the other or to the highest degree they were able to rate themselves. If from the end to the beginning no three of the highest deceiving declarations ‘yes – a great amount' were answered, then the deceiving declaration below was selected, ‘yes – a lot’, and so forth.
By opening the sound graphics, clips were easily made by watching the spikes in sound caused by the bell. Then the clips were coded by which mount the camera was, left or right, which overall poker game it was, which hand of poker, and which part of the game (ante (1), flop (2), turn (3), river (4)). These coded clips were then handed over to the BMS Lab (technology lab that supervised the OpenPose system and processed the clips). This created body coordinates which were returned to the researchers in excel files for analysis.
Measures
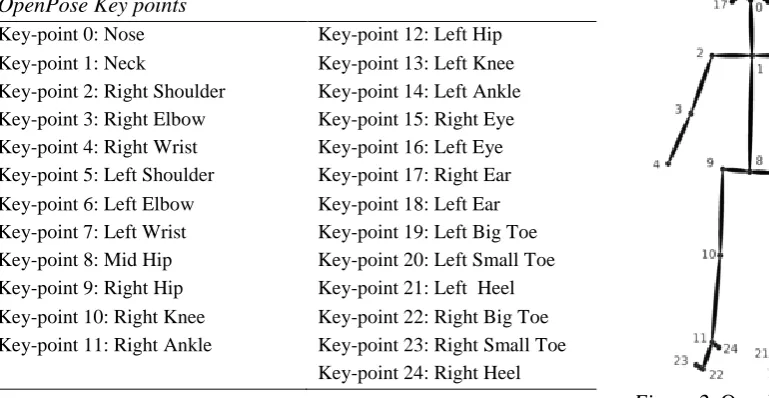
12 can register 130 key points. The system is able to detect different people in images (Flintbox, 2017). For this research, the system tracked the body movement after it was recorded. This choice was made to be able to fix tracking mistakes and to track down any possible inexplicable data. The use of technology to compute data instead of multiple researchers results in more objective data in less time. The short coded clips, as made described in the clip selection, were first recorded on a JVC camera. The JVC camera recorded in HD; format: Quicktime; resolution: 1920x1080; framerate: 50i; bit rate: 50m (xhg) .The OpenPose system measures frame by frame and then tracks the body movement. Before clips were able to run through OpenPose they were edited. With the program VideoPad, clips were created and stored as a .avi file with a 38 frame per second. Therefore, OpenPose calculated per second 38 frames and create the coordinates per key points. For this study, 25 key points were used as shown in table 2 below and more visual in figure 2.
Table 2
OpenPose Key points
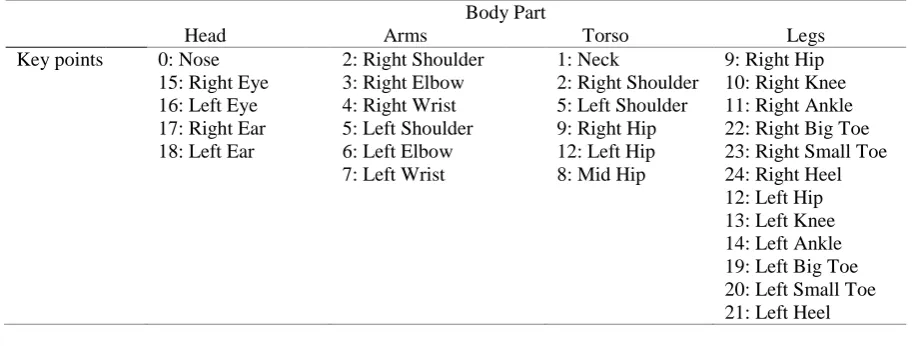
Key-point 0: Nose Key-point 12: Left Hip Key-point 1: Neck Key-point 13: Left Knee Key-point 2: Right Shoulder Key-point 14: Left Ankle Key-point 3: Right Elbow Key-point 15: Right Eye Key-point 4: Right Wrist Key-point 16: Left Eye Key-point 5: Left Shoulder Key-point 17: Right Ear Key-point 6: Left Elbow Key-point 18: Left Ear Key-point 7: Left Wrist Key-point 19: Left Big Toe Key-point 8: Mid Hip Key-point 20: Left Small Toe Key-point 9: Right Hip Key-point 21: Left Heel Key-point 10: Right Knee Key-point 22: Right Big Toe Key-point 11: Right Ankle Key-point 23: Right Small Toe
Key-point 24: Right Heel
Figure 2. OpenPose skeleton.
The output of OpenPose is the same clip with the skeleton laid over and a .json file per frame. To be able to work with the data the .json files were comprised into an excel file per clip. Each x coordinate, y coordinate, and the confidence per key point were put in a separate column. So, each key point had three columns and each row represented a frame from the clip.
Data analysis
Multiple steps had to be taken with the raw OpenPose data to create the movement variables for the participants. Step one was calculating the mean absolute difference between the frames for each key point and the average confidence of that key point was calculated. This resulted in two numbers that render the average movement a participant showed in that clip on the x axle and the y axle and a number that renders the validity of that movement. To create one number that represents the movement of one key point the average of x and y was calculated. This left only two numbers per key point; the validity of that key point and the average movement from that key point. This was done for all 6 clips per participant, 318 clips in total.
13 Step three was averaging the same key points together for the two different contexts. One participant had a total of 6 data files on which the movement was calculated. Three data files for Deceitful movement and three data files for Truthful movement. The same key point from three clips in which a participant claimed to deceive his/her opponents was averaged together. This resulted in an average movement for that key point in which one participant indicated to be deceitful. The same was done for the clips in which the participant claimed to be truthful. This resulted in the calculated movement of a key point when the participant was deceitful and the movement of that key point when that participant was truthful. This was also done with the confidence of three key points to indicate the validity of the calculated movement. Because of the scrutinizing in step two, some averaged key points were based on one or two clips. In some cases, no values were retained after scrutinizing. However, this did not restrict any further calculations.
[image:14.595.68.528.362.535.2]Step four was calculating the average movement for the body parts. The according key points were averaged together resulting in the average movement of that body part. The same was done for the confidence to calculate the validity of the body part. Table 3 shows which key points were used to calculate the movement of a body part. Table 2 is also a representation of the key points used for the variable Overall movement. This resulted in the 5 Truthful variables and the 5 Deceitful variables per participant.
Table 3
Key point distribution to calculate the movement per body part
Body Part
Head Arms Torso Legs
Key points 0: Nose 15: Right Eye 16: Left Eye 17: Right Ear 18: Left Ear
2: Right Shoulder 3: Right Elbow 4: Right Wrist 5: Left Shoulder 6: Left Elbow 7: Left Wrist
1: Neck
2: Right Shoulder 5: Left Shoulder 9: Right Hip 12: Left Hip 8: Mid Hip
9: Right Hip 10: Right Knee 11: Right Ankle 22: Right Big Toe 23: Right Small Toe 24: Right Heel 12: Left Hip 13: Left Knee 14: Left Ankle 19: Left Big Toe 20: Left Small Toe 21: Left Heel
Results
14 Table 4
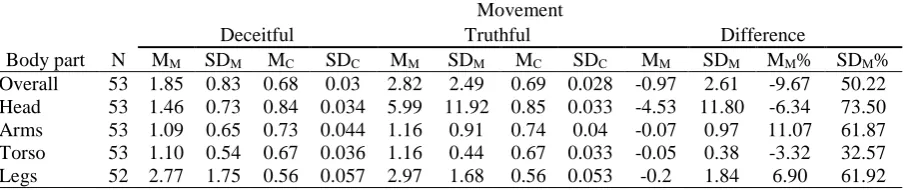
Average Deceitful, Truthful, and Difference in Movement (MM), Standard Deviations of movement (SDM), and OpenPose mean calculated confidences per variable (MC) and Standard Deviations of the confidences (SDC) during the poker games.
Movement
Deceitful Truthful Difference
Body part N MM SDM MC SDC MM SDM MC SDC MM SDM MM% SDM%
[image:15.595.75.529.131.226.2]Overall 53 1.85 0.83 0.68 0.03 2.82 2.49 0.69 0.028 -0.97 2.61 -9.67 50.22 Head 53 1.46 0.73 0.84 0.034 5.99 11.92 0.85 0.033 -4.53 11.80 -6.34 73.50 Arms 53 1.09 0.65 0.73 0.044 1.16 0.91 0.74 0.04 -0.07 0.97 11.07 61.87 Torso 53 1.10 0.54 0.67 0.036 1.16 0.44 0.67 0.033 -0.05 0.38 -3.32 32.57 Legs 52 2.77 1.75 0.56 0.057 2.97 1.68 0.56 0.053 -0.2 1.84 6.90 61.92
Table 5 is an overview of the correlations between the calculated variables, the demographic variable Age, the group variables Stack ranking and Place, and the variables Skill level (subjective indication of the participants on how good of a poker player they are) and Stack Ending (the chip worth they were left with after 60 minutes). A Shapiro-Wilk normality test showed that the measured variables are not normally distributed, except for Truthful Torso movement and Difference Legs movement. Therefore, non-parametric tests were used to calculate the correlations between the Truthful variables and the Deceitful variables. The non-parametric test to calculate correlations is the Spearman Correlation Coefficient.
Table 5
Means (M), Standard Deviations (SD), and Correlations between the variables.
Va riable s M ea n SD Age S tac k E nding P lac e S kil l L eve l S tac k R anking De ce it ful He ad moveme nt De ce it ful Ar m s moveme nt De ce it ful T or so moveme nt De ce it ful L egs moveme nt Ove ra ll De ce it ful moveme nt T ruthf ul He ad moveme nt T ruthf ul Ar m s moveme nt T ruthf ul T o rs o moveme nt T ruthf ul L egs moveme nt Ove ra ll T ruth ful moveme nt Dif fe re nc e He ad moveme nt Dif fe re nc e Ar m s moveme nt Dif fe re nc e T o rs o moveme nt Dif fe re nc e L egs moveme nt Ove ra ll dif fe re nc e moveme nt % Dif fe re nc e He ad moveme nt % Dif fe re nc e Ar m s moveme nt % Dif fe re nc e T or so moveme nt % Dif fe re nc e L egs moveme nt % Ove ra ll Dif fe re nc e moveme nt
1 2 3 4 5 6 7 8 9 10 11 12 13 14 15 16 17 18 19 20 21 22 23 24 25 1 23.23 5.91
2 1552. 69
1223. 43 .10 3 2.51 1.10 -.18 -.90**
4 2.49 0.99 .15 .16 -.24 5 2.51 1.12 -.04 -.97** .88** -.15
6 1.46 0.73 -.05 -.04 .14 -.03 .08 7 1.09 0.65 -.08 -.21 .098 -.15 .23 .24 8 1.10 0.54 -.17 -.01 -.02 -.16 .02 .10 .42**
9 2.77 1.75 -.30* -.04 .10 -.13 .03 .08 .27 .70**
10 1.85 0.83 -.25 -.08 .13 -.16 .08 .33* .46** .73** .90**
11 5.99 11.92 .12 -.09 -.06 .09 .10 .33* -.04 .01 .02 .06
12 1.16 0.91 -.05 -.04 .04 -.25 -.00 .08 .56** .02 -.13 .04 -.09
13 1.16 0.44 -.03 -.29* .16 -.16 .33* -.13 .38** .71** .53** .51** .02 -.04
14 2.97 1.70 -.12 -.26 .15 -.21 .26 -.12 .13 .42** .45** .35* .06 -.15 .48**
15 2.82 2.49 -.10 -.25 .13 -.23 .26 .14 .07 .13 .27 .28* .70** .01 .13 .52**
16 -4.53 11.80 -.15 .02 .14 -.09 -.03 .26 .22 .12 .03 .14 -.76** .18 .02 -.08 -.63**
17 -0.07 0.97 -.13 -.03 -.05 -.03 .07 .21 .53** .50** .46** .52** -.04 -.28* .43** .31* -.01 .16
18 -0.05 0.38 -.19 .35* -.24 -.07 -.37** .26 .21 .52** .29* .35* -.01 .16 -.12 -.12 -.04 .11 .19
19 -0.20 1.84 -.07 .23 -.11 .10 -.24 .17 .14 .19 .46** .51** .03 .08 .05 -.49** -.17 .05 .05 .30*
20 -0.97 2.61 -.08 .07 .04 .01 -.09 .04 .34* .40** .39** .45** -.65** .11 .29* -.12 -.66** .71** .36** .23 .49**
21 -6.34 73.50 -.12 .03 .13 -.09 -.03 .29* .22 .09 -.01 .11 -.74** .19 -.01 -.10 -.63** .99** .15 .13 .03 .68**
22 11.07 61.87 -.15 -.09 .01 -.02 .13 .20 .51** .50** .51** .57** -.05 -.32* .44** .37** .03 .16 .97** .16 .06 .36** .15
23 -3.32 32.57 -.18 .29* -.19 -.12 -.33* .25 .27 .58** .36** .41** -.02 .12 -.08 -.05 -.02 .12 .25 .98** .30* .27 .13 .23
24 6.90 61.92 -.10 .17 -.05 .07 -.19 .23 .18 .28* .53** .58** .05 .03 .10 -.45** -.14 .05 .13 .37** .97** .48** .04 .14 .38**
15 N = 53; except for the body part legs N = 52
**. Correlation is significant at the .01 level (2-tailed).
*. Correlation is significant at the .05 level (2-tailed).
Rigidity Effect
Before performing a repeated measures MANOVA the dataset has to meet five assumptions to perform a valid repeated measures MANOVA. The first two assumptions are met. The dependent variables are continuous (first assumption) and are measured from the same participant with the same tool (second assumption). The third assumption for performing a repeated measures MANOVA, no significant outliers, has not been met. Leaving outliers creates harder conditions to reject the null hypothesis. It does make it less likely to make a type 1 error (false positive). The fourth assumption, approximately normally distributed, is also not met. However, a repeated measures MANOVA is quite robust to violations and therefore still performed. The fifth and last assumption, sphericity, does not apply because, there are only two levels of the within-subject factor (Grande, 2017). Because this study investigates the individuality between subjects and there are barely other possibilities to test this, the repeated measures MANOVA is still performed while not all assumptions are met.
The repeated measures MANOVA was conducted to compare the effect of the ‘Rigidity effect’ on the movement of five dependent body parts. Because the rigidity effect influences the movement, the rigidity effect is the independent variable and the movements are the dependent variables. The ten movement variables were entered simultaneously into the test and renamed into the five following dependent measures:
Head: Deceitful Head movement vs. Truthful Head movement; Torso: Deceitful Torso movement vs. Truthful Torso movement; Arms: Deceitful Arms movement vs. Truthful Arms movement; Legs: Deceitful Legs movement vs. Truthful Legs movement; and Overall: Overall Deceitful movement vs. Overall Truthful movement.
The multivariate test of the repeated measures MANOVA, table 6, showed to be marginally significant for ‘Rigidity effect’, Wilks’ Lambda = .823, F (5, 47)= 2.022, p = .093). This means that the averages in this test are marginally significantly different from each other. Because these statistics are based on multiple calculations and because some assumptions are violated making it less likely to reject the null hypothesis, this study still investigates the individual outcomes of the univariate tests to see if there are significant differences for the individual measures.
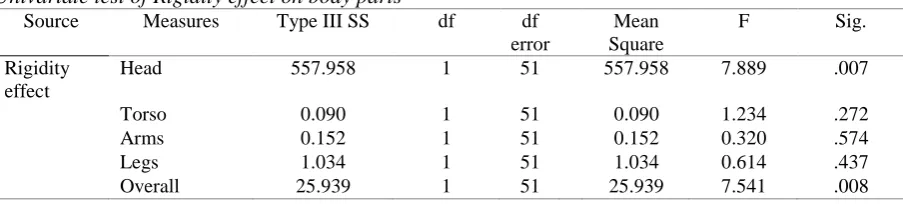
16 Table 6
Univariate test of Rigidity effect on body parts
Source Measures Type III SS df df error
Mean Square
F Sig.
Rigidity effect
Head 557.958 1 51 557.958 7.889 .007
Torso 0.090 1 51 0.090 1.234 .272
Arms 0.152 1 51 0.152 0.320 .574
Legs 1.034 1 51 1.034 0.614 .437
Overall 25.939 1 51 25.939 7.541 .008
To compensate for the rejection of some assumptions the non-parametric variant of the repeated measures MANOVA, the Friedman test, is also performed. The Friedman tests on movement showed there was a statistically significant effect on head movement for the participants, X2 = 4.245, p = .039. Therefore the null hypothesis is still rejected and concluded that there is a statistical difference between Truthful Head movement (Mdn = 1.72, SD = 11.92) versus Deceitful Head movement (Mdn = 1.28, SD = .73). When participants bluffed (Deceitful) they significantly moved their Head less than when they were not bluffing (Truthful). No other significant effect was found of the Rigidity effect on movement from the participants with the Friedman test. Torso (X2= 1.528, p = .216), Arms (X2 = .170, p = .680), Legs (X2 = .077, p = .782), Overall (X2 = 1.528, p = .216). Therefore, Hypothesis 1 is still partly accepted.
Individual Differences
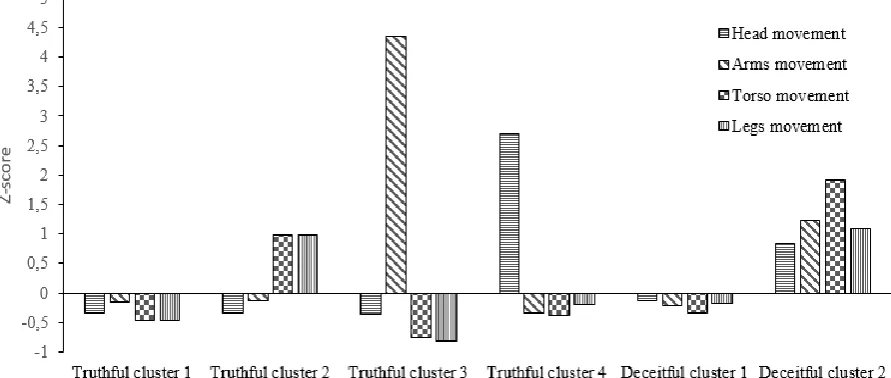
Individuality is the presence of the possibility to discriminate someone on more discernible characteristics. More clusters would mean that there are more possible variations to which a participant can belong within that category. A k-means cluster analysis was performed on the z-scores of the Truthful movement and Deceitful movement variables, with the exception of the Overall movement. A z-score is a standardized score that indicates how many standard deviations the score is from average. A negative Z score means below average, and a positive z score means above average. The Overall movement variable was excluded because it consists of the same key points as the other body parts. The ‘k’ of k-means signifies that the researcher selects how many groups the analysis has to calculate. Clusters are made by selecting at least two points randomly in a data scatterplot called centroids. From these centroids, the closest data points are linked to this centroid. The average of all these data points become a new centroid. From this new centroid, the closest data points are again selected and the closest data points are averaged and become the new centroid. This process is repeated until the centroids stop shifting. The cluster analysis was performed exploratively since there was no research suggesting how many clusters there would be to be expected. A k-means cluster analysis comes with an ANOVA table which will show if there is a significant difference between the input variables. Clarifying, if the ANOVA for a variable was significant, it means that there is a significant impact of that variable on cluster membership. The k-means cluster analysis was performed until every variable had a significant p-value because every body part will have a predictive indication to which cluster someone belongs.
17 Deceitful clusters. The cluster analysis of Deceitful movement variables showed 2 clusters in which every body part is significant and thus a predictor (Arms movement, F (1, 50) = 15.95, p < .001; Torso movement, F (1, 50) = 79.63, p < .001; Head movement, F (1, 50) = 5.91, p = .019; Legs movement, F (1, 50) = 11.63, p = .001). Deceitful Cluster 1 has 45 participants in which participants move all body parts below average. Deceitful Cluster 2 has 7 participants who move all body parts above average. The last two categories of Figure 3 is a visual representation of these cluster movements. Table 7 is a representation of the Z-scores from figure 3 for both Truthful clusters and Deceitful clusters.
[image:18.595.69.526.452.550.2]Figure 3. Visual representation of the Z-score differences between the four Truthful clusters and the two Deceitful clusters.
Table 7
The group sizes (N) and Z-scores for the Truthful and Deceitful movement clusters
N Head movement Arms movement Torso movement Legs movement Truthful cluster 1 28 -0,34573 -0,16278 -0,45386 -0,46616 Truthful cluster 2 16 -0,33202 -0,12577 0,97401 0,98697 Truthful cluster 3 2 -0,36831 4,35097 -0,75623 -0,80836 Truthful cluster 4 6 2,69555 -0,34556 -0,38484 -0,18706 Deceitful cluster 1 45 -0,12652 -0,20828 -0,33006 -0,16965 Deceitful cluster 2 7 0,82867 1,2231 1,92167 1,09058
This cluster analysis shows that there is more difference in truthful behaviour considering there are 4 clusters in truthful action and 2 clusters in deceitful action. Therefore, Hypothesis 2 is accepted. People show more individuality when they were truthful versus when they are deceiving.
18 Table 8
Overview of the Cross-Cluster analysis and how much participants (N) belong to a cluster combination.
Deceiving Capabilities
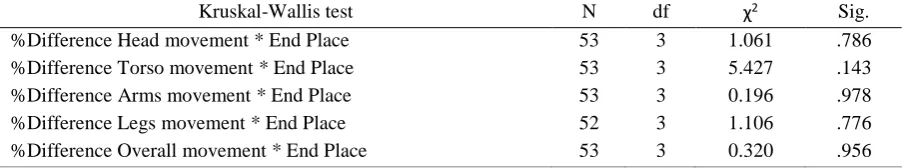
A Kruskal-Wallis test was conducted to investigate if there was a difference in movement contrast (the contrast between the truthful movement and deceitful movement) made by participants that had performed better in the poker game versus those who performed worse. The dependent continuous variables, who all were non-normally distributed, %Difference Head movement, %Difference Torso movement, %Difference Arms movement, %Difference Legs movement, %Difference Overall movement. The independent variables were the place the participants ended up (End Place) to investigate if there was a difference between participants who ended first, second, third, or last, and the ranking based on the stack size the participants had at the end of the game (Stack Ranking) to investigate if there was a difference in the movement contrast made by those with the biggest stack, second biggest stack, second lowest stack, or with the lowest stack.
The Kruskal-Wallis test of the %Difference in body part movement * End Place, table 9, showed no significant differences between the contrast in movement and the different places participants ended up. Head (χ2 (3) = 1.061, p = .786), Torso (χ2 (3) = 5.427, p = .143), Arms (F = 2.848, p = .098), Legs (F
= 2.835, p = .099), Overall (F = .727, p = .398). Therefore, Hypothesis 3 is rejected, since no significant difference has been found. This study did not provide evidence that participants differed in movement based on the place they ended within the poker game.
Table 9
Kruskal-Wallis test of %Difference body parts movement * End Place
Kruskal-Wallis test N df χ2 Sig.
%Difference Head movement * End Place 53 3 1.061 .786 %Difference Torso movement * End Place 53 3 5.427 .143 %Difference Arms movement * End Place 53 3 0.196 .978 %Difference Legs movement * End Place 52 3 1.106 .776 %Difference Overall movement * End Place 53 3 0.320 .956
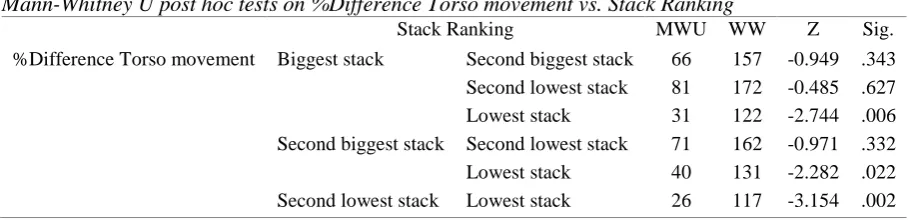
Subsequently, The Kruskal-Wallis test of the %Difference in body part movement * Stack Ranking, table 10, showed there was a statistically significant effect on the %Difference Torso movement over the different Stack rankings, χ2(3) = 1.061, p = .006. Therefore, the null hypotheses is
rejected and concluded that participants moved their Torso significantly different from each other based on how big their stack was. The other four body parts were not significantly different over the different rankings, Head (χ2 (3) = 0.261, p = .957), Arms (χ2 (3) = 1.293, p = .731), Legs, (χ2 (3) = 2.609, p =
.456), and Overall (χ2 (3) = 1.580, p = .664). To determine which group rankings differ from each other
a posthoc test has to be performed.
Cluster
Clusters N Truthful Deceitful
Cluster Combination 1 26 1 1
Cluster Combination 2 2 1 2
Cluster Combination 3 11 2 1
Cluster Combination 4 5 2 2
Cluster Combination 5 2 3 1
[image:19.595.71.526.502.586.2]19 Table 10
Kruskal-Wallis test of %Difference body parts movement * Stack Ranking
Kruskal-Wallis test N df χ2 Sig.
%Difference Head movement * Stack Ranking 53 3 0.261 .957 %Difference Torso movement * Stack Ranking 53 3 12.524 .006 %Difference Arms movement * Stack Ranking 53 3 1.293 .731 %Difference Legs movement * Stack Ranking 52 3 2.609 .456 %Difference Overall movement * Stack Ranking 53 3 1.580 .664
Mann-Whitney U tests were performed on the calculated differences in percentages as a post hoc test to determine which Stack groups differ from each other on %Difference Torso movement. The Mann-Whitney U tests, table 11, showed a significant difference in %Difference Torso movement on three occasions.
First, the test was significant between the participants with the Biggest Stack and the Lowest stack at p = .006 (Z = -2.744). Therefore the null hypothesis is rejected and concluded that there is a significant difference between the highest earners and the lowest earners. Based on the negative Z-score, participants who had the Biggest stack had significantly less contrast in their Truthful-Deceitful movement in comparison with those who had the Lowest stack.
Second, the test was significant between the Second biggest stack and the Lowest stack at p = .022 (Z = -2.282). Therefore the null hypothesis is rejected and concluded that there is a significant difference between the Second highest earners and the Lowest earners. Based on the negative Z-score, participants who had the Second biggest stack had significantly less contrast in their Truthful-Deceitful movement in comparison with those who had the Lowest stack.
Third and last, it showed a significant difference in %Difference Torso movement between the participants with the Second Lowest Stack and the Lowest Stack was at p = .002 (Z = -3.154). Therefore the null hypothesis is rejected and there can be concluded that there is a significant difference between the Second lowest earners and the Lowest earners. Based on the negative Z-score, participants who had the Second lowest stack had significantly less contrast in their Truthful-Deceitful movement in comparison with those who had the Lowest stack.
There was no significant difference between other groups nor on any groups with the other independent variable % Difference in body part movement. Therefore Hypothesis 4 is partially accepted. There is evidence that participants who performed better in the poker games had less contrast in their Truthful-Deceitful movements than those who performed worse.
Table 11
Mann-Whitney U post hoc tests on %Difference Torso movement vs. Stack Ranking
Stack Ranking MWU WW Z Sig. %Difference Torso movement Biggest stack Second biggest stack 66 157 -0.949 .343 Second lowest stack 81 172 -0.485 .627 Lowest stack 31 122 -2.744 .006 Second biggest stack Second lowest stack 71 162 -0.971 .332 Lowest stack 40 131 -2.282 .022 Second lowest stack Lowest stack 26 117 -3.154 .002
Exploratory research
[image:20.595.70.525.574.684.2]20 significant statistical difference between the highest rank and the lowest rank is the difference in %Difference Torso movement (Z = -2.774, p =.006). Participants in the Biggest stack differed on average 5.8% in their Torso movement. This means that from their total Truthful movement their Deceitful movement is 5.8% more. Participants for the lowest stack differed on average -27.45% in their Torso movement. This means that the worst performing poker players moved 27.45% less in their Deceitful movement versus their Truthful movement. Therefore a detector has 5.8% different movement to detect in the better performing group versus 27.45% difference in movement to detect in the worst performing group. Therefore detectors have 21.65 % more contrast to detect in the Torso movement of participants with the lowest stack versus those with the biggest stack.
To explore the effect of deceit on movement further, the participants with the biggest stack differed on Head, Arm, Torso, and Legs on average 8.81% from their truthful behaviour. The participants from the Lowest Stack differed on Head, Arm, Torso, and Legs on average 22.43% from their truthful behaviour. The means of the %Difference variables from the Biggest Stack and the means from the Lowest Stack are compared (Figure 4 and Table 12). This study measured a difference in Truthful-Deceitful movement between the best and worst performers of 15.61%. This means that deception detectors have 15.61% more contrast in movement on which they can judge someone to be deceitful.
Table 12
The main effect of deceiving on movement per performance
Stack Rank
N %Difference Head
%Difference Arms
%Difference Torso
%Difference Legs
Average %Difference Biggest
stack 13 Mean 1.59 7.88 5.83 14.16 8.81
Lowest
stack 13 Mean -13.41 34.87 -27.45 -17.01 22.43 Total Mean
[image:21.595.74.526.360.719.2]Difference 11.82 26.99 21.62 2.85 15.61
21
Discussion
This study investigated if people vary in their movement when they were trying to deceive others versus when they were truthful to others and the existence if some are more capable in deceiving compared to others. The results showed promising contrasts in participants movement when they were deceiving others versus when they were truthfully participating and that some participants were more capable deceivers compared to others. In the following paragraphs, the results from the hypotheses are elaborated and reflected upon. After the in-depth view of the results, the limitations of the study are presented and some recommendations are made for future research.
Rigidity Effect
The partly accepted first hypothesis, people show less movement when they try to deceive their opponents versus when they are not trying to deceive their opponents, is in line with prior rigidity research. There was a significant decline in the head movement and the overall movement measured when participants were bluffing compared to their not bluffing movement during a game of Texas Hold’em poker. Because the data set was not entirely compliant with the test assumptions, the non-parametric test was also performed. The non-non-parametric test only showed a decline in the head movement when participants were bluffing compared to their not bluffing movement, however, there was no significant decline in Overall movement when participants were bluffing.
But, there are logical reasons to why a difference is found between test results and why no significant data was found in the movement of the Legs, Arms, and the Torso. First, a possible reason for the difference in the test results is that the Friedman test is less affected by outliers than the repeated measures MANOVA. The Friedman uses the median, while an ANOVA uses the mean. However, the outliers in this research are defendable because the data is based on three separate observations. This makes the outliers less likely to be a measuring mistake or an anomaly. The repeated measures MANOVA is a more advanced test because all effects on the body parts were calculated at the same time and affected the outcome of the separate variables. The Friedman test is only capable to calculate the effect in one body part at the time.
Second, a possible reason for the absence of statistical significance for the legs is that OpenPose was the least reliable for this body part. For one participant no usable data was collected and while scrutinizing the data in the analysis the most key points had to be removed. This could explain why this study did not find a rigidity effect on the legs.
Third, a possible reason for the absence of significant data for the Arms can be the limitation of free will by the design. During the poker game, the participants had to check, bet or raise. These actions are the same for the truthful observations as for the deceitful observation. This could explain why no difference is found in the arms. Fourth and last, in a chair, the torso is the most fixed body part of a person. The least amount of movement is expected here. More participants might have made the small difference significant if a difference would be possible to be found at all.
22 possible cues a lie detector should and could expect. Therefore, the decline in movement of the head could be explained by the fact that the people do not want to show their face to the person they are deceiving which would be a possible conclusion for both studies.
Individual Differences
The accepted second hypothesis, people have a higher individual difference in movement when being truthful versus when being deceitful, is also substantiated by prior research (Hartwig, et al., 2010). The cluster analysis showed there were four possible groups in the truthful movement data for which all body parts had a significant contribution to the allocation of a participant to a cluster and there were only two possible groups in the deceitful movement data for which all body parts were a significant contributor. This substantiates that there is less individual difference in movement when people deceive. The truthful observation has more group discriminations, more different patterns. In other words, people are less the same when they are truthful.
Subsequently, this conclusion is in accordance with the acceptance of hypothesis 1, there is less movement when people deceive which results in less variance between each other. The rigidity effect results in people moving less, which shrinks the variance in which they move. It converges the movement. However, these results do not substantiate or disprove that the rigidity effect is applicable to everyone.
Finally, there seems to be some evidence of possible predictive behaviour. This predictive behaviour makes these participants presumably also transparent liars. Participants who moved their heads a lot (6 participants) or their arms a lot (2 participants) while being truthful, all ended up in the deceiving cluster where they moved all body parts below average. This indicates that if someone's taxonomy can be identified in truthful behaviour, the deceitful behaviour could be predicted. This will make them transparent liars and easy to detect. Nevertheless, this is different from the findings of Bond and DePaulo (2006) and Levine (2016) because those studies did not involve truthful behaviour and how this behaviour is associated with deceitful behaviour. These results only involve a few participants and further analysis with the data, e.g. the relation between clusters and performance, showed to be insignificant. Yet, these results are an addition to taxonomies of people and how there are differences that influence certain behaviours (Buller, et al., 1994; Caso, et al., 2006; Masip, et al., 2006).
Deceiving capabilities
The deceiving capabilities of the participants were tested with the performance of the participants in the poker game supported by the findings of Chen and Ankenman (2006) and Vrij, Semin, and Bull (1996) that deception is necessary to increase winning chances. Therefore better players would have deceived better, which increased their winning chances. Hypotheses 3 and 4 investigated the possible capability differences of the participants.
Hypothesis 3 investigated the difference in capability by ranking the participants based on their position, first, second, third, or last. This resulted in insignificant data. In other words, no differences were detected in the participants' deceiving capabilities to deceive in this study based on the position the participants ended on in the poker game.
23 evidence to the detector. Noticeable for Torso movement is that the overall means for this body part are not that different, and the standard deviation is the smallest. Meaning that the data for this body part is quite dense, yet a significant result is found throughout the stack ranks.
The absence of significant results for hypotheses 3 while finding significant results for hypotheses 4 can be explained by the random grouping of participants. Some groups might have been more challenging than others resulting in easier wins or more gradual earning. Therefore the stack size has a theoretical better link to deceiving performance compared to the end position. To gain a big stack, the participants had to deceive their opponents out of more chips. Even if there would be a clear difference in poker skill, this would make the opponents more alert to that player, making deceit even harder to successfully perform.
The absence of other significant results for hypotheses 4 is possibly explained by the same reasons for the absence of the significant rigidity effect. The arms continuously have to perform the same actions, the legs are the least reliable measured, and the difference in head movement is not large enough for a statistical difference with groups of N 13. On another note, an insignificant finding might also be the cause of large variances, which are found on these body parts.
Data exploring. The exploration of the data showed a more understandable difference in the Truthful-Deceitful movement. The focus is on the difference in movement and not if this difference is negative or positive. A larger difference is easier for a detector to detect, regardless if it is negative or positive. The only significant finding between capable and less capable deceivers is on the torso movement. Lesser capable deceivers move 21.65% more with their torso compared to those who were better in the poker game. This is in line with the theory found. However, no other study has measured this difference before. Some liars are easier to detect than others because they have a larger difference in movement from their truthful movement.
As a further exploration, this study compared the differences of all body parts between the best and worst performers in the poker game. In this comparison, lesser capable deceivers move 15.61% more with their body parts. However, this is not supported by significant differences. The data suggest that more capable deceivers differ between the 0 and 15% while the less capable deceivers differ about 15 to 30%. This should be substantiated by subsequent research.
Finally, Two things are noticeable from this data. First, the participants in the Biggest Stack group moved on average a little more whereas the Lowest group moved less, except for their arms which they moved more. This could indicate differences in coping strategies, presence of tells, usage of soothers, or other behaviour control. Second, the better performing group is most noticeable to be lying in the movement of their legs, while the lower performing group is most noticeable by the difference in the movement of their arms. Since the arms are more in the eyesight of the detector and the legs are often covered by a table. This could explain why participants performed better or worse, but more research has to be performed in order to substantiate this.
Limitations
Even though the results of this study are generally in line with previous studies, there were a few limitations that influenced the outcome of this study.