warwick.ac.uk/lib-publications
Original citation:
Kamaris, Geordios, Skalomenos, Konstantinos A., Hatzigeorgiou, George D. and Beskos, Dimitri E.. (2016) Seismic damage estimation of in-plane regular steel/concrete
composite moment resisting frames. Engineering Structures, 115 . pp. 67-77.
Permanent WRAP URL:
http://wrap.warwick.ac.uk/77613
Copyright and reuse:
The Warwick Research Archive Portal (WRAP) makes this work by researchers of the University of Warwick available open access under the following conditions. Copyright © and all moral rights to the version of the paper presented here belong to the individual author(s) and/or other copyright owners. To the extent reasonable and practicable the material made available in WRAP has been checked for eligibility before being made available.
Copies of full items can be used for personal research or study, educational, or not-for-profit purposes without prior permission or charge. Provided that the authors, title and full bibliographic details are credited, a hyperlink and/or URL is given for the original metadata page and the content is not changed in any way.
Publisher’s statement:
© 2016, Elsevier. Licensed under the Creative Commons Attribution-NonCommercial-NoDerivatives 4.0 International http://creativecommons.org/licenses/by-nc-nd/4.0/
A note on versions:
The version presented here may differ from the published version or, version of record, if you wish to cite this item you are advised to consult the publisher’s version. Please see the ‘permanent WRAP URL’ above for details on accessing the published version and note that access may require a subscription.
Seismic damage estimation of in-plane regular steel/concrete
composite moment resisting frames
George S. Kamaris1, Konstantinos A. Skalomenos2, George D. Hatzigeorgiou3, and Dimitri E. Beskos4,5
1 School of Engineering, University of Warwick, Coventry CV4 7AL, United Kingdom
2 Disaster Prevention Research Institute (DPRI), Kyoto University, Gokasho, Uji, Kyoto 611-0011, Japan
3 School of Science and Technology, Hellenic Open University, GR-26335 Patras, Greece
4 Department of Civil Engineering, University of Patras, GR-26500 Patras, Greece
5 Office of Theoretical and Applied Mechanics, Academy of Athens, 4 Soranou Efessiou, GR-11527 Athens, Greece.
Abstract: Simple empirical expressions to estimate maximum seismic damage on the basis of four
well known damage indices for planar regular steel/concrete composite moment resisting frames
having steel I beams and concrete filled steel tube (CFT) columns are presented. These expressions
are based on the results of an extensive parametric study concerning the inelastic response of a large
number of frames to a large number of ordinary far-field type ground motions. Thousands of
nonlinear dynamic analyses are performed by scaling the seismic records to different intensities in
order to drive the structures to different levels of inelastic deformation. The statistical analysis of
the created response databank indicates that the number of stories, beam strength ratio, material
strength and ground motion characteristics strongly influence structural damage. Nonlinear
regression analysis is employed in order to derive simple formulae, which reflect the influence of
the aforementioned parameters and offer a direct estimation of the damage indices used in this
study. More specifically, given the characteristics of the structure and the ground motion, one can
calculate the maximum damage observed in column bases and beams. Finally, three examples serve
to illustrate the use of the proposed expressions and demonstrate their accuracy and efficiency.
Keywords: Steel/concrete composite frames; Moment resisting frames; Damage indices; Seismic
1. Introduction
Damage in a structure under loading can be defined as the degradation or deterioration of its
integrity resulting in reduction of its load capacity. In earthquake-resistant design of structures,
some degree of damage in the structural members is generally accepted. This is done because the
cost of a structure designed to remain elastic during a severe earthquake would be very large. Thus,
existing seismic codes, e.g., EC8 [1], in an implicit way and more recent performance-based
seismic design methods [2-4] in an explicit and more systematic way employ the concept of
damage to establish structural performance levels corresponding to increasing levels of earthquake
actions. These performance levels mainly describe the damage of a structure through damage
indices, such as the inter-story drift ratio (IDR), or the member plastic rotations.
Several methods to determine damage indices as functions of certain response parameters have
been presented in the literature. In general, these methods can be noncumulative or cumulative in
nature. The most commonly used parameter of the first class is ductility, which relates damage only
to the maximum deformation and is still regarded as a critical design parameter by codes. To
account for the effects of cyclic loading, simple rules of stiffness and strength degradation have
been included in various noncumulative indices [5-7], mainly referred to reinforced concrete
members. Cumulative-type indices can be divided in deformation based [8] or hysteresis based
[9,10] formulations and methods that consider the effective distribution of inelastic cycles and
generalize the linear law of low-cycle fatigue of metals through a hypothesis of linear damage
accumulation [11]. Sucuoğlu and Erberik [12] developed low-cycle fatigue damage models for
deteriorating systems on the basis of test data and analysis and Kamaris et al. [13] proposed a new
damage model exhibiting strength and stiffness degradation which takes into account the
phenomenon of low-cycle fatigue and the interaction between axial force and bending moment at a
section of a beam-column steel member. Combinations of deformation and energy dissipation have
been also proposed to establish damage indices [14]. In these methods damage is expressed as a
linear combination of the damage caused by excessive deformation and that due to repeated cyclic
loading effects [14]. An extensive review of damage indices used in the literature can be found in
Powell and Allahabadi [15]. Finally, the concept of continuum damage mechanics [16] in
conjunction with the finite element method of concentrated inelasticity has been employed in the
analysis of steel and reinforced concrete structures [17,18] for the determination of their damage.
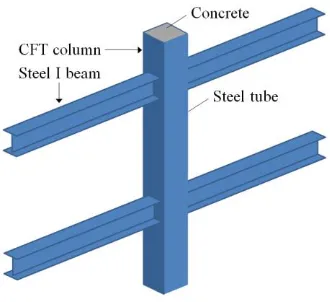
The composite moment resisting frames (MRFs) having concrete-filled steel tube (CFT)
columns and steel girders (CFT-MRFs) (Fig. 1) are a relatively new type of structures which offers
significant advantages for use as the primary resistance systems in building structures subjected to
and increased strength and stiffness to control the drifts. For these reasons, they have increasingly
investigated during the last decades for understanding their behaviour under seismic loads [19-21]
and have been popular in mid-rise and high-rise buildings in Japan and the U.S.
Fig. 1. CFT-MRF configuration
The main objective of this paper is to study the seismic inelastic behaviour of CFT-MRFs and
quantify their damage through simple expressions that relate the most commonly used damage
indices of the literature with the characteristics of the frames and the ground motions. Similar
expressions have been proposed by the authors for steel MRFs and x-braced frames [22], but
research on CFT-MRFs is still missing. For that reason, a large number of CFT-MRFs are subjected
to an ensemble of 100 ordinary (i.e. without near-fault effects) ground motions scaled to different
intensities. A response databank is created and a regression analysis is performed in order to derive
simple formulae that can be used for the prediction of damage. Two examples are utilized to
illustrate the use of the proposed formulae and demonstrate their efficiency and accuracy. It should
be pointed out that the seismic damage calculated herein is “probably expected” and not a
deterministic damage value, since the procedures utilized in this paper are based on statistical
formulae.
The proposed methodology provides the means of a rapid and accurate damage assessment of
existing structures, avoiding the use of the more sophisticated and time consuming non-linear
dynamic analysis. It can also be utilized in the preliminary design of structures in the framework of
a performance based design approach in order to size a frame to achieve a preselected damage level.
Thus, the designer can perform a high quality preliminary design based on elastic analysis and the
proposed relationships, which can significantly decrease the need for iterations in an
[image:4.595.231.396.135.286.2]2. Damage indices used in this study
The proposed damage expressions are associated with four damage indices existing in the
literature. These are the damage indices of Park and Ang [14], Bracci et al. [10], Roufaiel and
Meyer [6] and Banon and Veneziano [5]. These indices have been selected here because i) are the
most widely used in applications and ii) can be easily employed with the aid of the Ruaumoko 2D
program [23]. In the following, a brief description of all these four damage indices will be given for
reasons of completeness.
The damage index DPA of Park and Ang [14] is expressed as a linear combination of the damage
caused by excessive deformation and that contributed by repeated cyclic loading effects, as shown
in the following equation:
m PA
u y u
D dE
Q
(1)In the above, the first part of the index is expressed as the ratio of the maximum experienced
deformation δm to the ultimate deformation δu under monotonic loading. The second part is defined
as the ratio of the dissipated energy
dE to the term (Qy δu)/β, where Qy is the yield strength and thecoefficient β is a non-negative parameter determined from experimental calibration. In this work β
is taken equal to 0.025 for the steel beams [24] and 0.03 for the CFT columns [25] of the frames
used herein.
Bracci et al. [10] suggested a damage index equal to the ratio of ‘damage consumption’ (loss in
damage capacity) to ‘damage potential’ (capacity), defined as appropriate areas under the
monotonic and the low-cycle fatigue envelopes. Thus, the ‘damage potential’ DP is defined as the
total area between the monotonic load–deformation curve and the fatigue failure envelope. As
damage proceeds, the load–deformation curve degrades, resulting in the damage Ds due to the loss
of strength, while the irrecoverable deformation causes the deformation damage DD. Thus, this
damage index DBRM is expressed as
D S
BRM
P
D D
D
D
(2)
Roufaiel and Meyer [6] proposed that the ratio between the secant stiffness at the onset of
indicator of damage. Based on that, they defined the modified flexural damage ratio (MFDR) or
DRM as
max[ , ]
RM
D MFDR MFDR MFDR (3)
,
y y y y
x m x m
x y m y x y m y
MFDR MFDR
M M M M M M M M
(4)
whereis the beam curvature due to a bending moment M, the term My y is the initial elastic
stiffness and subscripts + and – denote the loading direction.
The Banon and Veneziano [5] analysis is set in a probabilistic context and their model has been
calibrated on the basis of 29 different tests on reinforced concrete elements and structures, selected
from among the most representative ones in the technical literature. In particular, the damage
parameters dl and d2 are defined, respectively, as the ratio of stiffness at yielding point to secant
stiffness at failure, and the plastic dissipated energy Eh normalized with respect to the absorbed
energy at the elastic limit. If the elastic-plastic model is used, d1 is obviously equal to the ratio of
the maximum displacement xmax to the displacement at the elastic limit xy. Therefore, according to
the notation introduced above, parameters d1 and d2can be expressed as
1 max y, 2 h 1 2 y y
d x x d E F x (5)
where Fy is the yield strength. Furthermore, modified damage parameters
* 1
d and d2* are introduced
of the form
*
1 1 1
d d (6)
*
2 2
b
d ad (7)
where a and b are two parameters which characterize the structural problem and are defined
experimentally. For flexure, x and F are replaced by θ and M, respectively. Thus, the damage index
3. Plane regularCFT-MRFs used in this study
3.1 Design and characteristics
A family of 48 plane regular (orthogonal without setbacks) along their height CFT-MRFs are
designed for the parametric study of this work aiming to cover a wide range of structural
characteristics of this type of composite structures. These frames have storey height and bay width
equal to 3 m and 5 m, respectively, and CFT column sections, as shown in Fig. 2, with b and t being
the side and thickness, respectively, of the square steel tubular cross-section of columns containing
concrete. Moreover, the frames have the following structural characteristics: number of stories, ns,
with values 1, 3, 6, 9, 12, 15, 18 and 20, number of bays, nb = 3, steel yielding stress ratio es = 235 /
fs with the yielding stress fs taking the values of 275 and 355 MPa, concrete strength ratio ec = 20 / fc
with the compressive strength fc taking the values 20 MPa. Additionally, the beam-to-column
stiffness ratio, ρ and column to beam strength ratio, α, taking various values within practical limits
[image:7.595.184.427.390.555.2]are also considered.
Fig. 2. Typical geometry of frames considered with columns of square concrete filled steel tube (CFT) sections.
The beam-to-column stiffness ratio ρ of a frame is based on the beam and column properties in
the storey closest to the mid-height of the frame and calculated by
bcI l
I l
(9)where I and l are the second moment of inertia and length of the steel member (column c or beam
b), respectively. The concrete core is considered as cracked and the effective second moment of
introduced during the investigation of the inelastic seismic response of steel MRFs the beam
strength ratio, α, which indicates how much stronger are the beams in comparison with the base
columns. Following [27], the strength ratio, α, adopted here is defined as
,1, ,
RC av RB av
M M
(10)
where MRC,1,av is the average of the plastic moments of resistance of the columns of the first storey
(including the influence of axial load for gravity-earthquake loading combination) and MRB,av is the
average of the plastic moments of resistance of the beams of all the stories of the frame. This
parameter quantifies the structural capacity to avoid the formation of a global plastic mechanism
which is developed when plastic hinges occur at the base of columns of the first floor and at the
ends of beams.
The CFT-MRFs are designed according to the structural Eurocodes 3 [28], 4 [26] and 8 [1] with
the aid of the computer programs SAP2000 [29] and MATLAB [30]. The parametric study of this
work is not based on the design of a 3D prototype building but on 2D CFT-MRFs. The seismic load
combination consists of the gravity load G + 0.3Q = 27.5 kN/m on beams plus the earthquake load
and the gravity load combination 1.35G + 1.5∙Q = 42.6 kN/m with G = 26 kN/m and Q = 5 kN/m
being the dead and live floor loads, respectively. Columns are not subjected to biaxial flexure. The
earthquake load is determined using design ground acceleration αg = 0.30g, soil type B (soil factor S
= 1.2) and Spectrum Type 1 with behaviour factor q = 4. In addition to the satisfaction of the
seismic strength demands in members, other seismic design checks include compliance with
stability and drift criteria as well as capacity design considerations.
Data for 24 of the 48 frames considered here, including values for ns, ρ, α, beam and column
cross-sections and fundamental periods of vibration, are presented in Table 1, for 275 MPa yield
steel stress. The sectional dimensions of the remaining 24 frames with 355 MPa yield steel stress
are the same in order to clarify the effect of that material parameter. In this table, numeric forms,
such as, 300×12.5 (1-4) and 300x10 (5-6), mean that the first four stories have CFT columns with
square steel tubes of width b = 300 mm and thickness t = 12.5 mm, whereas the next two higher
stories have CFT columns with square steel tubes of b = 300 mm and t = 10 mm, while numeric
Table 1. Characteristics of CFT-MRFs considered in the study.
No. ns ρ α T [s] Columns [CFT] (floors) Beams [IPE] (floors)
1 1 0.274 1.917 0.354 220x10 (1) 240 (1)
2 1 0.150 2.743 0.290 260x10 (1) 240 (1)
3 1 0.084 4.506 0.237 300x12.5 (1) 240 (1)
4 3 0.229 2.322 0.844 250x12.5 (1-3) 270 (1-3)
5 3 0.125 3.435 0.749 300x12.5(1-3) 270 (1-3)
6 3 0.082 4.489 0.690 340x12.5(1-3) 270 (1-3)
7 6 0.254 2.246 1.277 300x12.5 (1-4), 300x10 (5-6) 330 (1-4), 300 (5-6)
8 6 0.173 3.170 1.204 320x16 (1-4), 320x12.5 (5-6) 330 (1-4), 300 (5-6)
9 6 0.083 5.118 1.093 400x16 (1-4), 350x20 (5-6) 330 (1-4), 300 (5-6)
10 9 0.339 2.139 1.517 320x16 (1-5), 320x12.5 (6-7),
300x12.5 (8-9)
360 (1), 400 (2-5), 360 (6-7), 330 (8-9)
11 9 0.191 2.847 1.416 400x12.5 (1-5), 350x12.5 (6-7), 300x12.5
(8-9)
360 (1), 400 (2-5), 360 (6-7), 330 (8-9)
12 9 0.094 5.413 1.289 450x20 (1-5), 420x20 (6-7),
400x16 (8-9)
360 (1), 400 (2-5), 360 (6-7), 330 (8-9)
13 12 0.300 2.383 1.753 400x12.5 (1-5), 350x12.5 (6-8),
320x12.5 (9-10), 300x10 (11-12)
400 (1), 450 (2-5), 400 (6-8), 360 (9-10), 330 (11-12)
14 12 0.162 3.919 1.630 420x20 (1-5), 400x16 (6-8),
350x20 (9-10), 350x14 (11-12)
400 (1), 450 (2-5), 400 (6-8), 360 (9-10), 330 (11-12)
15 12 0.077 6.895 1.517 500x25 (1-5), 500x16 (6-8),
450x16 (9-10), 400x20 (11-12)
400 (1), 450 (2-5), 400 (6-8), 360 (9-10), 330 (11-12)
16 15 0.260 2.741 1.940
420x16 (1-5), 400x14 (6-8), 350x16 (9-11), 320x16 (12-13), 320x12.5 (14-15)
400 (1), 500 (2-5), 450 (6-8), 400 (9-11), 360 (12-13), 330 (14-15)
17 15 0.126 4.853 1.786
500x20 (1-5), 450x22.5 (6-8), 420x20 (9-11), 420x14 (12-13), 400x14 (14-15)
400 (1), 500 (2-5), 450 (6-8), 400 (9-11) 360 (12-13), 330 (14-15)
18 15 0.070 7.186 1.702
600x20 (1-5), 550x20 (6-8), 500x20 (9-10) 450x20 (11-12), 420x20 (14-15)
400 (1), 500 (2-5), 450 (6-8), 400 (9-11) 360 (12-13), 330 (14-15)
19 18 0.281 3.390 2.143
450x20 (1-5), 420x16 (6-9), 400x16 (10-13), 350x16 (14-16), 350x12.5 (17-18)
450 (1), 500 (2-9), 450(10-12) 400 (13-15), 360 (16-18)
20 18 0.192 4.280 2.055
500x20 (1-5), 450x20 (6-9), 420x20 (10-13), 420x12.5 (14-16), 350x16 (17-18)
450 (1), 500 (2-9), 450(10-12) 400 (13-15), 360 (16-18)
21 18 0.138 5.282 1.995
550x20 (1-5), 500x20 (6-9), 450x20 (10-13), 420x16 (14-16), 400x12.5 (17-18)
450 (1), 500 (2-9), 450(10-12) 400 (13-15), 360 (16-18)
22 20 0.287 3.338 2.390
450x20 (1-6), 420x16 (7-11), 400x16 (12-15), 350x16 (16-18), 320x16 (19-20)
450 (1-2), 500 (3-11), 450 (12-14), 400 (15-17), 360 (18-20)
23 20 0.181 4.214 2.284
500x20 (1-6), 450x22.5 (7-11), 420x20 (12-15), 400x16 (16-18), 350x20 (19-20)
450 (1-2), 500 (3-11), 450 (12-14), 400 (15-17), 360 (18-20)
24 20 0.101 6.300 2.162
600x20 (1-6), 550x20 (7-11), 500x20 (12-15), 450x20 (16-18), 420x20 (19-20)
3.2 Modelling for nonlinear analysis
The 48 CFT-MRFs mentioned in the previous section, are subject to a set of 100 accelerograms
and their response to those motions is determined through inelastic dynamic time-history analysis
using Newmark’s constant average acceleration method with the aid of the computer analysis
program Ruaumoko 2D [23]. Diaphragm action is assumed at every floor and the effect of large
deformations is taken into account. Rayleigh type damping corresponding to 3% of the critical
damping in the first and second mode is assumed. The deteriorating inelastic behaviour of all the
frame members is modelled by means of zero-length plastic hinges. Finally, the effect of panel
zones (PZs) was modelled by using the scissors model [31], assuming that the connections are rigid.
The Ramberg–Osgood hysteresis model is selected for simulating the seismic behaviour of steel
beams. Degradation effects can be included in the Ramberg-Osgood model with the aid of the
Ruaumoko's strength degradation model, which consists of a backbone curve based on ductility
demands [23], as shown in Fig. 3. The strength reduction variation of Fig. 3 can be defined using
the three parameters: DUCT1, which is the ductility at which the strength degradation begins,
DUCT2, which is the ductility at the end of strength degradation, DUCT3, which is the ductility at
1% initial strength, and RDUCT, which is the ratio of the residual strength over the initial yield
strength. The parameters which define the strength reduction variation of Ruaumoko's strength
degradation model can be determined using the proposed relationships by Lignos and Krawinkler
[33] in conjunction with the PEER/ATC 72-1 [34] guidelines. The modified Al-Bermani model
developed by Skalomenos et al. [32] is used to simulate the hysteretic behaviour of CFT columns.
This model is selected for two reasons: (i) the model was calibrated by Skalomenos et al. [32] for a
wide range of values of the geometrical and strength parameters and (ii) the model is a simple
concentrated plasticity model that can provide very good predictions of the force-deformation
responses of CFT columns to cyclic loading, which exhibit material deterioration. Thus, the
analytical models considered here account for nonlinearities due to yielding and local buckling of
the steel beams and steel tubes of the CFT columns, cracking and crushing of concrete in the CFT
columns and steel yielding and concrete cracking in the PZs. All the analytical models of frame
components utilized here are based on concentrated plasticity theory and are presented in detail in
Skalomenos et al. [32, 35], where the accuracy of the numerical response predictions is shown in a
wide range of comparisons between numerical and experimental results. Finally, the
modelling/analysis for the CFT columns take into account the bending moment – axial load (M –
1
0.01
(>1)
Mult
ip
lier of
Yie
ld
Moment
Ductility
0 DUCT1 DUCT2 DUCT3 RDUCT
Fig. 3. Strength reduction variation using ductility terms [23].
3.3 Model validation
The composite MRF investigated experimentally by a pseudodynamic testing method by
Herrera et al. [20] is used here to verify the validity of the aforementioned models for individual
components (columns, beams, connections, and PZ) of a CFT-MRF by comparing its response to
acceleration records at different seismic hazards as obtained experimentally and numerically with
the aid of RUAUMOKO [23]. This frame is a 0.6-scale two-dimensional model of an external
four-story/two-bay CFT-MRF of a three-dimensional prototype building, as shown in Fig. 4(a). In
addition to the four stories above the ground, the frame also has a basement level and consists of
rectangular CFT columns, wide flange beams, and split-tee moment connections. A typical interior
joint of the frame and its analytical model are shown in Fig. 4(b) to illustrate the connectivity
between the element models. The column model end nodes are at the boundary of the PZ, and the
beam model end nodes are connected through the connection model to the nodes on the PZ
boundary at the face of the column. The beam end nodes and PZ boundary nodes have the same
horizontal displacement, and their vertical and rotational DOFs are connected by the vertical and
rotational springs of the spring connection model, respectively.
In the analysis model, the P-Δ effects due to lateral displacements are taken into account through a
leaning column with properties determined from the interior gravity frames of the prototype
building. The leaning column is connected to the frame through loading beams attached to the
midpoint of the steel girders at both bays of the structure with pin connections, as shown in Fig.
4(a). Additionally, the column is continuous, pinned at its base and constrained to have the same
lateral displacement as the floor at each floor level. Consistent with the pseudodynamic model
designed for the experiment, the loading beams are modelled as rigid links with large stiffness
[image:11.595.170.438.59.242.2]properties of one-half of the interior columns tributary to the prototype building. The mass of the
structure is assumed to be lumped to the nodes of the leaning column at the story heights. Stiffness
and mass proportional damping (Rayleigh damping) are assumed with proportionality factors of
0.1547 and 0.001194 for the stiffness and mass matrices, respectively, as a result of assumed 2%
viscous damping in the first and third modes. The measured geometric and material properties of
the structure members are utilized for determining the necessary parameters for the analytical
models of individual components of the numerically analysed frame. It should be noted that the test
structure has already been scaled down with the relevant multiplier factors by Herrera et al. [20]. As
mentioned earlier, the experiment was conducted under different hazard levels. First, the frame was
subjected to the Imperial Valley Array 04 (1979) ground motion record representing a frequently
occurring earthquake (FOE). The accelerogram scale factor for the FOE level was 0.400. The
maximum roof displacement was measured as 0.6% of the building height, and the structure
remained primarily elastic. Second, the structure was loaded according to the Northridge Canoga
Park (1994) ground motion record scaled to the design basis earthquake (DBE) level for this
structure based on response spectrum for stiff soil conditions. The accelerogram scale factor for the
DBE level was 1.275. The maximum roof displacement was measured as 3.0% of the building
height, and the frame experienced inelastic deformation without significant strength degradation.
After this test, the frame was straightened to eliminate the residual drift. Third, the structure was
subjected to the Northridge Canoga Park (1994) ground motion record scaled to the maximum
considered earthquake (MCE) level. The accelerogram scale factor for the MCE level was 1.912.
The maximum roof displacement was measured as 3.7% of the building height. Plastic hinges
formed in the beams, and a crack developed at the bottom of the first story middle column, resulting
in a drop in shear capacity. Lastly, the frame was subjected to a second DBE, representing an
aftershock. The maximum roof displacement was measured as 3.3% of the building height. The
crack from the previous test propagated, and another crack was formed, but the frame did not
collapse. Fig. 5(a) and (b) shows the computational and experimental displacement time-history
results for the first and fourth floors corresponding to the design level (DBE), respectively, while
Fig. 6(a) and (b), the same response quantities to the MCE loading. As can been seen from Figs. 5–
6, the analysis results closely follow the experimental ones. Significant inelastic response was
observed for both steel and CFT column members. However, the extent of damage was larger for
(a) (b)
Fig. 4. (a) Test CFT-MRF by Herrera et al. [20] and (b) illustration of all models [35].
0 2 4 6 8 10 12 14 16 18 20 -0.08 -0.06 -0.04 -0.02 0.00 0.02 0.04 0.06 0.08 Analysis Experiment
Scale time, t (sec)
1
st floor
displa
ce
me
nt, u (m)
(a)
0 2 4 6 8 10 12 14 16 18 20 -0.25 -0.20 -0.15 -0.10 -0.05 0.00 0.05 0.10 0.15 0.20 0.25 Analysis Experiment
Scale time, t (sec)
4
[image:13.595.79.483.310.444.2]th floor displacement, u (m) (b)
Fig. 5. Comparisons of experimental and computational results: (a) first-floor and (b) fourth-floor displacement history for DBE test [35].
0 2 4 6 8 10 12 14 16 18 20
-0.15 -0.12 -0.09 -0.06 -0.03 0.00 0.03 0.06 0.09 Analysis Experiment
Scale time, t (sec)
1st floor di
splac
em
ent
, u (m)
(a)
0 2 4 6 8 10 12 14 16 18 20 -0.4 -0.3 -0.2 -0.1 0.0 0.1 0.2 Analysis Experiment
Scale time, t (sec)
4
th floor di
splac
em
ent
, u (m)
(b)
[image:13.595.77.484.533.670.2]4. Ground motions considered
A set of 100 ordinary (far-field type) ground motions recorded at soils with average shear wave
velocity vs,30 in the range between 360 and 800 m/s (classified according to Eurocode 8 [1] as soil
type B) are selected from the PEER [37] database and are used for the nonlinear time history
analyses of this study. Event magnitudes ranged from M 6.0 to M 7.5. The selection of these
ordinary ground motions was made in such a way so that their geometric average spectrum is as
close as possible to the Eurocode 8 [1] elastic spectrum for ground acceleration 0.30 g and soil type
B. The acceleration response spectra of the selected 100 motions are shown in Fig. 7 against to the
Eurocode 8 [1] elastic spectrum. A full list of all these ground motions with their characteristics can
[image:14.595.58.429.304.487.2]be found in Skalomenos [38].
Fig. 7. Acceleration response spectra of the 100 earthquakes under consideration and comparison with Eurocode 8 [1] elastic spectrum.
5. Methodology for computation of damage expressions
In the present work, an extensive parametric study was conducted for the 48 CFT-MRFs of
Table 1, which were subjected to the 100 ground motions of Fig. 7 for the evaluation of the damage
expressions. The frames were analyzed with the program Ruaumoko 2D [23] using the incremental
dynamic analysis method [39]. Thus, approximately 72000 analyses (=48 frames x 100 ground
motions x 15 analyses on the average for every frame) were conducted in this work. These 15 on
the average analyses for every frame correspond to 15 different PGA values for every ground
motion.
The ground motion intensity level was measured here by an intensity measure equal to the
0.001 0.01 0.1 1 10
0.01 0.1 1 10
S
pe
ctr
al
A
cc
el
erati
on
,
S
a(g)
Period, T (sec)
among all storeys that was recorded during the time history of the analysis. More specifically, each
ground motion was continuously scaled by increasing its Sa until the frame to become dynamically
unstable and collapse, while no limit of maximum drift was considered. The results of the analysis
were post-processed in order to create a databank with the response quantities of interest.
The created databank is actually a spreadsheet with rows equal to the number of nonlinear
analyses and columns equal to the response quantities of interest in columns and beams of a
CFT-MRF along its height. Those response quantities are the maximum values of the following damage
indices:1) Park and Ang damage index, DPA, 2) Bracci et al. damage index, DB, 3) Roufaiel and
Meyer damage index, DRM and 4) Banon and Veneziano damage index, DBV. Moreover, the columns
of the databank were increased by adding the characteristics of the frames (ns, ρ, α) and the spectral
acceleration Sa.
6. Damage formulae for moment resisting frames
In this section, simple formulae to estimate seismic damage, through four well known damage
indices, of CFT-MRFs are proposed. Thus, with the aid of these simple expressions one can
determine the maximum damage, D, of column bases or beams of this type of frames in terms of
characteristics of the structure and the ground motions that excite them.
By analyzing the response databank, the proposed relationship was identified and thus the
expression
5 4
3
2 a
1
235 b
b b
b s
s S
D b n
g f
(11)
with b1, b2, b3, b4 and b5 constants to be determined, was selected as a good candidate for
approximating the response databank. The aforementioned relation is relatively simple and satisfies
the physical constraint D=0 for Sa=0. However, for nonzero values of Sa for which structural
members behave elastically, Eq. (11) gives nonzero values of damage either at columns or beams,
while in reality damage there is zero. Thus, before using this equation, one should compute the
internal forces (bending moments M and axial forces P) of the columns or beams by performing a
linear elastic analysis and check if their values are in the elastic range. This can be done by
checking if the computed (M,P) combination lies inside the area enclosed by the M-P interaction
diagram of Fig. 8 taken from the Ruaumoko computer program [23], where M0, PYT and PYC
denote the yield moment at P = 0, the axial tension yield force and the axial compression yield force
zero by default, otherwise the proposed relationship can be used. Use of the Levenberg–Marquardt
algorithm [30] for nonlinear regression analysis of the results of the parametric study, led to the
following expressions for each one of the four damage indices
Fig. 8. M-P interaction diagram taken from the Ruaumoko computer program [23].
a) for column bases:
0.05 0.39
0.16 0.30 a 235
0.24
c
PA s
s S
D n
g f
(12)
0.33 0.26
0.12 0.47 a 235
0.63
c
BRM s
s S
D n
g f
(13)
0.45 0.36
0.16 0.46 a 235
0.45
c
RM s
s S
D n
g f
(14)
0.02 0.39
0.12 0.33 a 235
0.33
c
BV s
s S
D n
g f
(15)
b) for beams:
[image:16.595.193.389.151.316.2]0.01 0.24
0.17 0.08 a 235
0.49 b BRM s s S D n g f
(17)
0.14 0.38
0.30 0.17 a 235
0.28 b RM s s S D n g f
(18)
0.10 0.36
0.27 0.06 a 235
0.40 b BV s s S D n g f
(19)
With D being any damage index of interest, the mean, median and standard deviation of the
ratio of the “exact” value of D obtained from inelastic dynamic analyses over the approximate one
calculated from Eqs (12) to (19), respectively., i.e., Dexact/Dapp, are used in order to express the
central tendency and the dispersion of the error introduced by the proposed relations. Thus, these
metrics for the damage indices used in this study are presented in Table 2. The values of those
metrics show that the proposed formulae are fairly accurate. In addition, Fig. 9 depicts graphs of all
the damage indices based on the proposed relationships versus their “exact” values for (a) columns
and (b) beams.
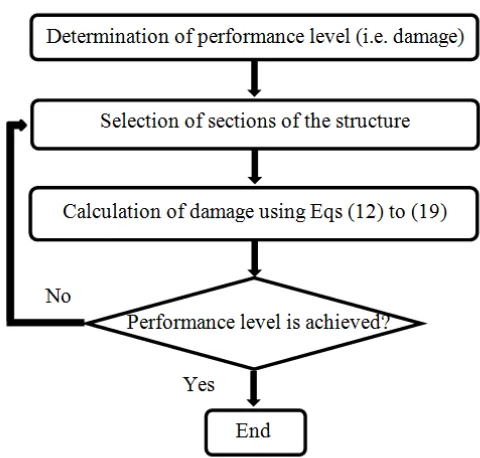
Eqs (12) to (19) can also be utilized in the preliminary performance based design of structures
in conjunction with elastic analysis in order to decrease the need for iterations in the analysis/design
procedure. For this purpose, a flowchart showing how the design process should be conducted to
[image:17.595.65.534.568.735.2]take advantage of these equations is depicted in Fig. 10.
Table 2. Metrics of Dexact/Dappforall damage indices considered in this study.
Dexact/Dapp (Column Bases) Mean Median Standard Deviation
DPAM 1.00 0.96 0.29
DBRM 1.00 0.99 0.26
DRMO 1.00 0.93 0.37
DBVM 0.99 0.97 0.27
Dexact/Dapp (Beams) Mean Median Standard Deviation
DPAM 0.99 0.96 0.27
DBRM 1.00 0.98 0.18
DRMO 1.00 0.98 0.27
(a)
(b)
Fig. 9. Damage indices based on proposed equations versus exact values for (a) columns and (b) beams
0 0.2 0.4 0.6 0.8 1
0 0.2 0.4 0.6 0.8 1
DPA (Exact Values)
DP A ( A p p ro x im a te V a lu e s )
0 0.2 0.4 0.6 0.8 1
0 0.2 0.4 0.6 0.8 1
DBRM (Exact Values)
DB R M ( A p p ro x im a te V a lu e s )
0 0.2 0.4 0.6 0.8 1
0 0.2 0.4 0.6 0.8 1
DRM (Exact Values)
DR M ( A p p ro x im a te V a lu e s )
0 0.2 0.4 0.6 0.8 1
0 0.2 0.4 0.6 0.8 1
DBV (Exact Values)
DB V ( A p p ro x im a te V a lu e s )
0 0.2 0.4 0.6 0.8 1
0 0.2 0.4 0.6 0.8 1
DPA (Exact Values)
DP A ( A p p ro x im a te V a lu e s )
0 0.2 0.4 0.6 0.8 1
0 0.2 0.4 0.6 0.8 1
DBRM (Exact Values)
DB R M ( A p p ro x im a te V a lu e s )
0 0.2 0.4 0.6 0.8 1
0 0.2 0.4 0.6 0.8 1
DRM (Exact Values)
DR M ( A p p ro x im a te V a lu e s )
0 0.2 0.4 0.6 0.8 1
0 0.2 0.4 0.6 0.8 1
DBV (Exact Values)
[image:18.595.113.490.56.715.2]Fig. 10. Design process including proposed equations
7. Examples of application
In this section, three numerical examples are presented in order to illustrate the use of the
proposed expressions and demonstrate their advantages and precision by comparing the results
derived by them to the “exact” values of damage obtained by nonlinear dynamic analyses.
7.1 Three storey moment resisting frame
A three storey-three bay CFT-MRF is examined, with a geometrical configuration similar to the
one shown in Fig. 2. The seismic load combination consists of the gravity load G + 0.3Q = 27.5
kN/m on beams plus the earthquake load and the gravity load combination 1.35G + 1.5∙Q = 42.6
kN/m. The frame has been designed in accordance with the provisions of structural Eurocodes,
using design ground acceleration αg = 0.30g, soil type B (soil factor S = 1.2) and Spectrum Type 1
with behaviour factor q = 4. The yielding stress fs takes the value of 275 MPa. The design yielded
CFT columns with square steel tubes of width b = 300 mm and thickness t = 12.5 mm and IPE 240
beams for all the floors.
The characteristic value α of the frame was computed on the basis of Equation (10) and found to
be equal to 2.322. The expected ground motion was defined by the acceleration response spectrum
of EC8 [1] with a PGA equal to 0.35 g and a soil of class B. The fundamental period of vibration, T,
of the frame is equal to 0.844 s, while its spectral acceleration Sa corresponding to this period,
derived in the basis of EC8 [1] spectrum, equals 0.64 g.
Eight semi-artificial accelerograms compatible with the EC8 [1] spectrum were generated via a
spectra of these motions, in comparison with the EC8 [1] spectrum, are depicted in Fig. 11.
Nonlinear time history analyses of the designed frame under these motions were performed. The
four damage indices used here and observed in column bases and beams of the frame were
computed with the aid of the program Ruaumoko 2D [23]. Then, the mean value of the maximum
damage values for the eight semi-artificial accelerograms was evaluated for each damage index.
Before using the proposed formulae, the internal forces (bending moments M and axial forces P) of
the columns or beams were computed by performing a linear elastic analysis and it was checked if
their values are in the elastic range as explained in Section 6. It was found that both the column
bases and beams were not in the elastic range. Thus, the approximate values of the damage indices
were computed with the aid of Eqs (12)-(19) and recorded together with the exact ones in Tables 4
and 5 for column bases and beams, respectively. The proposed relations predict satisfactorily the
damage of the beams (error = 5.6-9.5%) for all kinds of indices. For the columns bases damage is
also predicted fairly well (error = 4.7-16.0%) for all kinds of indices. Thus, the predictions of the
proposed formulae are quite close to the “exact” ones and as far as the columns are concerned, in
[image:20.595.100.495.405.513.2]most of the cases, on the safe (conservative) side as being larger than the “exact” ones.
Table 3. Characteristics of ground motions used in the examples.
No. Date Record Name Comp. Station Name PGA (g)
1. 1992/04/25 Cape Mendocino NS 89509 Eureka 0.154
2. 1992/06/28 Landers N045 24577 Fort Irwin 0.114
3. 1994/01/17 Northridge EW 24389 LA - Century City CC North 0.256
4. 1994/01/17 Northridge EW 24538 Santa Monica City Hall 0.883
5. 1994/01/17 Northridge EW 24400 LA - Obregon Park 0.355
6. 1994/01/17 Northridge EW 127 Lake Hughes #9 0.165
7. 1994/01/17 Northridge N035 90014 Beverly Hills- 12520 Mulhol 0.617
0.0 0.5 1.0 1.5 2.0 2.5 3.0 0
1 2 3 4 5 6 7 8 9 10 11 12
Pse
u
d
o
-a
cce
le
ra
tio
n
(m/
se
c
2 )
[image:21.595.146.434.81.303.2]Period (sec)
[image:21.595.114.483.387.471.2]Fig. 11. Response spectra of ground motions used in the examples of Section 7.
Table 4. Comparison between “exact” and approximate values of damage indices for columns of the CFT-MRF of the example of Section 7.1.
Damage Index “Exact” Value Approximate Value Error(%)
DPAM 0.157 0.187 16.0
DBRM 0.436 0.411 5.6
DRMO 0.273 0.287 4.7
DBVM 0.203 0.240 15.7
Table 5. Comparison between “exact” and approximate values of damage indices for beams of the CFT-MRF of the example of Section 7.1.
Damage Index “Exact” Value Approximate Value Error(%)
DPAM 0.355 0.335 5.6
DBRM 0.544 0.500 8.1
DRMO 0.315 0.295 6.4
DBVM 0.494 0.447 9.5
7.2 Six storey moment resisting frame
A six storey-three bay CFT-MRF is examined, with a geometrical configuration similar to that
shown in Fig. 2. The seismic load combination consists of the gravity load G + 0.3Q = 27.5 kN/m
on beams plus the earthquake load and the gravity load combination 1.35G + 1.5∙Q = 42.6 kN/m.
The frame has been designed in accordance with the provisions of structural Eurocodes, using
design ground acceleration αg = 0.30g, soil type B (soil factor S = 1.2) and Spectrum Type 1 with
[image:21.595.114.485.519.602.2]The characteristic value α of the frame was computed on the basis of Equation (10) and found to
be equal to 3.17. The fundamental period of vibration, T, of the frame and the corresponding
spectral acceleration Sa from the EC8 [1] spectrum were equal to equal to 1.204 s and 0.45 g,
respectively.
The records of the previous example are again used here. Nonlinear time history analyses of the
designed frame under these motions were performed. The four damage indices used here and
observed in column bases and beams of the frame were computed with the aid of the program
Ruaumoko 2D [23]. Then, the mean value of the maximum damage values for the eight
semi-artificial accelerograms was calculated for each damage index. Before using the proposed formulae,
the internal forces (bending moments M and axial forces P) of the columns or beams were
computed by performing a linear elastic analysis and it was checked if their values are in the elastic
range as explained in Section 6. It was found that only the column bases were in the elastic range.
Thus, the values of the damage indices at the column bases were set equal to zero by default and
Eqs (12)-(15) were not used in this case. Moreover, the approximate values of the damage indices
for the beams were computed with the aid of Eqs (16)-(19) and recorded together with the exact
ones in Table 6. The proposed relations predict the damage of the beams with high accuracy (error
= 6.8 - 8.8%) for all kinds of indices, and they are on the safe (conservative) side, in most of the
cases.
Table 6. Comparison between “exact” and approximate values of damage indices for beams of the CFT-MRF of the example of Section 7.2.
Damage Index “Exact” Value Approximate Value Error(%)
DPAM 0.321 0.346 7.2
DBRM 0.466 0.500 6.8
DRMO 0.279 0.300 7.0
DBVM 0.509 0.464 8.8
7.3 Composite MRF of Herrera et al. [20]
The composite MRF investigated experimentally by Herrera et al. [20] is used herein as an
example for the validation of the proposed relationships. The characteristics of the frame and all its
design details are given in subsection 3.3 and are different than that used for the parametric studies.
This is done to test the proposed equations for a frame configuration different than that used for the
calibration of the proposed equations.
[image:22.595.113.482.479.563.2]T, of the frame is equal to 1.108 s, while its spectral acceleration Sa corresponding to this period,
derived in the basis of EC8 [1] spectrum, equals 0.49 g.
The records of the example in subsection 7.1 are again used here. Nonlinear time history
analyses of the designed frame under these motions were performed. The four damage indices used
here and observed in column bases and beams of the frame were computed with the aid of the
program Ruaumoko 2D [23]. Then, the mean value of the maximum damage values for the eight
semi-artificial accelerograms was calculated for each damage index. Before using the proposed
formulae, the internal forces (bending moments M and axial forces P) of the columns or beams
were computed by performing a linear elastic analysis and it was checked if their values are in the
elastic range as explained in Section 6. It was found that only the column bases were in the elastic
range. Thus, the values of the damage indices at the column bases were set equal to zero by default
and Eqs (12)-(15) were not used in this case. Moreover, the approximate values of the damage
indices for the beams were computed with the aid of Eqs (16)-(19) and recorded together with the
exact ones in Table 7. The proposed relations predict the damage of the beams fairly well (error =
11.7 - 20.5%) for all kinds of indices, and they are on the safe (conservative) side, for the cases of
Bracci et al. [10] and Roufaiel and Meyer [6] damage indices. The prediction of the damage indices
of this example was not as accurate as that of the previous examples. This is logical, because the
frame used here has different structural characteristics (e.g. storey height and bay width) than the
frames used in the parametric studies. However, this prediction can be considered as satisfactory,
since it was managed to estimate damage of a frame with different structural configuration and
properties than those used for the derivation of the proposed equations.
Table 7. Comparison between “exact” and approximate values of damage indices for beams of the CFT-MRF of the example of Section 7.3.
Damage Index “Exact” Value Approximate Value Error(%)
DPAM 0.462 0.408 11.7
DBRM 0.432 0.512 15.6
DRMO 0.389 0.448 13.2
DBVM 0.658 0.523 20.5
8. Conclusions
A procedure in terms of simple formulae for estimating the maximum damage in regular
multi-storey CFT-MRFs subjected to ordinary (i.e. without near-fault pulses effects) ground motions has
been presented. Particularly, simple and easy to use relationships were derived for the computation
of four damage indices of the literature, which take into account the influence of basic
[image:23.595.113.481.541.625.2]ratio, steel yielding stress ratio and spectral acceleration. The scope of the frames used in this study
is to represent the behaviour of a wide range of CFT-MRFs, including structures from low to high
number of storeys, which can be implemented in common practice. It should be noticed herein that
the proposed relations are valid for frames with characteristics similar to those of the frames used in
the parametric study and for seismic sites where ordinary ground motions are expected. These
expressions give a good approximation of damage and provide a rapid damage assessment of
existing structures without the use of the more sophisticated and time consuming non-linear
dynamic analysis. Finally, They can also be utilized in the preliminary design of structures in
conjunction with elastic analysis in order to decrease the need for iterations in the analysis/design
References
[1] EC8. Design of structures for earthquake resistance, Part 1: General rules, seismic actions and
rules for buildings, European Committee for Standardization (CEN), Brussels, Belgium,
2004.
[2] Fajfar P and Krawinkler H. Seismic Design Methodologies for the Next Generation of Codes.
Bled, 24-27 June 1997, Balkema, Rotterdam.
[3] FEMA. FEMA-273 Building Seismic Safety Council, NEHRP guidelines for the seismic
rehabilitation of buildings. Federal Emergency Management Agency, Washington (DC),
1997.
[4] Kamaris GS, Hatzigeorgiou GD, Beskos DE. Direct damage controlled seismic design of
plane steel degrading frames. Bulletin of Earthquake Engineering, 2015; 13(2):587-612.
[5] Banon H, Veneziano D. Seismic safety of reinforced concrete members and structures.
Earthquake Engineering and Structural Dynamics 1982; 10:179-173.
[6] Roufaiel MS, Meyer C. Analytical modeling of hysteretic behavior of R/C frames. Journal of
Structural Engineering, ASCE 1987; 113:429-444.
[7] Cosenza E, Manfredi G, Ramasco R. The use of damage functionals in earthquake
engineering: A comparison between different methods. Earthquake Engineering and
Structural Dynamics 1993; 22(10):855-868.
[8] Stephens JE, Yao JTP. Damage assessment using response measurements. Journal of
Structural Engineering, ASCE 1987; 113:787-801.
[9] McCabe SL, Hall WJ. Assessment of seismic structural damage. Journal of Structural
Engineering, ASCE 1989; 115: 2166-2183.
[10] Bracci JM, Reinhorn, AM, Mander JB. Deterministic model for seismic damage evaluation of
reinforced concrete structures, Technical Report NCEER 89-0033, State University of New
York at Buffalo, 1989.
[11] Krawinkler H, Zohrei M. Cumulative damage in steel structures subjected to earthquake
ground motions. Computers and Structures 1983; 16:531-541.
[12] Sucuoğlu H, Erberik A. Energy-based hysteresis and damage models for deteriorating
[13] Kamaris GS, Hatzigeorgiou GD, Beskos DE. A new damage index for plane steel frames
exhibiting strength and stiffness degradation under seismic motion. Engineering Structures,
2013; 46:727-736.
[14] Park Y-J, Ang AH-S. Mechanistic seismic damage model for reinforced concrete. Journal of
Structural Engineering, ASCE 1985; 111:722-739.
[15] Powell GH, Allahabadi R. Seismic damage prediction by deterministic methods: concepts
and procedures. Earthquake Engineering and Structural Dynamics 1988; 16: 719-734.
[16] Lemaitre J. ACourse on Damage Mechanics. Springer-Verlag, Berlin, 1992.
[17] Hatzigeorgiou GD, Beskos DE. Direct damage controlled design of concrete structures.
Journal of Structural Engineering, ASCE 2007; 133:205-215.
[18] Kamaris GS, Hatzigeorgiou GD, Beskos DE. Direct damage controlled design of plane
steel-moment resisting frames using static inelastic analysis. Journal of Mechanics of Materials and
Structures 2009; 4:1375-1393.
[19] Hajjar JF. Composite steel and concrete structural systems for seismic engineering. J Constr
Steel Res 2002; 58: 703-728.
[20] Herrera RA, Ricles JM, Sause R.Seismic Performance Evaluation of a Large-Scale Composite
MRF Using Pseudodynamic Testing. J Struct Eng ASCE 2008; 134(2): 279-288.
[21] Skalomenos, K.A., Hatzigeorgiou, G.D., Beskos, D.E. Seismic behavior of composite
steel/concrete MRFs: Deformation assessment and behavior factors”, Bulletin of Earthquake
Engineering 2015; Online first.
[22] Kamaris GS, Vallianatou Y-M, Beskos DE. Seismic damage estimation of in-plane regular
steel moment resisting and x-braced frames. Bulletin of Earthquake Engineering 2012;
10(6):1745-1766.
[23] Carr AJ. Ruaumoko-2D. Inelastic Time-History Analysis of Two-Dimensional Framed
Structures, Department of Civil Engineering. University of Canterbury, New Zealand, 2006.
[24] Castiglioni CA, Pucinotti R. Failure criteria and cumulative damage models for steel
components under cyclic loading. Journal of Constructional Steel Research 2009; 65:751-765.
[25] Du X-K, Wang T-C, He H, Yi K. Experimental Research and Damage Model of Square
[26] EC4: Design of composite steel and concrete structures - Part 1.1: General rules and rules for
buildings, European Committee for Standardization (CEN), Brussels, Belgium, 2004.
[27] Karavasilis TL, Bazeos N, Beskos DE. Drift and Ductility Estimates in Regular Steel MRF
Subjected to Ordinary Ground Motions: A Design-Oriented Approach. Earthquake Spectra
2008; 24(2):431-451.
[28] EC3. Design of steel structures - Part 1.1: General rules and rules for buildings, European
Committee for Standardization (CEN), Brussels, Belgium, 2005.
[29] SAP2000. Static and Dynamic Finite Element Analysis of Structures - V16. Computers and
Structures Inc., Berkeley, California, 2013.
[30] MATLAB. The language of technical computing, Version 5.0. The Mathworks Inc., Natick,
Mass, 2009.
[31] Castro, J.M., Elghazouli, A.Y., Izzuddin, B.A. Modeling of the panel zone in steel and
composite moment frames. Engineering Structures 2005; 27:129–144.
[32] Skalomenos KA, Hatzigeorgiou GD, Beskos DE. Parameter identification of three hysteretic
models for the simulation of the response of CFT columns to cyclic loading. Engineering
Structures 2014; 61:44-60.
[33] Lignos DG, Krawinkler HK. Deterioration modeling of steel components in support of
collapse prediction of steel moment frames under earthquake loading. Journal of Structural
Engineering, ASCE, 2011; 137(11): 1291-1302.
[34] PEER/ATC. Modeling and Acceptance Criteria for Seismic Analysis and Design of Tall
Buildings. Report No 72-1, Applied Technology Council. Redwood City, California, 2010.
[35] Skalomenos KA, Hatzigeorgiou GD, Beskos DE. Modelling level selection for seismic
analysis of CFT/MRFs by using fragility curves. Earthquake Engineering Structural
Dynamics 2015; 44(2): 199-220.
[36] Zhao XL, Han LH, Lu H. Concrete-filled Tubular Members and Connections. Spon Press,
New York, 2010.
[37] NGA Strong ground motion database. Pacific Earthquake Engineering Research Center,
[38] Skalomenos KA. Seismic performance of plane moment resisting frames with concrete filled
steel tube columns and steel I beams. Ph.D. Dissertation, Department of Civil Engineering,
University of Patras, Greece, 2014, http://hdl.handle.net/10889/8442.
[39] Vamvatsikos D. Cornell CA. Incremental dynamic analysis. Earthquake Engineering
Structural Dynamics 2002; 31(3):491-514.
[40] Karabalis DL, Cokkinides GJ, Rizos DC. Seismic Record Processing Program-Ver.1.03,


![Fig. 3. Strength reduction variation using ductility terms [23].](https://thumb-us.123doks.com/thumbv2/123dok_us/9473369.453688/11.595.170.438.59.242/fig-strength-reduction-variation-using-ductility-terms.webp)
![Fig. 5. Comparisons of experimental and computational results: (a) first-floor and (b) fourth-floor displacement history for DBE test [35]](https://thumb-us.123doks.com/thumbv2/123dok_us/9473369.453688/13.595.79.483.310.444/comparisons-experimental-computational-results-floor-fourth-displacement-history.webp)
![Fig. 7. Acceleration response spectra of the 100 earthquakes under consideration and comparison with Eurocode 8 [1] elastic spectrum](https://thumb-us.123doks.com/thumbv2/123dok_us/9473369.453688/14.595.58.429.304.487/acceleration-response-spectra-earthquakes-consideration-comparison-eurocode-spectrum.webp)
![Fig. 8. M-P interaction diagram taken from the Ruaumoko computer program [23].](https://thumb-us.123doks.com/thumbv2/123dok_us/9473369.453688/16.595.193.389.151.316/fig-m-interaction-diagram-taken-ruaumoko-computer-program.webp)