Design and Optimization of Plant Layout through
Value Stream Mapping
M. Manzoor Hussain1, P. Deekshitha2
1, 2
Department of Mechanical Engineering, JNTUH college of Engineering, Hyderabad
Abstract: A lean manufacturing method is often considered to improve production with reduction in wastage in an industry. It is a form of business strategy. The operations which do not add any value to the product are wastage, and are eliminated as much as possible for higher productivity. Value stream mapping (VSM) is an effective tool to improvise the flow of the product through the industry and analyze the non-value added operations and their respective time. The product is tracked right from its receipt from the supplier till it is provided to the customer. In this paper an attempt is made to study the unwanted non-value added processes in VSM and provide necessary solutions to overcome the wastage.
Keywords: Value Stream Mapping, Layout Design, Arduino Uno, Process Cycle Efficiency, Casting Industry
I. INTRODUCTION
The aim of the lean manufacturing system is to potentially reduce the wastage and to increase productivity. It might seem an easy task in finding out the wastage or bottleneck in a plant but in some cases it is not, sometimes it becomes difficult to understand the problem in the industry that is leading to low productivity [1], [2].
In such cases Value Stream Mapping is a tool that helps effectively in finding out the problems that are encountered in the industry [3], [4]. After VSM it would be easy for the manufacturer to locate the problems, analyze them and provide necessary solutions in order to reduce them to an extent possible.
This would directly affect the productivity.
VSM also helps in sorting the value added time from non-value added time in the process of manufacturing a product. Value added time is the time required for various operations to be performed that adds value to the product i.e. the processes for which the customer is going to pay.
Whereas non- value added time is that time of processes which are not worth of any value or payment. Hence VSM helps in improving the current state of the industry to a future state with more productivity [5],[6],[7].
The casting industry chosen is situated in Medchal, Secunderabad, whose priority is sand cast products and productivity ranging from 240 to 270 products per day is taken as reference. This industry provides small cast products to automobile, farming, other public work machine making industries.
The production process in the industry is studied and data related to the layout, time taken for each process, number of workers required per process, number of products produced per batch, production capacity of independent machines, waiting locations and waiting time of the products in the process flow etc., are collected. This data is taken in VSM to get the current state Process Cycle Efficiency.
Process Cycle Efficiency = value added time / cycle time.
The layout of the industry is spread across an area of 250*200 square feet. The locations of various workstations and the flow of material are analyzed. Various processes involved in a casting industry in general are melting, pattern making, green sand mixing, core sand mixing, core making, mold making, pouring, cooling, shake out (breaking), finishing etc.,. These processes are at various locations spread across the plant.
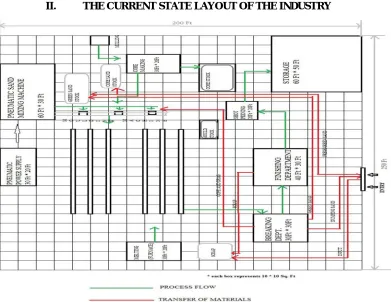
II. THE CURRENT STATE LAYOUT OF THE INDUSTRY
Fig 1 The above figure shows the existing layout of the industry. (Each box represents 102 feet)
For VSM the data is taken as follows: Working shift per day = 2
No. of hours per shift = 8 hours
Available time per shift = 8*60 = 480 minutes Available time per day = 480*2 = 960 minutes Production capacity per day = 270 units
Takt time = available time per day/ production capacity per day = 960/270 = 3.5 minutes In the same way uptime for individual processes can be done,
Uptime % = value added time/ availability * 100
The following table for various operations is obtained, using the time taken from the data collected [3], [4].
TABLE I
Process Values for Individual Workstations Melting Mold
Making
Sand Mixing
Core Making
Pouring Cooling Breaking Finishing
Cycle Time (minutes)
55 45 40 40 10 40 30 40
No. of operators
4 6 1 3 3 0 2 3
Change over time(minutes)
5 15 10 10 5 0 10 10
Available time/day (minutes)
960 960 960 960 960 960 960 960
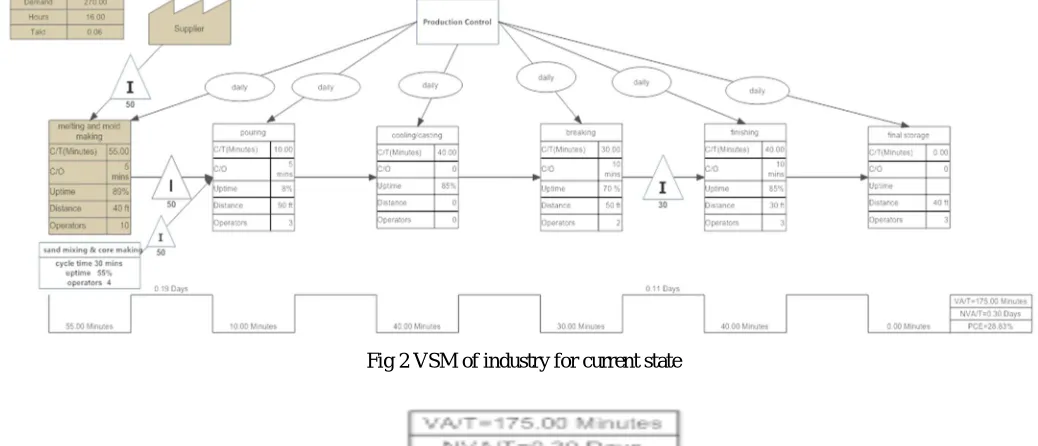
[image:2.612.70.582.570.744.2]These values are taken into account and various blocking of the materials at various places and the waiting time are all considered to produce the value stream mapping of the current state of the industry.
Fig 2 VSM of industry for current state
Fig 3 Process Cycle Efficiency of the first model
After value stream mapping it is seen that the process cycle efficiency is 28.83%, and a large non-value added time of 0.30 days, which does not indicate for a good manufacturing process. From the VSM it can be seen that there is an unwanted inventory waiting time which is a major cause for increase in non-value added time. In the process flow there is a waiting time of 50 minutes between mold making and pouring, and 30 minutes between breaking and finishing.
III. PROBLEM STATEMENT
A. Blockage of molds
Blockage of molds is seen for about 50mins before the molten metal is poured into them. The cause for the blockage of material before pouring is because the industry has fully Automated Arpa 450 Molding Line 3 in number which can produce approximately 45 moulds / 50mins. The furnace capacity is 1 ton, and tapping process was carried out manually. The process of tapping is to pour the molten metal from the furnace into the ladle. During this process, due to heavy load, the furnace was charged only to half of its capacity for easy pouring by the workers. This led to insufficient pouring quantity for every 50mins i.e. approximately 15 to 20 moulds are filled every hour, but the moulds produced are 45 in the same time. So there is a time lag of nearly 50mins for about 25 moulds, which creates a blockage before pouring which is represented in the VSM. After shaking out the product from the sand mould a batch of 30 to 35 products were sent for finishing (here shot blasting) department. Due to insufficient products produced in the duration of time, blockage of unfinished products is generated before finishing department for about 30mins waiting for some more products to fulfill the required batch quantity.
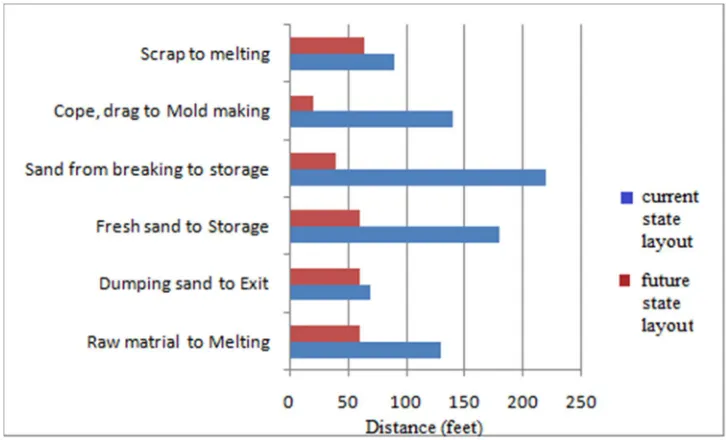
B. Large distances from department to department
It is also seen from the above plant layout that the distance between each workstation is very large. For example the major continuous transports that should to take place from department to department are
Raw material to melting department from entry/exit – 130 ft Old or dumping sand to entry/exit – 70 ft
Fresh sand from entry/ exit to sand storage – 180 ft
Reusable sand from breaking department to sand storage – 220ft
IV. FEASIBLE SOLUTIONS TO THE ABOVE PROBLEMS
A. Automating the furnace
[image:4.612.188.445.239.342.2]As said above, the pouring should be made in large quantities to avoid mold stacking. This can only achieved by automating the process of pouring using low cast microcontroller, a power jack with a motor and a temperature sensor like infrared thermometer. The microcontroller used here is Arduino Uno [8] this should be programmed in such a way that when the required temperature is obtained in the furnace during melting of the charge, the infrared sensor senses the temperature, when the required temperature is obtained it sends an analog output which is an input to the microcontroller. Now the microcontroller must actuate the motor which in turn actuates the jack to lift the furnace up. In this way human effort is eliminated and pouring quantity increases. Thus instead of 20 moulds approximately 40 moulds are filled at the same time to avoid their blockage. By automating the procedure of pouring, not only quantity of the pouring increases but also the hazards caused to the workers may be reduced. The hazards are the smoke emitted by the molten metal which is harmful for inhalation and spillage of the molten metal may take place, which causes injury to the workers
Fig 4 A diagrammatic representation of the micro controller Arduino board (blue colored) connected to a stepper motor (Fritzing software)
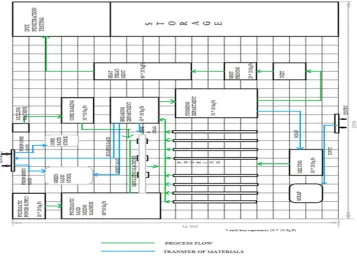
B. Changing the layout
In the plant there are large distances to be travelled and can be reduced by providing and extra entry/ exit and arranging the plant such that the breaking department is closer to the sand storage area and finishing department closer to the melting department. The reduction in distances also helps in reducing the change over time. This change over time may not seem valuable but is necessary. Hence the layout can be modified as follows
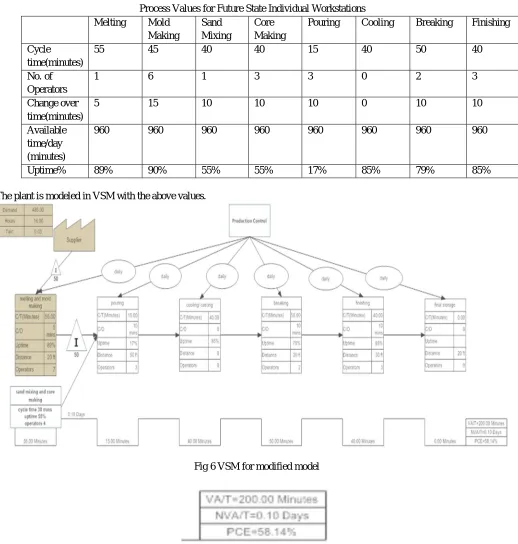
[image:4.612.132.489.457.714.2]After the changes suggested above, the throughput can be increased to 470 units per day. The process values for various workstations are taken as
TABLE II
Process Values for Future State Individual Workstations Melting Mold
Making
Sand Mixing
Core Making
Pouring Cooling Breaking Finishing
Cycle time(minutes)
55 45 40 40 15 40 50 40
No. of Operators
1 6 1 3 3 0 2 3
Change over time(minutes)
5 15 10 10 10 0 10 10
Available time/day (minutes)
960 960 960 960 960 960 960 960
Uptime% 89% 90% 55% 55% 17% 85% 79% 85%
The plant is modeled in VSM with the above values.
Fig 6 VSM for modified model
Fig 7 Process Cycle Efficiency for the modified plant
The distances to be covered during the movement of material from one department to other are considerably reduced, which helps in reduction of change over time and hence the cycle time.
Fig 8 Decrement in the distances to be travelled
V. CONCLUSION
Value Stream Mapping is an effective tool for understanding the flow of the materials in the industry and its efficiency. VSM also helps in effectively finding out the bottlenecks in the ongoing process flow. By automating the furnace, to reduce human effort and increase the pouring quantity from the furnace available in every 50 minutes, it is observed that the stacking of the molds, a major bottleneck has been reduced and by changing the layout of the industry the distances that are to be travelled between each workstation has been reduced considerably, which helps in increase in productivity. From all the above changes made the takt time is reduced and also the process cycle efficiency is increased considerably.
REFERENCES
[1] Kalpak Jain, Adisson Wesley, 1995, Manufacturing Engineering and Technology
[2] Mikel. P. Groover, Pearson Education, Automation, Production Systems and Computer Integrated Manufacturing, fourth edition [3] Process planning through value stream mapping in foundry, V. R. Murugananthan, et al, IJIRSET, volume 3, issue 3, pp. 1140-1143. 2014 [4] Productivity Improvement by Value Stream Mapping in Die Casting Industry. S. N. Teli et Al, Jetir volume 2 issue 6 pp. 2049-2064, 2015
[5] Muhammad Abdus Samad et.Al, Value Stream Mapping To Reduce Manufacturing Lead Time In A Semi-Automated Factory, Asian Transactions On Engineering, Vol.2 Issue 06, pp. 22-28, (2013).
[6] Application of Value Stream Mapping Tools For Process Improvement a Case Study in Foundry, Girish.C.Pude, et al iosrjournals