Abstract—Detection attack tools have a very wide range of solutions, from the applications of rules obtained by experience to the use of machine learning techniques, including multiple bioinspired methods. In order to analyze the results of research methods for attack detection, the DARPA KDD data set have been widely used but their data are outdated for various kinds of attacks. A software called Spleen designed to get data from a tested network with the same structure of DARPA data set is introduced. The application is used to complete the data set with additional features according to an attack analysis. In order to show advantages of an extended data set, two genetic methods in the detection of non-content based attacks are tested.
Index Terms— Adaptative Algorithm, Genetic Algorithms, Information Security, Intrusion Detection, KDD, Machine Learning TCPIP.
I. INTRODUCTION
SINCE the beginning of information transmission by means of computer network resources, the security threats have been raised with different approaches, being the most used the Intrusion Detection Systems –IDS [1]. The attacks have been detected with rules obtained by experience or with the use of machine learning algorithms according to data sets acquired from networking scenarios with normal traffic and with injected attacks to the same scenario [2-8]. The most widely used data set is DARPA data set developed by MIT [9,10] with a complete feature collection of attacks, unfortunately some authors have shown weaknesses on the data set either in the lack of important features for detecting some attacks as well as their outdated information [11,12].
In order to improve detection results, a new set of features have been proposed by some author, with a tool called TSTAT [13]. In the same way, it is possible to find tools supplied by MIT such as LARIAT. The tool simulates traffic generation and allows the aggregations of host and services
This work was supported in part by Military University Nueva Granada Grant ING831, the “young researchers program” and the Doctoral Program granted to E.G. author.
E. Guillen is with the Military University Nueva Granada, Cra 11 No. 101-80, Bogota, Colombia (e-mail: [email protected]).
J. Rodriguez, is with the Military University Nueva Granada, Cra 11 No. 101-80 Bogota, Colombia (e-mail: [email protected]).
R. Paez, is with the Pontifical Javeriana University, Bogota, Colombia (e-mail: [email protected]).
A. Rodriguez, is with the Pontifical Javeriana University, Bogota, Colombia (e-mail: [email protected])
with the programmed deploy of attacks [14].
This paper shows a software to obtain DARPA compatible features and the possibility of getting additional information in order to construct an updated data set with multiple networking scenarios.
With the obtained information, two genetic methods to detect non-content based attacks will be shown in order to analyze the results not only in a simulation scenario but also in the real world. The obtained results enforce the idea of making hybrid detection systems, according to the characteristics of identified groups of attacks.
In the part II, the database will be explained, as well as a brief introduction to spleen software which was used to obtain DARPA features with new variables.
A rules-based Genetic Algorithm –GA attack detection approach will be shown in part III. The weight-based genetic algorithm attack detection is analyzed in part IV to finally show the results in part V and discuss some conclusions at the end of the paper.
II. DATA BASE FOR ATTACK ANALYSIS
In 1998 a well-known data set for intrusion detection evaluation was developed by the DARPA Intrusion Detection Evaluation Group at MIT Lincoln Laboratory. The data set is composed by 41 statistical, behavioral and status variables collected from network scenarios in presence of diverse attack types [9,10]. Although the collection of data was finished more than 10 years ago, the data handling standard is useful for analyze new approaches using Machine Learning or Computational Intelligence in order to find or evaluate intrusion detection methods [15]. However, the DARPA data set not only has the outdated problem but also their variables have shown not to be completed for trustable analysis purposes [11, 12]. In order to achieve better results and taking advantage of the MIT previous work, it was developed a software to obtain the results from DARPA data set plus additional variables including PDU content analysis according to the attack to be studied. The software is called Spleen and it is available under request at gissic.umng.edu.co website.
A. Intrusion Detection database description
Samples from DARPA, used for the training and testing process, are composed by two main components, the first one is a collection of features which describes the event and the
Detection of Non-Content Based Attacks Using
GA with Extended KDD Features
second one is a class, which informs the type of the event, that is, if it is a normal or an abnormal behavior, all these samples are organized in a CSV file.
Descriptive features of a recorded event can be classified in three groups: discrete, continuous percentage and continuous count features.
B. Spleen Data Set Extractor Software
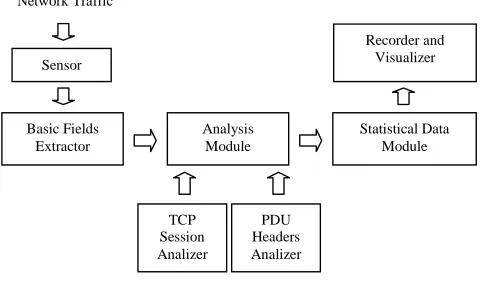
Spleen software is able to collect information from a network interface and gather them with the DARPA data set architecture. The features could be completed with additional information adaptable to the research requirements. Details about possible variables in spleen are not the subject of this paper but some of them are going to be used for detection purposes, they will be explained in section II D.
The diagram of spleen modules is shown in Fig. 1.
Sensor
Basic Fields Extractor
Analysis Module
TCP Session Analizer
PDU Headers Analizer
Statistical Data Module Recorder and
Visualizer Network Traffic
Fig 1. Diagram of Spleen modules C. Non- Content based Attacks
In some attacks, information above to layer 4th is sending, in order to take advantage of an application vulnerability, so the payload length of layer fourth is different to zero. These kinds of attacks are usually called “content based attacks”[16].
In the other hand, there are some attacks which do not need to send information to the session layer or above, it means that the payload of a possible fourth layer packet is empty; these attacks will be called non-content based attacks and over them a genetic algorithm detection will be shown in order to probe advantages of additional features captured with Spleen
software.
D. Variables Selection and Filtering
New database with the initial data architecture of the DARPA data set is created, and it is completed with some more features in the presence of different attacks with a lab network scenario similar to the one used by MIT[9,10].
In addition with the feature types presented in the original dataset –KDD99–, a new type of feature is obtained with
Spleen. The new feature type is called Change Behavior Detector –CBD and it is obtained as follows: during a slot of time the events which match some conditions are counted; the process is made again in the next slot of time and its results
are compared with previous value in last time period. The CBD feature is the difference between the counted events in actual period and in the last time period. It is able to detect abrupt changes in the network traffic behavior.
From the available set, it is necessary to establish the most significant variables in the detection of intrusive events according to the explained focus. The decision tree CHAID was used over the obtained data as the first feature filter [17]. From the 41 obtainable variables, 13 are content based features, it means that such data are not necessary to detect non-content based attacks, i.e. [18] presents a feature relevance analysis over DARPA set to detect attacks and it can be seen that the most important feature in non-content based attacks detection is the status flag of the connection, that is the 4th
feature in the data set. The most important possible states of status flag are shown in Table I [19,20].
TABLEI.
STATUS FLAG OF THE CONNECTION
State Meaning SF Normal SYN/FIN completion
REJ Connection rejected, Initial SYN elicited a RST in reply S0 State 0: initial SYN seen but no reply
S1 State 1: connection established (SYN's exchanged), nothing further seen
S2 State 2: connection established, initiator has closed their side S3 State 3: connection established, responder has closed their side RSTO Connection reset by the originator
RSTR Connection reset by the responder OTH Other, a state not contemplated here.
Another current event to be taken into account is the number of bytes sent to a layer upper than 4th by the originator of the connection –the client, making a two states discretization, when the sent bytes are less than 50B and when the sent bytes are more than 50B, because a non-content based attack is characterized by sending few information.
Historical events can help in the detection process because some attacks usually take various steps to be successful. By analyzing the steps, it is possible to know that something is wrong in the network traffic, for example in a portsweep attack, it is possible to find requests made to a not offered service, causing a REJ state connection; this fact by itself does not necessary mean that a portsweep attack is present, instead, it could be possible that someone is trying to get information about the services offered in the network.
Due to the nature of non-content based attacks, the characteristics 4, 25, 26, 27, 28, 29, 34, 39, 40 and 41 were selected to perform the classification [18, 21]. The descriptions of each feature can be found in [10] and [18]. As it can be seen, most of the selected features are refereed to statistical information about the TCP connection states.
In order to complete the DARPA data set and by means of statistical analysis, the database was completed using spleen
software with the variables illustrated in table II.
III. RULES BASED GENETIC ALGORITHM ATTACK DETECTION
[image:2.612.50.290.263.410.2]focus in headers and behavior from layers third and fourth according to the features explained before. Rules based detection system has the characteristics explained by Holland [23,24].
TABLEII.
SOME ADDITIONAL FEATURES FROM SPLEEN SOFTWARE
A. Knowledge Representation
Each line in the data base is represented as follows.
{
v
v
v
n}
S
=
1,
2,...,
With n number of variables.
Each feature could be represented only by three stages:
Dontcare
v
n⎪
⎩
⎪
⎨
⎧
#
1
0
:
If there is any continuous feature, they are always normalized between 0 and 1, and they are digitalized according to a variability analysis. In that way, vn could
contain more than one bit
The rules has the {if v1 and v2 and vn then class} structure.
The class only has two possible stages “1” or “0” meaning that exists or not an attack. Although the database makes distinction between different attacks such as Teardrope, DoS, Portsweep and so on, all non-content based attacks were merged with just one class.
At the end of each vector, a class of attack or not attack is putting according to database.
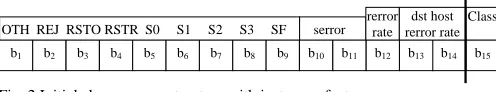
B. The Chromosome
The chromosome has the following structure (Fig. 2)
b14 b1 b2 b3 b4 b5 b6 b7 b8 b9 b10 b11 b12 b13 b15 OTH REJ RSTO RSTR S0 S1 S2 S3 SF serror
dst host rerror rate rerror
rate
[image:3.612.45.302.100.462.2]Class
Fig. 2 Initial chromosome structure with just some features
Although the final structure is composed by some more features according to table II, a chromosome with classical KDD features was implemented in order to compare GA results with additional features obtained with spleen.
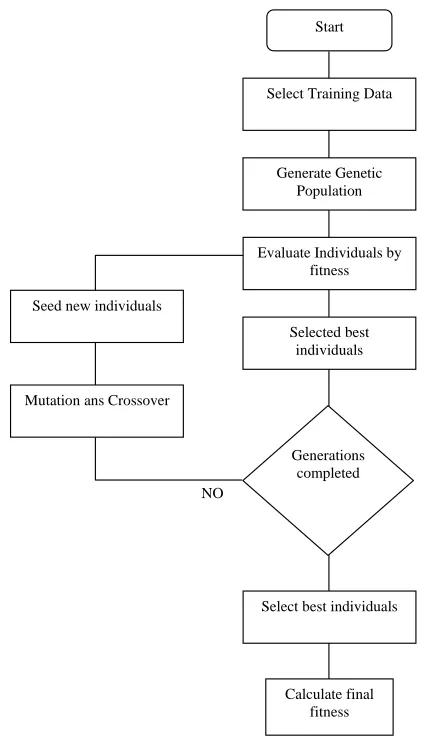
C. The Algorithm
The developed approach can be seen in the Fig. 3. The fitness function is a measure of effectiveness according to a comparison between each rule and the training data.
A classical mutation operator is used to create a new element based on parents by making a little change in some of its characteristics. To perform this task two parameters are important, the first one is the mutation probability, which defines the probability that any of the characteristics could change in new individuals, if it is the case, the second parameter, “deep mutation” defines how many characteristics could change.
The complete database is composed by 150.500 lines. The training data has 4.000 individuals and the validation data was probed with 2.000 individuals randomly selected from the main database. When the best rules were selected, they were tested in an IDS with real time traffic in an attacked network with ethical hacking techniques.
IV. WEIGHT BASED GENETIC ALGORITHM ATTACK
DETECTION
Several features assume special values in presence of some normal or abnormal behaviors; the goal of this approach is to use these values to classify an event. Each feature is going to have an influence level according to its behavior when the event corresponds to a selected class. If the feature takes high values in the events which belong to a selected class, then its influence level is going to be high. Each feature of the event will contribute with a numerical value according to the product of its current value and its influence level. If the sum of all the contributions is bigger than a threshold, then the event is going to be classified as the indicated class. It is important to know that the influence levels can be positive or negative.
Most of the features refer to historical data; however their influence level depends on the current event, for that reason the influence level of each feature will be related with some current condition. Since the most significant feature that represents the current event is the status flag, all features influence levels will have a bonus when this flag is active.
Basic Features
ID Name Type Description
42 Unusual TCP flags Boolean True if this connection had received packets with unusual TCP flags configurations. 43 Out of sequence
packets
Int The number of packets of this connection that not arrived on time.
44 Payload Size
average
Int The size average of the payload length of the packets of this connection, including the retransmissions.
Host Traffic Features (with last 255 connections)
45 Client count Int The number of connections from this client.
46 Not completed client rate
Double % of connections from this client with the states S0 or S1 47 Same host and
service
Double % of connections from this client that have the same host and service.
48 Persistent connection rate
Double % of connections to the current host which were not answered and other attempt to establish them was made.
Behavior Changes Detector (difference between two periods)
49 Host rejected
difference
Int # of connections rejected by the current host.
50 Service rejected difference
Int # of connections to this service that was rejected
51 Unanswered host count
Int # of connections no answered by this host
52 Unanswered service count
[image:3.612.314.562.113.159.2]Start
Generate Genetic Population Select Training Data
Evaluate Individuals by fitness
Selected best individuals
Generations completed Mutation ans Crossover
Seed new individuals
Select best individuals
[image:4.612.66.277.46.416.2]Calculate final fitness NO
Fig. 3 Rules based genetic algorithm
A. Knowledge Representation
The goal of this genetic algorithm –GA is to find the correct influence level for each feature and to establish what value of status flag is going to give the bonus condition to each feature. With that bonus value is wanted to establish how much the influence level of a feature is going to be incremented in the presence of its bonus status flag, this value is going to be called the bonus value and it is set to 50% in order to make a significant difference when the bonus status flag is present.
TABLE III.
POSSIBLE BONUS STATUS FLAGS
Bonus state Meaning Bonus State Meaning
0000 SF 1000 OTH
0001 S3 1001 S0 or S1
0010 S2 1010 RST events
0011 S1 1011 No S0 or S1
0100 S0 1100 No RST events
0101 RSTO 1101 No SF
0110 RSTR 1110 None
0111 REJ 1111 Any
Each influence level is going to be an integer value from -7 to 8 which is going to be represented by 4 bits. The status flag
which gives the bonus condition is represented by 4 bits assuming the values shown in Table III.
Another important component of the GA is the threshold value; it is initially set to the number of selected features for the evaluation, allowing each feature has a relevant role in the detection.
B. The Chromosome
Each one of selected features, except the status flag of the connection, corresponds to a gene and it is composed by two fields: influence level (Weight) and bonus status flag (Bonus). The threshold value is the same for all the individuals in order to reduce the GA search space. Chromosome structure for this approach is shown in figure 4.
Chromosome
Gene 0 ... Gene (n-1) threshold
Weight Bonus Weight Bonus
[image:4.612.314.567.231.298.2]b b b b b b b b b b b b b b b b b Int
Fig 4. Chromosome Structure for weight based GA
C. The Algorithm
The Weight based GA algorithm is similar to the rules based GA, (Fig 3) the main difference is the way the events are evaluated for classification. With the chromosome structure of Fig 4, the weighted sum is evaluated with the equation 1. The result is then compared with the threshold value. If the threshold is exceeded then the event is labeled according to the class that is wanted to be detected.
(
+
BFS
BP
)
W
f
=
a
i in
= i
i
∗
∗
∗
∑
−1
1
0
(1) Where n is the number of selected characteristics, f is the feature value obtained from the training data element, W is the assigned weight to the feature, BFS is the status of the bonus flag assigned for that characteristic “1” or “0”, and BP is the bonus value, (BP is the same for all features and elements) Note that the term in parentheses is 1 when the bonus condition –BFS-is 0.
V. RESULTS
The algorithm was tested with an initial population P of 50 individuals and with 20 generations g. The number of generations and population were tested with different values in order to obtain the best value with the minimal computational cost.
Examples of the best obtained rules with the first 14 bits and the class bit with the fitness value F in the training and test stages can be seen in Figure 5.
Chromosomes F train F test # # 0 # 0 0 0 0 0 0 0 # # # 1 0,91572 0,97974 # # # # 0 0 0 0 # 0 0 1 # # 1 0,91069 0,99263 0 # # # # # # 0 # # 0 1 # # 1 0,91069 1
Fig. 5. Example of best rules with some features and the fitness results in training and test process
[image:4.612.59.290.557.695.2]approaches were trained. Every non-content based attack was labeled in just one class. Table IV shows the results of weight based GA with just Darpa data set.
TABLE IV
RESULTS OF WEIGHT BASED GA ONLY WITH DARPA
Figure of merit Training phase Testing Phase
True positives 0.98122 0.9788 True Negatives 0.99643 0.98620 False positives 0.00356 0.01379 False Negatives 0.01877 0.02111
Fitness 0.98986 0.97985
With the same data set but with the additional features the results in Table V were obtained.
TABLE V
RESULTS OF WEIGHT BASED GA WITH THE ADDITIONAL DATA
Figure of merit Training phase Testing Phase
True positives 0.99530 0.98204
True Negatives 1.0 1.0
False positives 0.0 0.0
False Negatives 0.00469 0.01795
Fitness 0.99797 0.98443
Obtained results were made with next GA parameters: Population of 120, 15% of mutation probability and a deep of 2.
The same process was performed with the rules based GA, and results appears in Tables VI and VII.
TABLE VI
RESULTS OF RULE BASED GAUSING DARPA FEATURES.
Figure of merit Training phase Testing Phase
True positives 0.9788 0.97465 True Negatives 0.99643 0.97241 False positives 0.00356 0.02534 False Negatives 0.02112 0.02758
Fitness 0.98885 0.97435 TABLE VII
RESULTS OF RULE BASED GA USING THE ADITIONAL DATA
Figure of merit Training phase Testing Phase
True positives 0.99530 0.99310
True Negatives 1.0 1.0
False positives 0.0 0.0
False Negatives 0.00469 0.00689
Fitness 0.99797 0.999084
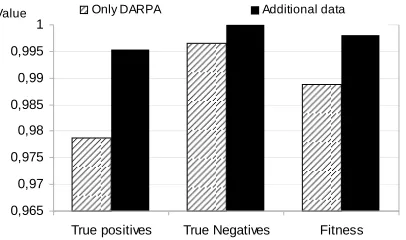
In figure 6, it is shown a comparison of results with GA weight based approach with KDD and with proposed additional features. On the other hand the figure 7 shows the results obtained by the rule based GA approach.
0,97 0,975 0,98 0,985 0,99 0,995 1
True positives True Negatives Fitness
Va
lu
e
[image:5.612.338.541.57.177.2]Only Darpa Additional Features
Fig 6. Comparison of results with GA weight based approach with KDD99 classical features and with proposed additional features.
0,965 0,97 0,975 0,98 0,985 0,99 0,995 1
True positives True Negatives Fitness
Value Only DARPA Additional data
Fig 7. Comparison of results with GA rules based approach with KDD99 classical features and with the addition of proposed features.
VI. CONCLUSIONS
Spleen provides the possibility to change the way the features are obtained, for example extending the time window or the number of considered connections in statistical measurements. It represents a bigger range of possibilities for research purposes.
The definition of “normal traffic” can differ from network to network; Spleen allows the construction of particular datasets which describe the behavior of tested networks. It makes easier the work of IDS schemes to detect abnormal activity.
Future studies about intrusions behavior could possibly give information about what data are useful for their detection, then modifications to Spleen and machine learning algorithms can be made in order to improve detection results.
The new type of feature –change behavior detector- provides a way to detect abrupt changes on network traffic, but it must be implemented carefully according to network traffic distribution. The most important parameter to the change behavior detector variables is the observation time, the longer this period, the more descriptive the measure.
Since intrusions get more sophisticated day after day,
spleen software could be used to getting new features in order to detect attacks, but it is still necessary to construct a new complete database each time a feature is discovered, that is why it is important to construct a very large data set with as many variables as possible continuously updated.
ACKNOWLEDGMENT
E. Guillen. Author thanks to Military University for the labs used in getting the feature information with GISSIC investigation group.
REFERENCES
[1] Garuba, M.; Chunmei Liu; Fraites, D.; "Intrusion Techniques: Comparative Study of Network Intrusion Detection Systems,"
Information Technology: New Generations, 2008. ITNG 2008. Fifth International Conference on , vol., no., pp.592-598, 7-9 April 2008 doi: 10.1109/ITNG.2008.231
[image:5.612.67.276.346.489.2] [image:5.612.55.292.543.695.2]In Computational Intelligence and Security, 2006 International Conference on, volume 1, pages 282 –285, nov. 2006.
[3] J. Shun and H.A. Malki. Network intrusion detection system using neural networks. In Natural Computation, 2008. ICNC ’08. Fourth International Conference on, volume 5, pages 242 –246, oct. 2008. [4] S. Devaraju and S. Ramakrishnan. Performance analysis of intrusion
detection system using various neural network classifiers. In Recent Trends in Information Technology (ICRTIT), 2011 International Conference on, pages 1033 –1038, june 2011.
[5] A. Momenzadeh, H.H.S. Javadi, and M.A. Dezfouli. Design an efficient system for intrusion detection via evolutionary fuzzy system. In Computer Modelling and Simulation, 2009. UKSIM’09. 11th International Conference on, pages 89 –94, march 2009.
[6] Dong Seong Kim, Ha-Nam Nguyen, and Jong Sou Park. Genetic algorithm to improve svm based network intrusion detection system. In Advanced Information Networking and Applications, 2005. AINA 2005. 19th International Conference on, volume 2, pages 155 – 158 vol.2, march 2005.
[7] A. Ahmed, A. Lisitsa, and C. Dixon. A misuse-based network intrusion detection system using temporal logic and stream processing. In Network and System Security (NSS), 2011 5th International Conference on, pages 1 –8, sept. 2011.
[8] Eugene H. Spafford Sandeep Kumar. A pattern matching model for misuse intrusion detection. Department of computer science.
[9] MIT Lincoln Laboratory. Darpa intrusion detection data sets, 1999. [10] Isaac Graf Joshua W. Haines Kristopher R. Kendall David McClung
Dan Weber Seth E. Webster Dan Wyschogrod Robert K. Cunningham Richard P. Lippmann, David J. Fried and Marc A. Zissman. Evaluating intrusion detection systems: The 1998 darpa off-line intrusion detection evaluation. Lincoln Laboratory MIT, 244 Wood Street, Lexington, MA 02173-9108, page 15, 1999.
[11] Maheshkumar Sabhnani and Gursel Serpen. Why machine learning algorithms fail in misuse detection on kdd intrusion detection data set. The University of Toledo.
[12] A.R. Vasudevan, E. Harshini, and S. Selvakumar. Ssenet-2011: A network intrusion detection system dataset and its comparison with kdd cup 99 dataset. In Internet (AH-ICI), 2011 Second Asian Himalayas International Conference on, pages 1 –5, nov. 2011.
[13] Maurizio Matteo Munafo Marco Mellia. Tstat measures. tcp statistics an analysis tool, 2008.
[14] J.W. Haines, L.M. Rossey, R.P. Lippmann, and R.K. Cunningham. Extending the darpa off-line intrusion detection evaluations. In DARPA Information Survivability Conference Exposition II, 2001. DISCEX’01. Proceedings, volume 1, pages 35 –45 vol.1, 2001
[15] B. Abdullah, I. Abd-alghafar, Gouda I. Salama and A. Abd-alhafez, “Performance evaluation of a Genetic Algorithm Based Approach to Network Intrusion Detection System”. 13 internacional conference on Aerospace Sciences & Aviation Technology, Military Technical College, Kobry Elkobbah, Cairo, Egypt,2009.,
[16] Pasupulati, A.;Coit, j.; Levitt, K; Wu, S.F.; Li, S.H.;Kuo, J.C.; Fan, KP.; "Buttercup: on network-based detection of polymorphic buffer overflow vulnerabilities," Network Operations and Management Symposium, 2004. NOMS 2004. IEEE/IFIP , vol.1, no., pp.235-248 Vol.1, 23-23 April 2004.
[17] Fowdar, J.; Crockett, K.; Bandar, Z.; O'Shea, J.; , "On the Use of Fuzzy Trees for Solving Classification Problems with Numeric Outcomes," Fuzzy Systems, 2005. FUZZ '05. The 14th IEEE International Conference on , vol., no., pp.436, 25-25 May 2005
[18] H. Günes Kayacik, A. Nur Zincir-Heywood, Malcom I. Heywood. “Selecting features for intrusion detection: A feature Relevance Analysis on KDD 99 intrusion Detection Datasets”. Dalhousie University, Faculty of Computer Science, 6050 University Avenue, Halifax, Nova Scotia. 2006
[19] Information Sciences Institute University of Southern California. Rfc 793. transmission control protocol. Defense Advanced Research Projects Agency, 1981.
[20] E. Hernández-Pereira, J.A. Suárez-Romero, O. Fontenla-Romero, and A. Alonso-Betanzos. Conversion methods for symbolic features: A comparison applied to an intrusion detection problem. Expert Systems with Applications, 36(7):10612 – 10617, 2009
[21] Nmap. Port scanning techniques:nmap reference guide, May 2012.
[22] Tenable Network Security group. (2012). Nessus Documentation . Available: http://www.tenable.com/products/nessus/documentation [23] Holland J. “Adaptation in natural and artificial. Ann arbor” The
University of Michigan Press; 1975.
[24] John H. Holland, et al. 2000. What Is a Learning Classifier System?. In