A Unique Approach for Detection of Fake News
using Machine Learning
Yash Shukla1, Nalini Yadav2, Akshaya Hari3 1, 2, 3
Department of Computer Engineering, Dr. D.Y. Patil Institute Of Engineering, Management &Research, Pune
Abstract: Fake news, alternative facts are associated to each other since the time news was transmitted using news papers or radio. The fake news most recently came to light when the US Presidential election was underway. There have been several hoax stories where citizens, governments as well all other social elements are all affected by these stories. Facebook has been the amidst the controversy by the media houses for targeting the audiences and showing them posts to their support. This paper focus on detecting fake news with the help of various python libraries in association with counting features using n-grams and tf-idf . The system will be taking input from the user and then compare them with an existing data-set. We have compared various algorithms to find out the best working model that will fit our project and give a proper prediction for fake news.
Keywords: Comparison of algorithms, Fake News Detection, Machine Learning, News sources.
I. INTRODUCTION
Fake news detection topic has gained a great deal of interest from researchers around the world. There are numerous social science studies have been done on the impact of fake news and how humans react to them. Fake news can be any content that is not truthful and generated to convince its readers to believe in something that is not true.[1]In today’s times there are various social media messaging and share applications that give users the power to share a piece of information with millions of people at the click of the button. The real problem is when people start to accept that rather than any of the news being “fake” theirs might have a new perspective on this. The problem begins where the masses begin to believe the fake news without checking its authenticity. There are very few tools or websites that tell the public about the news and its authenticity
II. LITERATURE SURVEY
Many of existing fake news detection methods massively relies on feature extraction. In [3], [4], [5], [6], [7] authors have proposed approaches that are based on feature extraction. Feature extraction is the transformation of original data to a data set with a reduced number of variables, which contains the most discriminatory information [8] . Here we will discuss the some of the algorithms that will be used in this project:
A. Stochastic Gradient Descent
Stochastic gradient descent (often abbreviated SGD) is an iterative method for optimizing an objective function with suitable smoothness properties (e.g. differentiable or sub-differentiable). It is called stochastic because the method uses randomly selected (or shuffled) samples to evaluate the gradients, hence SGD can be regarded as a stochastic approximation of gradient descent optimization.[9] Stochastic Gradient Descent (SGD) algorithms have been successfully used for the training of neural net-works.[10]
B. Random Forest Classification
Random forest is an algorithm for classification developed by Leo Breiman [11] that uses an ensemble of classification trees [12,13]. Each of the classification trees is built using a bootstrap sample of the data, and at each split the candidate set of variables is a random subset of the variables. Thus, random forest uses both bagging (bootstrap aggregation), a successful approach for combining unstable learners [14, 15], and random variable selection for tree building. Each tree is unpruned (grown fully), so as to obtain low-bias trees; at the same time, bagging and random variable selection result in low correlation of the individual trees. The algorithm yields an ensemble that can achieve both low bias and low variance (from averaging over a large ensemble of low-bias, high-variance but low correlation trees).
C. Support Vector Machine
space, mapped so that the examples of the separate categories are divided by a clear gap that is as wide as possible. New examples are then mapped into that same space and predicted to belong to a category based on which side of the gap they fall. [16]
D. Naive Bayes
The Naive Bayesian classifier is based on Bayes’ theorem with the independence assumptions between predictors. A Naive Bayesian model is easy to build, with no complicated iterative parameter estimation which makes it particularly useful for very large datasets. Despite its simplicity, the Naive Bayesian classifier often does surprisingly well and is widely used because it often outperforms more sophisticated classification methods. Bayes theorem provides a way of calculating the posterior probability, P(c|x), from P(c), P(x), and P(x|c). Naive Bayes classifier assume that the effect of the value of a predictor (x) on a given class (c) is independent of the values of other predictors. This assumption is called class conditional independence[17]
= ( ⁄ ) ( ) ( ) Formula for Naive Bayes
III. PROPOSED SYSTEM
Put in the entire file structure and the system diagram here
At first we start by selecting an data-set that can be used for detecting fake news. We have selected the LIAR data-set that contains 13 columns .We are using the first two columns for our testing phase. The data-set is split into the training and testing for further classification of news. The data-set has the first column as the news headline and the second column as the label class. Then the data is sent for pre-processing like data stemming , tokenizing and checking for null values.
Further we perform extraction and feature selection using python libraries along with algorithms like “simple bag of words” , “n-gram “ and then tf-idf(term frequency–inverse document frequency). We could use POS tagging and word2vec for further extraction of features. Further we build classifiers for predicting fake news . All of the features extracted above are fed into classifiers and then we use sklearn from python to implement ,compare the models that we have selected. The models selected are Naive-Bayes, Logistic Regression, Linear SVM, Stochastic gradient decent and Random forest classifiers. Once we have fitted the models we compare the f1 scores of each model and then check the confusion matrix. The last part would be selecting the final model which would be the best performing in all of the models which in our case would be Logistic Regression as it has the best f1 scores. The following would be the project flow :
IV. EXPERIMENTATION
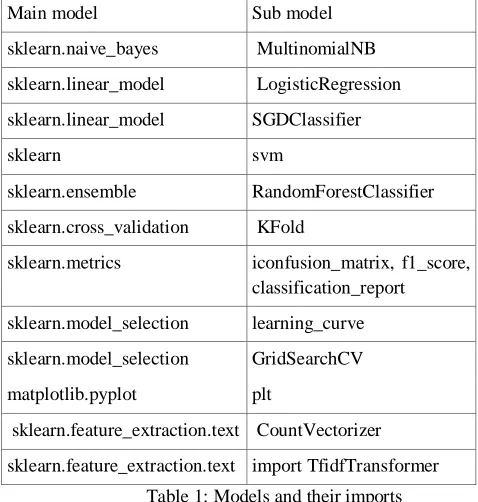
In this project we have used multiple libraries from python for comparing the various confusion matrix of the algorithm that may best fit our model. For this we have used the following python libraries:
Main model Sub model
sklearn.naive_bayes MultinomialNB
sklearn.linear_model LogisticRegression
sklearn.linear_model SGDClassifier
sklearn svm
sklearn.ensemble RandomForestClassifier
sklearn.cross_validation KFold
sklearn.metrics iconfusion_matrix, f1_score, classification_report
sklearn.model_selection learning_curve
sklearn.model_selection GridSearchCV
matplotlib.pyplot plt
sklearn.feature_extraction.text CountVectorizer
[image:3.612.186.425.112.363.2]sklearn.feature_extraction.text import TfidfTransformer
Table 1: Models and their imports
By using these libraries we are able to calculate two kinds of scores for every algorithm . One of the scores is the confusion matrix which gives us insight into the performance of a classification model. Confusion matrix is a performance measurement for machine learning classification problem where output can be two or more classes. It is a table with 4 different combinations of predicted and actual values. [18]
Actual values
True Positive
False Positive
False Negative
True Negative
Confusion Matrix
A. Bag of Words Confusion Matrix 1) Naive Bayes
# [2118 2370] # [1664 4088]
2) Logistic regression # [2252 2236]
# [1933 3819]
3) Support Vector Machine # [2260 2228]
# [2246 3506]
4) Stochastic Gradient Descent classifier # [2414 2074]
# [2042 3710]
5) Random Forest classifier # [1821 2667]
B. N-grams & tf-idf(term Frequency–Inverse Document frequency) Confusion Matrix 1) Naive Bayes
# [841 3647] # [427 5325]
2) Logistic regression # [1617 2871]
# [1097 4655]
3) Support Vector Machine # [2016 2472]
# [1524 4228]
4) Stochastic Gradient Descent classifier # [ 10 4478]
# [ 13 5739]
5) Random Forest classifier # [1979 2509]
# [1630 4122]
C. ROC Curve
When we need to check or visualize the performance of the multi - class classification problem, we use AUC (Area Under The Curve) ROC (Receiver Operating Characteristics) curve. It is one of the most important evaluation metrics for checking any classification model’s performance. It is also written as AUROC (Area Under the Receiver Operating Characteristics)
AUC - ROC curve is a performance measurement for classification problem at various thresholds settings. ROC is a probability curve and AUC represents degree or measure of separability. It tells how much model is capable of distinguishing between classes.
Higher the AUC, better the model is at predicting 0s as 0s and 1s as 1s. By analogy, Higher the AUC, better the model is at distinguishing between news which is fake and true.It is a plot of the true positive rate against the false positive rate for the different possible cutpoints of a diagnostic test.
The ROC curve is plotted with True Positive Rate against the False Positive Rate where True Positive Rate is on y-axis and False Positive Rate is on the x-axis.[19]
ROC curve for random forest ROC curve for Logistic Regression
We can see by plotting the learning curve for logistic regression, it can be seen that cross-validation score is stagnating throughout and it
V. RESULTS
The second score that is calculated is the F1 score.F1 is an overall measure of a model’s accuracy that combines precision and recall, in that weird way that addition and multiplication just mix two ingredients to make a separate dish altogether. That is, a good F1 score means that you have low false positives and low false negatives, so you’re correctly identifying real threats and you are not disturbed by false alarms. An F1 score is considered perfect when it’s 1, while the model is a total failure when it’s 0.[20]
Formula for calculating F1 scores
1 = 2∗ ∗
+ Formula for calculating F1 score
Algorithm Used F1 scores
Naive Bayes 0.669611539651
Logistic Regression 0.646909097798
SVM 0.610468748792
Sgd classifier 0.640874558778
[image:5.612.189.426.341.455.2]Random Forest Classifier 0.702651511011
Table 2: Bag of Words F1 scores calculated for
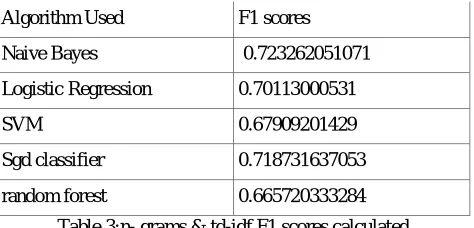
Algorithm Used F1 scores
Naive Bayes 0.723262051071
Logistic Regression 0.70113000531
SVM 0.67909201429
Sgd classifier 0.718731637053
random forest 0.665720333284
Table 3:n- grams & td-idf F1 scores calculated
We have only selected two columns or features that have to used for our model. This stagnates the process of finding out fake news. We can overcome this by taking help of more features,which will be the future implementation of this project.
VI. CONCLUSION
The paper has shown the implementation of five algorithms in accordance with n-grams and tf-idf for the purpose of finding fake news. By doing the above experiment and coding all of the classifiers we have found out that random forest with n-grams along with logistic regression with n-grams has a similar performance measure. We can validate this with the numbers of F1 scores and the confusion matrix’s that we have generated for each model. We have selected the the logistic regression with n -grams model. We save this model and use it for prediction
REFERENCES
[1] Media-Rich Fake News Detection: A Survey Shivam B. Parikh and Pradeep K. Atrey Albany Lab for Privacy and Security, College of Engineering and Applied Sciences University at Albany, State University of New York, Albany,NY,USA Email:{sparikh, patrey}@albany.edu
[2] have to write intro
[3] V. L. Rubin, N. J. Conroy, and Y. Chen, “Towards news veri-fication: Deception detection methods for news discourse,” in Hawaii International Conference on System Sciences, 2015.
[4] Y. Chen, N. J. Conroy, and V. L. Rubin, “Misleading online content: Recognizing clickbait as false news,” in Proceedingsof the 2015 ACM on Workshop on Multimodal Deception Detection, pp. 15–19.
[5] B. Markines, C. Cattuto, and F. Menczer, “Social spam detection,” in Proceedings of the 5th International Workshop on Adversarial Information Retrieval on the Web. ACM, 2009, pp. 41–48.
[7] K. Shu, A. Sliva, S. Wang, J. Tang, and H. Liu, “Fake news detection on social media: A data mining perspective,” ACM SIGKDD Explorations Newsletter, vol. 19, no. 1, pp. 22–36,2017.
[8] Anke Meyer-Baese, Volker Schmid, in Pattern Recognition and Signal Analysis in Medical Imaging (Second Edition), 2014
[9] Mei, Song (2018). "A mean field view of the landscape of two-layer neural networks". Proceedings of the National Academy of Sciences.115(33):E7665– E7671. doi:10.1073/pnas.1806579115. PMC 6099898. PMID 30054315
[10] [ Y. LeCun, L. Bottou, G. Orr, and K. Muller. Efficient backprop.Neural Networks: Tricks of the trade,LNCS,1524, 1998.] [11] Breiman L: Random forests. Machine Learning 2001, 45: 5–32.View ArticleGoogle Scholar
[12] Breiman L, Friedman J, Olshen R, Stone C: Classification and regression trees. New York: Chapman & Hall; 1984.Google Scholar. [13] Ripley BD: Pattern recognition and neural networks. Cambridge: Cambridge University Press; 1996.View ArticleGoogle Scholar. [14] Hastie T, Tibshirani R, Friedman J: The elements of statistical learning. New York: Springer; 2001.View ArticleGoogle Scholar. [15] Breiman L: Bagging predictors. Machine Learning 1996, 24: 123–140.Google Scholar.
[16] Yujun Yang, Jianping Li, & Yimei Yang. (2015). The research of the fast SVM classifier method. 2015 12th International Computer Conference on Wavelet Active Media Technology and Information Processing (ICCWAMTIP). doi:10.1109/iccwamtip.2015.7493959
[17] An empirical study of the naive Bayes classifier I. Rish]