Abstract—Software fault prediction based on mining of code
and design metrics has been considered by many researchers. Fault detection systems predict faults by using software metrics and data mining techniques. Various classifiers have already been used in this case; however Naïve Bayes classifier is the most commonly used. According to the results of a study performed by Lessman, no significant performance difference could be detected among the top 17 classifiers.
In this paper, we will extend that study by examining the performance of 37 different classifiers in fault detection systems. We will review the results and aim to choose an appropriate classifier (Bagging) which depicts a higher performance and accuracy compared to the others. Finally, we propose a fault detection system with higher performance which manages to decrease the cost of software fault detection simultaneously. We investigate our classifier selection by evaluating the methods on a number of other datasets. Our results indicate that Bagging classifier has the highest performance in fault detection.
Index Terms— Bagging Classifier, Data Mining, Software
Fault Detection, Software Metrics
I. INTRODUCTION
y definition, fault is a structural defect that may eventually lead to deterioration of the systems. Software testing is one of the most critical and costly phases in software development. Defect predictors have been effective secondary tools to help test terms to locate potential defects accurately [1]. Software defect prediction is the task of classifying software modules into fault-prone (fp) and non-fault-prone (nfp) ones by means of metric-based classification [2], [3].
Use of software metrics to predict software faults was initiated by Porter and Selby in 1990 [4], [5]. Since then, there has been an extensive interest on metric based fault prediction [6], [7], [1], [8]. Interestingly, Turhan et al. [8] shows that we can build classifiers based on software metrics from a Turkish refrigerator manufacturer and predict faults in NASA software modules of a space shuttle. It has been shown that defect predictors which employ data
A.A Shahrjooi Haghighi is graduated from Department of computer engineering, Science and Research Branch, Islamic Azad University, Khouzestan, Iran (e-mail: [email protected]).
M. Abbasi Dezfuli is with Department of computer engineering, Science and Research Branch, Islamic Azad University, Khouzestan, Iran (e-mail: [email protected]).
S.M. Fakhrahmad is with Department of computer engineering, Islamic Azad university, Shiraz branch, Iran (e-mail: mfakhrahmad @cse.shirazu.ac.ir).
mining module-based features have over 70% prediction accuracy [9]. In comparison to the 60% detection rate of manual software review (based on a panel in IEEE Metrics 2002) [10] and considering the ability of an expert reviewer who can merely inspect 8 to 20 LOC/minute, it becomes apparent why automatic defect predictors based on design and code attributes are such an active research area.
Catal and Diri [11] performed a research on studies in the field of software defect prediction. They focused on metrics, methods and datasets used in software defect prediction area. According to their studies, the percentage of using public datasets has greatly increased. Moreover, the use of machine learning algorithms has gradually increased since 2005. They have also investigated the statistics related to published articles in this field. According to their research, published articles in the field of software defect prediction started growing from 1990. Most of the publications are from 2000 onwards. Also according to statistics, in over 60% of researches, Method level metrics has been used. In addition, statistical and machine learning methods have the highest use in this area. Menzies et al [12] concluded that using data mining techniques can not lead to more accurate detection systems. The goal should be changed therefore they proposed to enhance training of each detection system for a specific use.
One of the challenges in fault detection systems is the metrics through which faults can be detected. Two kinds of metrics are used in these systems: Code level and Design level metrics. However, obtaining design metrics is challenging (e.g., complexity metrics) and not always straightforward. It requires availability of design phase artifacts and design diagrams such as DFDs, control flow graphs, Formal Description Language (FDL) graphs and UML diagrams. In our previous research [13] we presented a set of metrics with higher accuracy.
During the past decade, several classification systems have been proposed, which perform predictive modeling efforts for detection of modules that are likely to contain faults. The evaluation of such systems has almost been carried out using a set of datasets available from NASA MDP repository [14]. A comparative study like [1] provided a baseline and dataset for this research. Each module is described by a set of code-level and design-level attributes. All discovered faults of the system are also registered in each dataset, together with the number of modules containing the fault.
Based on a set of experiments on NASA MDP datasets, Lessman et al. [15] concluded that there is no statistically significant difference between predictive performances of dissimilar classifier. He made his comparisons among
Applying Mining Schemes to Software Fault
Prediction: A Proposed Approach Aimed at Test
Cost Reduction
A.A. Shahrjooi Haghighi, M. Abbasi Dezfuli, S.M. Fakhrahmad
classifiers based on state-of-the-art statistical methods designed for comparing different classifiers over different datasets [9]. We will extend this research by studying 37 various classifiers and comparing their performances on five other datasets. By evaluating the classifiers based on their performance measure, (Accuracy (ACC) and area under curve (AUC)), we determine the best classification performance.
During the past years, many researchers have attempted to evaluate different methods and several defect prediction systems have been proposed. The results of these systems are given in terms of classification accuracy, precision, performance, etc. However, these factors do not really show the goodness of the model. This paper extends our preceding results that presented a set of low cost metrics for fault detection systems [13]. In our previous work, by using AD-Miner algorithm [16], we proposed a set of metrics which demonstrate higher performance and accuracy for fault prediction systems. In this paper we are going to deploy the accuracy by finding a classifier which performs better than others in fault detection systems. Since our intention is to reduce cost and provide higher performance in fault detection systems, in this paper we will peruse classifiers to find a classifier which obtains higher accuracy in fault prediction systems.
The rest of the paper is organized as follows. In Section 2, we present the definitions. Section 3 reviews various classifiers on NASA datasets and chooses a classifier with highest performance in fault detection systems. Moreover, the obtained results and empirical rules are presented. Finally, in Section 4 we draw a conclusion and propose future works.
II. DEFINITIONS
In this section a brief description of Metrics Data Program (MDP) and various metrics used in fault prediction systems are presented. Moreover, the process of bagging classification, which is proved to be the most efficient classifier amongst the set of classifiers in our experiments, is enlightened.
A. Metrics Data Program (MDP)
The NASA IV&V Metrics Data Program project is being developed by Galaxy Global Corporation, Inc. for NASA. The primary objective of the Metrics Data Program is to collect, validate, organize, store and deliver software metrics data. MDP provides access to the data repository containing software metrics and associated error data at the function/method level. The data repository stores and organizes the data which has been collected and validated by the Metrics Data Program. The repository contains software metrics and the associated error data at the function/method level for NASA software development projects. The data is neither representative of nor generated by IV&V analysis.
The repository metrics include: McCabe Software Metrics Halstead Metrics
Line of Code Metrics
Error metrics derived from the association between errors and functions/modules
Requirement Metrics
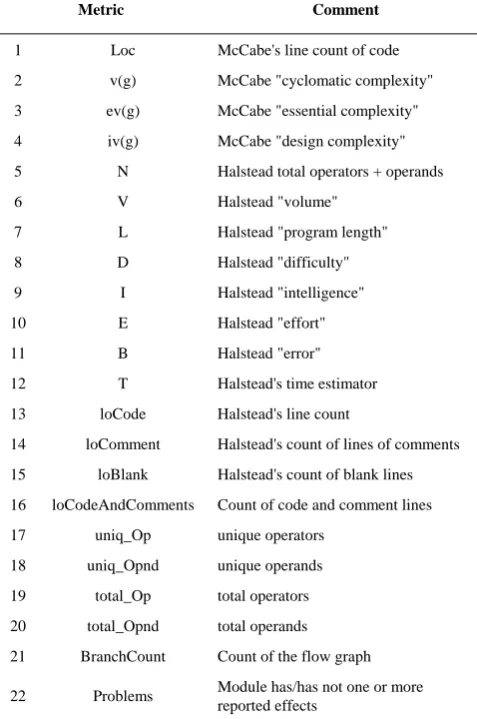
[image:2.595.311.550.262.622.2]The association between the error data and metrics data in the repository provides the opportunity for users to investigate the relationship of metrics or combinations of metrics to the software. The primary goal of the repository is to provide project non-specific data to the software community. The data that is made available to general users has been sanitized and authorized for publication through the MDP website by officials representing the projects from which the data has originated. The database uses unique numeric identifiers to describe individual error records and product entries. The repository data is available at no cost [14]. Datasets used in fault prediction systems often include Metrics that are shown in Table I. The description of each Metric is mentioned in its adjacent cell in the table.
TABLE I
Attributes Within the MDP Datasets
Metric Comment
1 Loc McCabe's line count of code
2 v(g) McCabe "cyclomatic complexity"
3 ev(g) McCabe "essential complexity"
4 iv(g) McCabe "design complexity"
5 N Halstead total operators + operands
6 V Halstead "volume"
7 L Halstead "program length"
8 D Halstead "difficulty"
9 I Halstead "intelligence"
10 E Halstead "effort"
11 B Halstead "error"
12 T Halstead's time estimator
13 loCode Halstead's line count
14 loComment Halstead's count of lines of comments
15 loBlank Halstead's count of blank lines
16 loCodeAndComments Count of code and comment lines
17 uniq_Op unique operators
18 uniq_Opnd unique operands
19 total_Op total operators
20 total_Opnd total operands
21 BranchCount Count of the flow graph
22 Problems Module has/has not one or more reported effects
B. Bagging Classifier
Classification is learning a function that maps a data item into one of several predefined classes. Examples of classification methods used as part of knowledge discovery applications include classifying trends in financial markets and automated identification of objects of interest in large images databases [17]. In fault detection systems, classifiers are used to predict whether each module contains fault or not.
numerical outcome and does a plurality vote when predicting a class. The multiple versions are formed by making bootstrap replicates of the learning set and using these as new learning sets. Tests on real and simulated datasets using classification and regression trees and subset selection in linear regression show that bagging can give substantial gains in accuracy. The vital element is the instability of the prediction method. If perturbing the learning set can cause significant changes in the predictor constructed, then bagging can improve accuracy [18].
III. RESULTS AND DISCUSSION
Due to the variety of classifiers the WEKA supports and also its efficient environment for experimental data analysis, we used the WEKA software. As it was stated previously Lessman et al. [15] already had conducted research in this field. According to his opinion classifiers do not differ much from each other. We will extend this research by studying more classifiers. We are interested in determining an appropriate classifier for our proposed method. Therefore, the values of AUC, ACC are calculated for several
classifiers and eventually according to these values, the best classifier is selected.
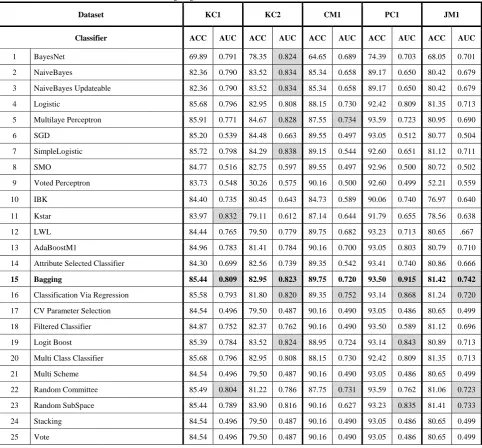
[image:3.595.57.540.337.785.2]The AUC is recommended as the primary accuracy indicator for comparative studies in software defect prediction since it separates predictive performance from class and cost distributions, which are project specific characteristics that may be unknown or subject to change. Therefore, the AUC- based evaluation has the potential to significantly improve convergence across studies [15]. Table II shows the results of evaluating 37 classifiers on five different NASA datasets. In order to compare the performance of the mentioned classifiers, two of the most commonly used criteria are chosen. ACC and AUC values are calculated as an indication of how classifiers perform on each dataset. Since AUC is usually chosen as the most significant criteria for this purpose, we have concentrated on this value. In each column of the table, the cells containing the highest AUC (with less difference from the highest AUC value) are highlighted.
TABLE II
Investigating Classifiers’ Performances on NASA Datasets
Dataset KC1 KC2 CM1 PC1 JM1
Classifier ACC AUC ACC AUC ACC AUC ACC AUC ACC AUC
1 BayesNet 69.89 0.791 78.35 0.824 64.65 0.689 74.39 0.703 68.05 0.701
2 NaiveBayes 82.36 0.790 83.52 0.834 85.34 0.658 89.17 0.650 80.42 0.679
3 NaiveBayes Updateable 82.36 0.790 83.52 0.834 85.34 0.658 89.17 0.650 80.42 0.679
4 Logistic 85.68 0.796 82.95 0.808 88.15 0.730 92.42 0.809 81.35 0.713
5 Multilaye Perceptron 85.91 0.771 84.67 0.828 87.55 0.734 93.59 0.723 80.95 0.690
6 SGD 85.20 0.539 84.48 0.663 89.55 0.497 93.05 0.512 80.77 0.504
7 SimpleLogistic 85.72 0.798 84.29 0.838 89.15 0.544 92.60 0.651 81.12 0.711
8 SMO 84.77 0.516 82.75 0.597 89.55 0.497 92.96 0.500 80.72 0.502
9 Voted Perceptron 83.73 0.548 30.26 0.575 90.16 0.500 92.60 0.499 52.21 0.559
10 IBK 84.40 0.735 80.45 0.643 84.73 0.589 90.06 0.740 76.97 0.640
11 Kstar 83.97 0.832 79.11 0.612 87.14 0.644 91.79 0.655 78.56 0.638
12 LWL 84.44 0.765 79.50 0.779 89.75 0.682 93.23 0.713 80.65 .667
13 AdaBoostM1 84.96 0.783 81.41 0.784 90.16 0.700 93.05 0.803 80.79 0.710
14 Attribute Selected Classifier 84.30 0.699 82.56 0.739 89.35 0.542 93.41 0.740 80.86 0.666
15 Bagging 85.44 0.809 82.95 0.823 89.75 0.720 93.50 0.915 81.42 0.742
16 Classification Via Regression 85.58 0.793 81.80 0.820 89.35 0.752 93.14 0.868 81.24 0.720
17 CV Parameter Selection 84.54 0.496 79.50 0.487 90.16 0.490 93.05 0.486 80.65 0.499
18 Filtered Classifier 84.87 0.752 82.37 0.762 90.16 0.490 93.50 0.589 81.12 0.696
19 Logit Boost 85.39 0.784 83.52 0.824 88.95 0.724 93.14 0.843 80.89 0.713
20 Multi Class Classifier 85.68 0.796 82.95 0.808 88.15 0.730 92.42 0.809 81.35 0.713
21 Multi Scheme 84.54 0.496 79.50 0.487 90.16 0.490 93.05 0.486 80.65 0.499
22 Random Committee 85.49 0.804 81.22 0.786 87.75 0.731 93.59 0.762 81.06 0.723
23 Random SubSpace 85.44 0.789 83.90 0.816 90.16 0.627 93.23 0.835 81.41 0.733
24 Stacking 84.54 0.496 79.50 0.487 90.16 0.490 93.05 0.486 80.65 0.499
26 Input Mapped Classifier 84.54 0.496 79.50 0.487 90.16 0.490 93.05 0.486 80.65 0.499
27 Decision Table 84.87 0.785 83.14 0.823 89.15 0.626 92.87 0.738 80.90 0.703
28 JRIP 84.54 0.587 82.18 0.698 89.35 0.529 93.32 0.602 81.04 0.570
29 OneR 83.64 0.569 81.22 0.657 88.35 0.517 92.87 0.529 79.43 0.533
30 PART 84.82 0.747 82.18 0.753 88.75 0.721 93.68 0.926 80.74 0.712
31 ZeroR 84.54 0.496 70.50 0.487 90.16 0.490 93.05 0.486 80.65 0.499
32 Decision Stump 84.54 0.711 70.69 0.773 90.16 0.643 93.05 0.690 80.65 0.655
33 J48 84.54 0.689 81.41 0.704 87.95 0.558 93.32 0.668 79.50 0.653
34 LMT 85.72 0.798 84.29 0.838 89.15 0.555 92.87 0.693 81.24 0.711
35 Random Forest 85.15 0.771 82.95 0.802 88.55 0.710 93.68 0.825 80.84 0.722
36 Random Tree 82.69 0.608 80.84 0.620 84.33 0.549 91.07 0.661 75.45 0.592
37 REP Tree 85.11 0.822 81.60 0.725 89.15 0.502 93.59 0.782 80.67 0.704
As it is illustrated in Table II, Bagging usually depicts a high AUC for each dataset. Although other classifiers might acquire a high performance for a specific dataset, they don’t perform well overall but bagging classification manages to perform better than the other classifiers. For instance classification via regression approach illustrates high AUC values but still lower than bagging. Hence we have chosen Bagging as the appropriate classification algorithm for defect prediction systems.
A. Bagging Performance Evaluation
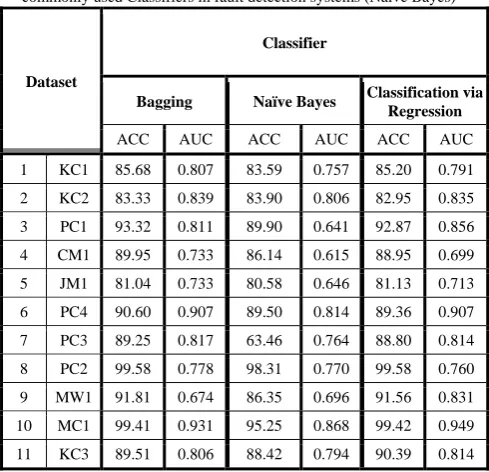
[image:4.595.307.552.408.644.2]In this section, bagging classification, which was chosen according to our experiments, is compared against the most commonly used classifier in fault detection systems (Naïve Bayes) as well as classification via regression approach that managed to illustrate acceptable results in the previous datasets. We determined the best approach by evaluating classifiers on 5 NASA datasets. In order to evaluate bagging and its performance on other datasets, we conduct our experiments on 11 different datasets. In the following experiments, the input features are determined by an approach discussed in [13]. Table III depicts the selected metrics.
TABLE III
Selected Set of Metrics for Fault Detection Systems
We have conducted another experiment in order to compare the performance of three of the best classifiers.
These classifiers were determined by the results of the previous experiment. Table IV illustrates the outcome of this comparison. By testing Bagging, Naïve Bayes and Classification via Regression on each dataset, AUC and ACC were determined. As it is depicted in table IV, Bagging manages to outperform the two rival approaches, Naïve Bayes and Classification via Regression, in 7 datasets.
TABLE IV
Comparison of the appropriate Classifier (Bagging) and one of the most commonly used Classifiers in fault detection systems (Naïve Bayes)
Classifier Dataset Classification via Regression Naïve Bayes Bagging AUC ACC AUC ACC AUC ACC 0.791 85.20 0.757 83.59 0.807 85.68 KC1 1 0.835 82.95 0.806 83.90 0.839 83.33 KC2 2 0.856 92.87 0.641 89.90 0.811 93.32 PC1 3 0.699 88.95 0.615 86.14 0.733 89.95 CM1 4 0.713 81.13 0.646 80.58 0.733 81.04 JM1 5 0.907 89.36 0.814 89.50 0.907 90.60 PC4 6 0.814 88.80 0.764 63.46 0.817 89.25 PC3 7 0.760 99.58 0.770 98.31 0.778 99.58 PC2 8 0.831 91.56 0.696 86.35 0.674 91.81 MW1 9 0.949 99.42 0.868 95.25 0.931 99.41 MC1 10 0.814 90.39 0.794 88.42 0.806 89.51 KC3 11
IV. CONCLUSION
In this paper, we have investigated comparison of 37 classification algorithms over 5 public NASA datasets. By comparing different classification algorithms, we figured that Bagging shows a better performance than the rest of classifiers in fault detection systems. So, we chose Bagging as our appropriate classifier. For verification of the selected classifier, performance of Bagging, Naïve Bayes and Classification via Regression were compared on more datasets. The results illustrated that Bagging has the highest Metric Comment
v(g) McCabe "cyclomatic complexity"
ev(g) McCabe "essential complexity"
iv(g) McCabe "design complexity"
E Halstead "effort"
T Halstead's time estimator
loCode Halstead's line count
loBlank Halstead's count of blank lines
loCodeAndComments Halstead's count of lines of comments
uniq_Opnd unique operands
[image:4.595.54.266.568.754.2]performance on fault detection systems. Therefore by employing Bagging as the appropriate classifier, the prediction system is more accurate.
As future work, we can focus on Bagging algorithm and through its optimization for fault detection systems, increase the detecting performance.
REFERENCES
[1] A. Porter, R. Selby, "Empirically Guided Software Development Using Metric-Based Classification Trees", IEEE Software, no. 7, pp. 46-54, 1990.
[2] L.C Briand, W.L. Melo, J. Wu, "Assessing the Applicability of Fault-Proneness Models Across Object-Oriented Software Projects", IEEE Trans, Software Eng, 28 (7), pp. 706-720, 2002.
[3] Menzies T.; Greenwald J.; A. Frank, "Data Mining Static Code Attributes to Learn Defect Predictors", IEEE Transactions on Software Engineering, vol.33, no.12-13, 2007.
[4] A. Porter, R. Selby, "Evaluating Techniques for Generating Metric-Based Classification Trees", J. Systems Software, vol. 12, pp. 209-218, 1990.
[5] S. Lessmann, B. Baesens, C. Mues, S. Pietsch, "Benchmarking Classification Models for Software Defect Prediction: A Proposed Framework and Novel Findings", IEEE Trans. on Software Engineering, 34 (4), pp. 485-496, 2008.
[6] M. Fagan, "Advances in software inspections", IEEE Trans. on Software Engineering, pages 744-751, 1986.
[7] B. Turhan, T. Menzies, A. Bener, J. Distefano, "On the relative value of cross-company and within-company data for defect prediction", Empirical Software Engineering Journal, pp.46-54, 2009.
[8] S. M. Fakhrahmad, M. H. Sadreddini, M. Zolghadri Jahromi, "AD - Miner: A new incremental method for discovery of minimal approximate dependencies using logical operations", Intelligent Data Analysis 12, pp. 1-13, 2008.
[9] F. Shull, V. Basili, B. Boehm, A. Brown, P. Costa P, M. Lindvall, D. Port, I. Rus, R. Tesoriero, M. Zelkowitz, "What we have learned about fighting defects," in Proceedings of 8th International Software Metrics Symposium, Ottawa, Canada, pp. 249-258, 2002.
[10] C Catal, B Diri, "A systematic review of software fault prediction studies", Expert systems with applications 36, 7346-7354, 2009. [11] A. A. Shahrjooi Haghighi, M. Abbasi Dezfuli, S. M. Fakhrahmad,
"Modeling a system using methods to detect software errors Data mining", Fifth Conference of Iranian Data mining, AUT, Iran, 2011. [12] T. Menzies, Z. Milton, B. Turhan B, B. Cukic, Y. Jiang, A. Bener,
"Defect prediction from static code features: current results, limitations", new approaches, Springer Science + Business Media, Autom Software Engineering, 2010.
[13] M. Chapman, P. Callis, W. Jackson, "Metrics Data Program", NASA IV and V Facility, http://mdp.ivv.nasa.gov/, 2004.
[14] J. Dem_sar, "Statistical Comparisons of Classifiers over Multiple Datasets", Machine Learning Research, 7, pp. 1-30, 2006.
[15] T. Menzies, J. DiStefano, A. Orrego, R. Chapman, "Assessing Predictors of Software Defects", In Proc. Workshop Predictive Software Models, 2004.
[16] Y. Jiang, B. Cukic, T. Menzies, N. Bartlow, "Comparing Design and Code Metrics for Software Quality Prediction", Proceedings of the PROMISE 2008 Workshop (ICSE), 2008.
[17] T. Bao Hu, “Introduction to Knowledge Discovery and Data Mining”, Institute of Information Technology, National Center for Natural Science and Technology.