Micha Elsner
∗Brown Laboratory for Linguistic Information Processing (BLLIP)
Eugene Charniak
∗∗Brown Laboratory for Linguistic Information Processing (BLLIP)
When multiple conversations occur simultaneously, a listener must decide which conversation each utterance is part of in order to interpret and respond to it appropriately. We refer to this task as disentanglement. We present a corpus of Internet Relay Chat dialogue in which the various conversations have been manually disentangled, and evaluate annotator reliability. We propose a graph-based clustering model for disentanglement, using lexical, timing, and discourse-based features. The model’s predicted disentanglements are highly correlated with manual annotations. We conclude by discussing two extensions to the model, specificity tuning and conversation start detection, both of which are promising but do not currently yield practical improvements.
1. Motivation
Simultaneous conversations seem to arise naturally in both informal social interactions and multi-party typed chat. Aoki et al.’s (2006) study of voice conversations among 8–10 people found an average of 1.76 conversations (floors) active at a time, and a maximum of four. In our chat corpus, the average is even higher, at 2.75. The typical conversation, therefore, does not form a contiguous segment of the chatroom transcript, but is frequently broken up by interposed utterances from other conversations.
Disentanglement (also calledthread detection[Shen et al. 2006],thread extraction [Adams and Martell 2008], and thread/conversation management [Traum 2004]) is the clustering task of dividing a transcript into a set of distinct conversations. It is an essential prerequisite for any kind of higher-level dialogue analysis. For instance, consider the multi-party exchange in Figure 1.
Contextually, it is clear that this corresponds to two conversations, and Felicia’s1 responseexcellentis intended for Chanel and Regine. A straightforward reading of the transcript, however, might interpret it as a response to Gale’s statement immediately preceding.
∗Brown Laboratory for Linguistic Information Processing, Brown University, Providence, RI 02912. E-mail: [email protected].
∗∗Brown Laboratory for Linguistic Information Processing, Brown University, Providence, RI 02912. E-mail: [email protected].
1 Real user nicknames are replaced with randomly selected identifiers for ethical reasons.
Figure 1
Some (abridged) conversation from our corpus.
Humans are adept at disentanglement, even in complicated environments like crowded cocktail parties or chat rooms; in order to perform this task, they must maintain a complex mental representation of the ongoing discourse. Moreover, they adjust their conversational behavior to make the task easier, mentioning names more frequently than in spoken or two-party typed dialogues (O’Neill and Martin 2003). This need for adaptation suggests that disentanglement can be challenging even for humans, and therefore can serve as a useful stress test for computational models of discourse.
Disentanglement has two practical applications. One is the analysis of pre-recorded transcripts in order to extract some kind of information, such as question–answer pairs or summaries. These tasks should probably take as input each separate conversation, rather than the entire transcript. Another application is as part of a user-interface system for active participants in the chat, in which users target a conversation of interest which is then highlighted for them. Aoki et al. (2003) created such a system for speech, which users generally preferred to a conventional system—when the disentanglement worked!
We begin in Section 2 with an overview of related work. In Section 3, we present a new corpus of manually annotated chat room data and evaluate annotator reliability. We give a set of metrics (Section 3.2) describing structural similarity both locally and glob-ally. In Section 4, we propose a model which uses supervised pairwise classification to link utterances from the same conversation, followed by a greedy inference stage which clusters the utterances into conversations. Our system uses time gap and utterance con-tent features. Experimental results (Section 5) show that its output is highly correlated with human annotations. Finally, in Sections 6 and 7, we investigate two extensions to the basic model, specificity tuning and automatic detection of conversation starts.
To our knowledge, this is the first work to evaluate interannotator agreement for the disentanglement task. It is also the first to use a supervised method to learn weights for different feature types, rather than relying on cosine distance with uniform or hand-tuned feature weights. It supplements standard word repetition and time gap features with other feature types, including very powerful features based on name mentioning, which is common in Internet Relay Chat.
2. Related Work
analysis, extracting groups of speakers who talk to one another. This can be considered a disentanglement task, although, as we will see (Section 5), the assumption that each speaker participates in only one conversation is flawed.
Adams and Martell (2008) and Shen et al. (2006) publish results on human-annotated data; although we do not have their corpora, we discuss their evaluation metrics (Section 3.2) and give a comparison to our own results herein (Section 5). Aoki et al. (2006) construct an annotated speech corpus, but they give no results for model performance, only user satisfaction with their conversational system. Camtepe et al. (2005) and Acar et al. (2005) do give performance results, but only on synthetic data.
Adams and Martell (2008) and Shen et al. (2006) treat disentanglement in the same way we do, as a clustering task where the objects to be clustered are the individual utterances. Both their algorithms define a notion of distance (based on the cosine) and a threshold parameter determining how close to the cluster center an utterance must be before the clustering algorithm adds it. This stands in contrast to our own supervised approach, where the distance metric is explicitly tuned on training data. The super-vised method has the advantage that it can weigh individual feature types based on their predictivity—unsupervised methods combine features either uniformly or using heuristic methods. There is also no need for a separate tuning phase to determine the threshold. On the other hand, supervised methods require labeled training data, and may be more difficult to adapt to novel domains or corpora.
The remaining papers treat the problem as one of clustering speakers, rather than utterances. That is, they assume that during the window over which the system oper-ates, a particular speaker is engaging in only one conversation. Camtepe et al. (2005) state an explicit assumption that this is true throughout the entire transcript; real speak-ers, by contrast, often participate in many conversations, sequentially or sometimes even simultaneously. Aoki et al. (2003) analyze each 30-second segment of the transcript separately. This makes the single-conversation restriction somewhat less severe, but has the disadvantage of ignoring all events which occur outside the segment.
Acar et al. (2005) attempt to deal with this problem by using a fuzzy algorithm to cluster speakers; this assigns each speaker a distribution over conversations rather than making a hard assignment. However, the algorithm still deals with speakers rather than utterances, and cannot determine which conversation any particular utterance is part of. Another problem with these two approaches is the information used for clustering. Aoki et al. (2003) and Camtepe et al. (2005) detect the arrival times of messages, and use them to construct an affinity graph between participants by detecting turn-taking behavior among pairs of speakers. (Turn-taking is typified by short pauses between utterances; speakers aim neither to interrupt nor leave long gaps.) Aoki et al. (2006) find that turn-taking on its own is inadequate. They motivate a richer feature set, which, however, does not yet appear to be implemented. Acar et al. (2005) add word repetition to their feature set. However, their approach deals with all word repetitions on an equal basis, and so degrades quickly in the presence of “noise words” (their term for words which are shared across conversations) to almost complete failure when only half of the words are shared.
To motivate our own approach, we examine some linguistic studies of discourse, especially analysis of multi-party conversation. O’Neill and Martin (2003) point out several ways in which multi-party text chat differs from typical two-party conversation. One key difference is the frequency with which participants mention each others’ names. They hypothesize that name mentioning is a strategy which participants use to make disentanglement easier, compensating for the lack of cues normally present in face-to-face dialogue. Mentions (such as Gale’s comments to Arlie in Figure 1) are very common in our corpus, occurring in 36% of comments, and provide a useful feature.
Another key difference is that participants may create a new conversation (floor) at any time, a process which Sacks, Schegloff, and Jefferson (1974) callsschisming. During a schism, a new conversation is formed, not necessarily because of a shift in the topic, but because certain participants have refocused their attention onto each other, and away from whoever held the floor in the parent conversation.
Despite these differences, there are still strong similarities between chat and other conversations such as meetings. Meetings do not typically allow multiple simultaneous conversations, but analogues to schisms do exist, in the form of digressions or “sub-ordinate conversations,” in which the speaker addresses someone specific, who is then expected to answer. Some meeting analysis systems attempt to discover where these digressions begin, who is involved in them, and who has the floor when they end; features used in this work are relevant to disentanglement.
The task of automatically determining the intended recipient of an utterance in a meeting is calledaddressee identification. It requires detecting digressions and identi-fying their participants. Several studies attempt this task. Jovanovic and op den Akker (2004) and Jovanovic, op den Akker, and Nijholt (2006) perform addressee identification using a complex feature set including linguistic cues like pronouns and discourse mark-ers, temporal information, and gaze direction. They also find that addressee identity can be annotated with high reliability (κ=.7 for one set and.8 for another). Traum (2004) discusses the necessity for addressee identification and disentanglement in the design of a system for military dialogues involving virtual agents. Subsequent work (Traum, Robinson, and Stephan 2004) develops a rule-based system with high accuracy on addressee identification.
Another meeting-related task isfloor tracking, which attempts to determine which speaker has the floor after each utterance. This task involves modeling the coordination strategies which speakers use to acquire or give up the floor, and so provides a good model of an ongoing conversation. A detailed analysis is given in Chen et al. (2006); Chen (2008) also gives a model for detecting floor shifts. Hawes, Lin, and Resnik (2008) use a conditional random fields (CRF) model to predict the next speaker in Supreme Court oral argument transcripts.
A somewhat related area of research involves environments with higher latency than real-time chat: message boards and e-mail. Content matching approaches tend to work better in these settings, because while many chat messages are backchannel responses or discourse requests (Yes, Why? and so forth), longer posts tend to be contentful. Of the two tasks, e-mail is easier; Yeh and Harnly (2006) find that heuristic information from message headers can be useful, as can content-based matching such as detecting quotes from earlier messages. Wang et al. (2008), an analysis of a student discussion group, is the work on which Adams and Martell (2008) is based, and uses very similar methodology based on TF-IDF.
classifier. The global partitioning problem was identified ascorrelation clustering, an NP-hard problem, by McCallum and Wellner (2004).
Finally, we briefly mention some work which appeared after we developed the system described here. Wang and Oard (2009) is another system that uses TF–IDF unigrams, but augments these feature vectors using the information retrieval technique of message expansion. They report results on our corpus which improve on our own. Adams (2008) attempts to use not only WordNet but Latent Dirichlet Allocation to describe semantic relatedness. He finds both techniques ineffective. In addition, he annotates a large corpus of Internet Relay Chat and similarly finds that annotators have trouble agreeing. Elsner and Schudy (2009) explore different partitioning strategies, improving on the greedy algorithm that we present.
3. Data Set
Our data set is recorded from IRC channel ##LINUXat free–node.net, using the freely availablegaimclient. ##LINUXis an unofficial tech support line for the Linux operating system, selected because it is one of the most active chat rooms on freenode, leading to many simultaneous conversations, and because its content is typically inoffensive. Although it is notionally intended only for tech support, it includes large amounts of social chat as well, such as the conversation about factory work in Figure 1.
The entire data set contains over 52 hours of chat, but we devote most of our attention to three annotated sections: development (706 utterances; 2:06 hr) and test (800 utterances; 1:39 hr), plus a short pilot section on which we tested our annotation system (359 utterances; 0:58 hr).
3.1 Annotation
We recruited and paid seven university students to annotate the test section. All had at least some familiarity with the Linux OS, although in some cases very slight. Anno-tation of the test data set typically took them about two hours. In all, we produced six annotations of the test set.2
We have four annotations of the pilot set, by three volunteers and the experimenters. The pilot set was used to prototype our annotation software, and also as a validation cor-pus for our system. The development set was annotated only once, by the experimenter. This data set is used for training.
Our annotation scheme marks each utterance as part of a single conversation. Annotators are instructed to create as many or as few conversations as they need to describe the data. Our instructions state that a conversation can be between any number of people, and that, “We mean conversation in the typical sense: a discussion in which the participants are all reacting and paying attention to one another . . . it should be clear that the comments inside a conversation fit together.” The annotation system itself is a simple Java program with a graphical interface, intended to appear somewhat similar to a typical chat client. Each speaker’s name is displayed in a different color, and the system displays the elapsed time between comments, marking especially long pauses
in red. Annotators group utterances into conversations by clicking and dragging them onto each other.
3.2 Metrics
Before discussing the annotations themselves, we will describe the metrics we use to compare different annotations; these measure both how much our annotators agree with each other, and how well our model and various baselines perform. Comparing clusterings with different numbers of clusters is a non-trivial task, and metrics for agreement on supervised classification, such as theκstatistic, are not applicable.
To measure global similarity between annotations, we use one-to-one accuracy. This measure describes how well we can extract whole conversations intact, as required for summarization or information extraction. To compute it, we pair up conversations from the two annotations to maximize the total overlap by computing an optimal max-weight bipartite matching, then report the percentage of overlap found.3 One-to-one accuracy is a standard metric in unsupervised part-of-speech tagging (e.g., Haghighi and Klein 2006), and is equivalent tomention-based CEAF(Luo 2005) for coreference resolution.
If we intend to monitor or participate in the conversation as it occurs, we will care more about local judgments. Thelocal agreementmetric is a constrained form of the Rand index for clusterings (Rand 1971) which counts agreements and disagreements for pairs within a contextk. We consider a particular utterance: The previouskutterances are each in either the same or a different conversation. Thelock score between two annotators is their average agreement on theseksame/different judgments, averaged over all utterances. For example,loc1 counts pairs of adjacent utterances for which two annotations agree.
Several related papers use some variant of theF-scoremetric to measure accuracy. The most complete treatment is given in Shen et al. (2006). They use a micro-averaged F-score, which is defined by constructing a multiway matching between conversations in the two annotations. For a gold conversationiwith sizeni, and a proposed
conver-sationjwith sizenj, with overlap of sizenij, they define precision and recall (plus the
standard balanced F-score). The F-score of an entire annotation is a weighted sum over the matching:
P=nnij
j R=
nij
ni F(i,j)=
2PR
P+R F=
i
ni
n maxjF(i,j) (1)
This is the F-score we report for comparative purposes. Because the match is multiway, the score is not symmetric; when measuring agreement between pairs of human anno-tators (where there is no reason for one to be considered gold), we map the high-entropy transcript to the lower one (the entropy of a transcript is defined subsequently, in Equation 2). Micro-averaged F-scores are also popular in work on document clustering. In general, scores using this metric are correlated with our other measurement of global consistency, the one-to-one accuracy.
Adams and Martell (2008) also report F-score, but using a somewhat different definition. They define F-score only between a particular pair of conversations, and report the score for a single selected conversation. They do not describe how this reference conversation is chosen. It is also unclear how they determine which proposed conversation to match to it—the one with the best F-score, or the one which contains the first (or “root”) utterance of the reference conversation. (The latter, although it may be more useful for some applications, has an obvious problem—if the conversation is retrieved perfectlyexceptfor the root utterance, the score will be zero.) For these reasons we do not evaluate their metric.
3.3 Discussion
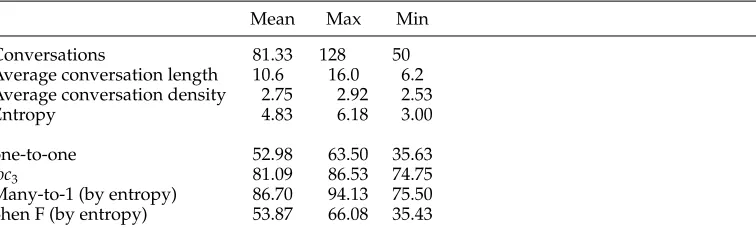
A statistical examination of our data (Table 1) shows that there is a substantial amount of disentanglement to do: the average number of conversations active at a time (the density) is 2.75. Our annotators have high agreement on the local metric (average of 81.1%). On the one-to-one metric, they disagree more, with a mean overlap of 53.0% and a maximum of only 63.5%. Though this level of agreement is low, naive baselines score even lower (see Section 5). Therefore the metric does indeed distinguish human-like from baseline performance. Thus measuring one-to-one overlap with our annotations is a reasonable evaluation for computational models. However, we feel that the major source of disagreement is one that can be remedied in future annotation schemes: the specificity of the individual annotations.
To measure the level of detail in an annotation, we use the information-theoretic entropy of the random variable, which indicates which conversation an utterance is in. This variable has as many potential values as the number of conversations in the transcript, each value having probability proportional to its size. Thus, for a transcript of lengthn, with conversationsieach having sizeni, the entropy is:
H(c)=
i
ni
n log2 ni
n (2)
[image:7.486.58.436.547.664.2]This quantity is non-negative, increasing as the number of conversations grow and their size becomes more balanced. It reaches its maximum, 9.64 bits for this data set, when
Table 1
Statistics on 6 annotations of 800 utterances of chat transcript. Inter-annotator agreement metrics (below the line) are calculated between distinct pairs of annotations.
Mean Max Min
Conversations 81.33 128 50
Average conversation length 10.6 16.0 6.2 Average conversation density 2.75 2.92 2.53
Entropy 4.83 6.18 3.00
one-to-one 52.98 63.50 35.63
loc3 81.09 86.53 74.75
each utterance is placed in a separate conversation. In our annotations, it ranges from 3.0 to 6.2. This large variation shows that some annotators are more specific than others, but does not indicate how much they agree on the general structure. To measure this, we introduce themany-to-one accuracy. This measurement is asymmetrical, and maps each of the conversations of the source annotation to the single conversation in the targetwith which it has the greatest overlap, then counts the total percentage of overlap. This is not a statistic to be optimized (indeed, optimization is trivial: Simply make each utterance in the source into its own conversation), but it can give us some intuition about specificity. In particular, if one subdivides a coarse-grained annotation to make a more specific variant, the many-to-one accuracy from fine to coarse remains 1. When we map high-entropy annotations (fine) to lower ones (coarse), we find high many-to-one accuracy, with a mean of 86%, which implies that the more specific annotations have mostly the same large-scale boundaries as the coarser ones.
By examining the local metric, we can see even more: Local correlations are good, at an average of 81.1%. This means that, in the three-sentence window preceding each sentence, the annotators are often in agreement. If they recognize subdivisions of a large conversation, these subdivisions tend to be contiguous, not mingled together, which is why they have little impact on the local measure.
We find reasons for the annotators’ disagreement about appropriate levels of detail in the linguistic literature. As mentioned, new conversations often break off from old ones in schisms. Aoki et al. (2006) discuss conversational features associated with schisming and the related process ofaffiliation, by which speakers attach themselves to a conversation. Schisms often branch off from asides or even normal comments ( toss-outs) within an existing conversation. This means that there is no clear beginning to the new conversation—at the time when it begins, it is not clear that there are two separate floors, and this will not become clear until distinct sets of speakers and patterns of turn-taking are established. Speakers, meanwhile, take time to orient themselves to the new conversation. Example schisms are shown in Figures 2 and 3.
Our annotation scheme requires annotators to mark each utterance as part of a single conversation, and distinct conversations are not related in any way. If a schism occurs, the annotator is faced with two options: If it seems short, they may view it as a mere digression and label it as part of the parent conversation. If it seems to deserve a place of its own, they will have to separate it from the parent, but this severs the initial comment (an otherwise unremarkable aside) from its context. One or two of the annotators actually remarked that this made the task confusing. Our annotators seem
Figure 2
Figure 3
[image:9.486.54.286.306.428.2]A schism occurring in our corpus (abridged): not all annotators agree on where the thread about charging for answers to technical questions diverges from the one about setting up Paypal accounts. The schism begins just after Lai’s second comment (marked with arrows), to which Gale and Azzie both respond (marked with double arrows). Annotators 1, 2, 4, and 5 begin a new conversation with Gale’s response. Annotator 0 starts a new conversation with Azzie’s response. Annotator 3 makes an error, linking the two responses to each other, but not to the parent.
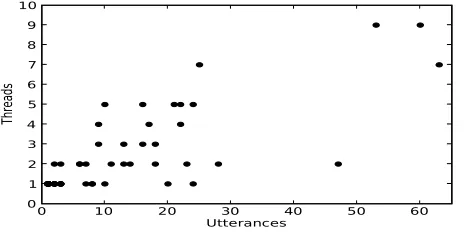
Figure 4
Utterances versus conversations participated in per speaker on development data.
to be either “splitters” or “lumpers”—in other words, each annotator seems to aim for a consistent level of detail, but each one has their own idea of what this level should be. As a final observation about the data set, we test the appropriateness of the assump-tion (used in previous work) that each speaker takes part in only one conversaassump-tion. In our data, the average speaker takes part in about 3.3 conversations (the actual number varies for each annotator). The more talkative a speaker is, the more conversations they participate in, as shown by a plot of conversations versus utterances (Figure 4). The assumption is not very accurate, especially for speakers with more than 10 utterances.
4. Model
Table 2
Feature functions with performance on development data.
Chat-specific (Acc: 73 Prec: 73 Rec: 61 F: 66)
Time The time betweenxandyin seconds, discretized into logarithmically sized bins. Speaker xandyhave the same speaker.
Mention x-y xmentions the speaker ofy(or vice versa). For example, this feature is true for a pair such as:Felicia “Gale: ...and any utterance spoken by Gale.
Mention same Bothxandymention the same name. Mention other eitherxorymentions a third person’s name.
Discourse (Acc: 52 Prec: 47 Rec: 77 F: 58)
Cue words Eitherxoryuses a greeting (helloetc.), an answer (yes,noetc.), or thanks. Question Either asks a question (explicitly marked with?).
Long Either is long (>10 words).
Content (Acc: 50 Prec: 45 Rec: 74 F: 56)
Repeat(i) The number of words shared betweenxandywhich have unigram probabilityi, binned logarithmically.
Tech Whether bothxandyuse technical jargon, neither do, or only one does.
Combined (Acc: 75 Prec: 73 Rec: 68 F: 71)
a binary classifier marks each pair of items as alike or different, and second, a consistent partition is extracted.4
4.1 Classification
We use a maximum-entropy classifier (Daum´e 2004) to decide whether a pair of utter-ancesxandyare insameordifferentconversations. The most likely class isdifferent, which occurs 57% of the time in the development data. We describe the classifier’s per-formance in terms of raw accuracy (correct decisions/total), precision and recall of the sameclass, and F-score, the harmonic mean of precision and recall. Our classifier uses several types of features (Table 2). The chat-specific features yield the highest accuracy and precision. Discourse and content-based features have poor accuracy on their own (worse than the baseline), because they work best on nearby pairs of utterances, and tend to fail on more distant pairs. Paired with the time gap feature, however, they boost accuracy somewhat and produce substantial gains in recall, encouraging the model to group related utterances together.
The classifier is trained on our single annotation of the 706-utterance development section and validated against the 359-utterance pilot section.
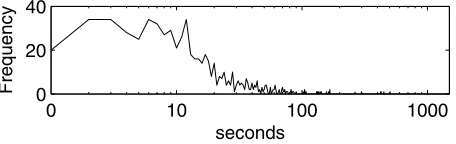
Figure 5
Distribution of pause length (log-scaled) between utterances in the same conversation.
The time gap, as discussed earlier, is the most widely used feature in previous work. Our choice of a logarithmic binning scheme is intended to capture two characteristics of the distribution of pause lengths (shown in Figure 5). The curve has its maximum at 1– 3 seconds, and pauses shorter than a second are less common. This reflects turn-taking behavior among participants; participants in the same conversation prefer to wait for each others’ responses before speaking again. On the other hand, the curve is quite heavy-tailed to the right, leading us to bucket long pauses fairly coarsely. The specific discretization we adopt for a time gap∆isbin(∆)=floor(log1.5(∆ +1)). The particular choice of 1.5 was chosen by hand to fit the observed scale of the curve.
Our discourse-based features model some pairwise relationships: questions fol-lowed by answers, short comments reacting to longer ones, greetings at the beginning, and thanks at the end.
Word repetition is a key feature in nearly every model for segmentation or coher-ence, so it is no surprise that it is useful here. We discard the 50 most frequent words. Then we bin all words by their unigram probability (bin(w)=floor(log10(p(w))) and create an integer-valued feature for each bin, equal to the number of repeated words in that bin. Unigram probabilities are calculated over the entire 52 hours of transcript. The binning scheme allows us to deal with “noise words” which are repeated coincidentally, because these occur in high-probability bins where repetitions are given less weight.
The point of the repetition feature is of course to detect sentences with similar topics. We also find that sentences with technical content are more likely to be related than non-technical sentences. We label an utterance as technical if it contains a Web address, a long string of digits, or a term present in a guide for novice Linux users5 but not in a large news corpus (Graff 1995).6 This is a lightweight way to capture one “semantic dimension” or cluster of related words. The technical word feature was included because it improves our development classification score slightly, but it does not have a significant effect on overall performance. Adams (2008) attempts to add more semantic dimensions learned via Latent Dirichlet Allocation, and similarly finds no improvement.
Pairs of utterances which are widely separated in the discourse are unlikely to be directly related—even if they are part of the same conversation, the link between them is probably a long chain of intervening utterances. Thus, if we run our classifier on a pair of very distant utterances, we expect it to default to the majority class, which in this case will bedifferent, and this will damage our performance in case the two are really part of the same conversation. To deal with this, we run our classifier only on utterances
5Introduction to Linux: A Hands-on Guide. Machtelt Garrels. Edition 1.25 from
http://tldp.org/LDP/intro-linux/html/intro-linux.html.
Figure 6 VOTEalgorithm.
separated by 129 seconds or less. The cutoff of 129 seconds was chosen because, for utterances further apart than this, the classifier has no significant advantage over the majority baseline. For 99.9% of utterances in an ongoing conversation, the previous utterance in that conversation is within this gap, and so the system has a chance of correctly linking the two.
On test data, the classifier has a mean accuracy of 68.2 (averaged over annotations). The mean precision of same conversation is 53.3 and the recall is 71.3, with a mean F-score of 60. This error rate is high, but the partitioning procedure allows us to recover from some of the errors, because if nearby utterances are grouped correctly, the bad decisions will be outvoted by good ones.
4.2 Partitioning
The next step in the process is to cluster the utterances. We wish to find a set of clusters for which the weighted accuracy of the classifier would be maximal; this is an example ofcorrelation clustering(Bansal, Blum, and Chawla 2004), which is NP-complete. The input to our partitioning procedure is a graph with a node for each utterance; if the classifier connects utterancesiandjwith probabilityp, we take the weightwijof edgeij
to be the log oddslog(pij/(1−pij)).7 We create a variablexij for each pair of utterances,
which is 1 if the utterances are placed in the same conversation, and 0 if they are separated. The log probability of the clustering, treating the edges as independent, is
ij:i<jwijxij. We attempt to maximize this quantity, subject to the constraint that thexij
must form a legitimate clustering such thatxij=xjk=1 impliesxij=xik.
Finding an exact solution proves to be difficult; the problem has a quadratic number of variables (one for each pair of utterances) and a cubic number of triangle inequality constraints (three for each triplet).8 With 800 utterances in our test set, even solving the linear relaxation of the problem with CPLEX (Ilog, Inc. 2003) is too expensive to be practical.
Experiments on a variety of heuristic algorithms (Elsner and Schudy 2009) show that a relatively good solution can be obtained using a greedy voting algorithm (Fig-ure 6). In this algorithm, we assign utterance jby examining all previously assigned
7 The original version of our system used a different weighting scheme,wij=pij−.5. The log-odds ratio behaves similarly for our basic algorithm, but appears to be more robust to other partitioning algorithms or tuning (see Section 6), so, for simplicity, we present it here as well.
utterances i, and treating the classifier’s judgment wij as a vote for cluster(i). If the
maximum vote is greater than 0, we set cluster(j)=argmaxc votec. Otherwise j is put
in a new cluster.
If the utterances are considered in order, this is a natural on-line algorithm—it assigns each utterance as it arrives, without reference to the future. Elsner and Schudy (2009) show that performance can be improved by approximately 6% on the one-to-one and F-score metrics using offline randomized and local search methods. Theloc3metric is insensitive to these more complex search procedures.
5. Experiments
We annotate the 800-line test transcript using our system. The annotation obtained has 62 conversations, with mean length 12.90. The average density of conversations is 2.86, and the entropy is 3.72. This places it within the bounds of our human annotations (see Table 1), toward the more general end of the spectrum.
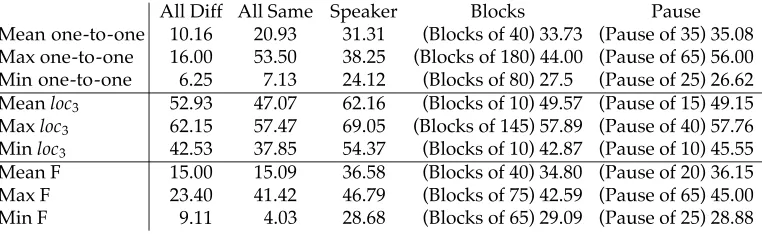
As a standard of comparison for our system, we provide results for several baselines—trivial systems which any useful annotation should outperform.
All different Each utterance is a separate conversation. All same The whole transcript is a single conversation.
Blocks ofk Each consecutive group ofkutterances is a conversation. Pause ofk Each pause ofkseconds or more separates two conversations. Speaker Each speaker’s utterances are treated as a monologue.
For each particular metric, we calculate the best baseline result among all of these. To find the best block size or pause length, we search over multiples of five between 5 and 300. This makes these baselines appear better than they really are, because their performance is optimized with respect to the test data. (A complete table of baseline results is shown in Figure 7.)
We also calculate results for two more systems. One is a non-trivial baseline:
Time/mention Our system, using only time gap and mention-based features.
[image:13.486.57.438.517.634.2]The other is an oracle, designed to test how well a segmentation system designed for meeting or lecture data might possibly do on this task. If no conversation were ever interrupted, such a system would be perfect (up to the limit of annotator agreement).
Figure 7
Table 3
Metric values between proposed annotations and human annotations. Model scores typically fall between inter-annotator agreement and baseline performance.
Annotators Model Time/ment. Perf. Seg. Best Baseline
Mean one-to-one 52.98 41.23 38.62 26.20 35.08 (Pause 35) Max one-to-one 63.50 52.12 44.12 36.50 56.00 (Pause 65) Min one-to-one 35.63 31.62 30.62 15.38 27.50 (Blocks 80)
Meanloc3 81.09 72.94 68.69 75.98 62.16 (Speaker)
Maxloc3 86.53 74.70 70.93 85.40 69.05 (Speaker)
Minloc3 74.75 70.77 66.37 69.05 54.37 (Speaker)
Mean Shen F 53.87 43.47 41.31 35.50 36.58 (Speaker)
Max Shen F 66.08 57.57 48.85 46.70 46.79 (Speaker)
Min Shen F 35.43 32.97 32.07 21.83 29.09 (Blocks 65)
Perfect segments The transcript is divided into contiguous segments, where all utter-ances in a segment belong to the same conversation. The conversation assign-ments are determined by the human annotation whose agreement with the others is highest.
Our results, in Table 3, are encouraging. On average, annotators agree more with each other than with any artificial annotation, and more with our model than with the baselines. For the one-to-one accuracy metric, we cannot claim much beyond these general results. The range of human variation is quite wide, and there are annotators who are closer to baselines than to any other human annotator. As explained earlier, this is because some human annotations are much more specific than others. For very specific annotations, the best baselines are short blocks or pauses. For the most general, marking all utterances the same does very well (although for all other annotations, it is extremely poor).
For the local metric, the results are much clearer. There is no overlap in the ranges; for every test annotation, agreement is highest with other annotators, then our model, and finally the baselines. The most competitive baseline is one conversation per speaker, which makes sense, since if a speaker makes two comments in a four-utterance win-dow, they are very likely to be related.
The Shen F-score metric seems to perform similarly to the one-to-one accuracy, which is unsurprising because they are both measures of global consistency. The largest difference between them is that the speaker baseline outperforms blocks and pauses in F-score (although not by very much), perhaps because it is more precise.
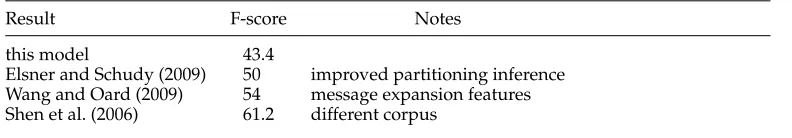
Shen et al. (2006) report higher F-scores for their own best model: It obtains an F-score of 61.2, whereas our model’s mean score is only 43.4. Because of the different corpora, we are unable to explain this difference. Better results are also reported in Wang and Oard (2009) and Elsner and Schudy (2009) (see Table 4).
Table 4
Results reported by others on the same task.
Result F-score Notes
this model 43.4
Elsner and Schudy (2009) 50 improved partitioning inference Wang and Oard (2009) 54 message expansion features Shen et al. (2006) 61.2 different corpus
clue to the correct decision, which is why humans mention names in the first place. But our system is probably overly dependent on them, because they are very reliable compared to our other features.
Because of the frequency with which conversations interleave, perfect segmenta-tion alone is not sufficient to optimize either global metric, and generally does not outperform the baselines. For the local metric, however, it generally does better than the model. Here, performance depends mainly on whether the system can find the bound-aries between one conversation and another, and it is less important to link the segments of a particular conversation to one another, since these different segments often lie outside the three-utterance horizon. Systems designed to detect segment boundaries, like those for meetings, might contribute to improvement of this metric.
6. Specificity Tuning
Although our analysis shows that individual annotators can produce more or less specific annotations of the same conversation, the system described here can produce only a single annotation (for any given set of training data) with a fixed specificity. Now we attempt to control the specificity parametrically, producing more and less specific annotations on demand, without retraining the classifier.
The parameter we choose to alter is the bias of our pairwise classifier. A maximum-entropy classifier has the form:
y(x)= 1
1+exp(−(w·x+b)) (3)
Herewrepresents the vector of feature weights andbis the bias term; a positivebshifts all judgments toward high-confidencesame conversation decisions and a negativeb shifts them away. To alter the classifier, we add a constantλtob. In general, increasing the number and confidence of same decisions leads to larger, coarser partitionings, and decreasing it creates smaller, finer ones. We measure specificity by examining the entropy of the output annotation. Although entropy is generally an increasing function of λ, the relationship is not always smooth, nor is it completely monotonic. Figure 8 plots entropy as a function ofλ.
Figure 8
Entropy of the output annotation produced with bias factorλon test data.λ=0 corresponds to the unbiased system.
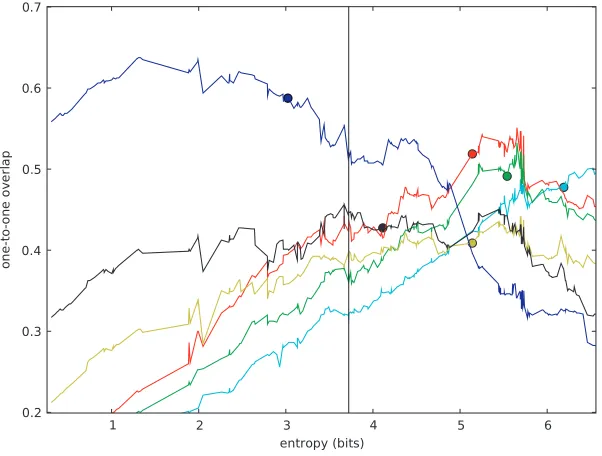
shows overlap with a human transcript whose entropy is 3.0 bits; lower-entropy system annotations correspond better with this annotator’s judgments.
For each human annotation, we evaluate the tuned system’s performance at the entropy level of the original annotation. (This point is marked by the large dot on
Figure 9
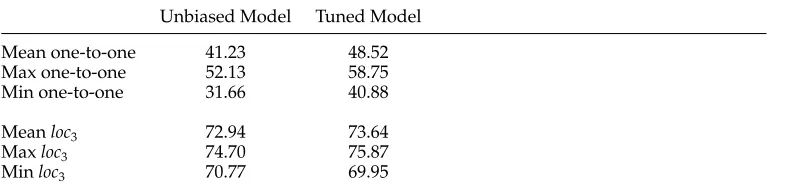
[image:16.486.50.351.387.615.2]Table 5
Metric values between proposed annotations and human annotations on test data. The tuned model (evaluated at the entropy of the human annotations) improves on one-to-one accuracy but not onloc3.
Unbiased Model Tuned Model
Mean one-to-one 41.23 48.52
Max one-to-one 52.13 58.75
Min one-to-one 31.66 40.88
Meanloc3 72.94 73.64
Maxloc3 74.70 75.87
Minloc3 70.77 69.95
each line in the figure.) To do this, we perform a line search overλ until we produce a clustering whose entropy is within .25 bits of the original’s, then evaluate. In other words, we measure performance given an additional piece of supervision—the annota-tor’s preferred specificity level.
Results on the one-to-one metric are fairly good: Extreme and average scores are listed in Table 5. The effects of this technique on the local metric are small (and in many cases negative). This is not entirely surprising, as the local metric is less sensitive to specificity of annotations. Slight positive effects occur only for the most and least specific annotation, which are presumably so extreme that specificity begins to have a slight effect even on local decisions.
Despite fairly large performance increases on the test set, we do not consider this technique really reliable, because the relationship between the bias parameter and final score is not smooth. Small changes in the bias can cause large shifts in entropy, and small changes in entropy can have large effects on quality. (For instance, two annotations have a sharp decline in score at about entropy 5.7, losing about 5% of performance with a change of just over .1 bit.) Therefore it is not clear exactly how to choose a bias parameter which will yield good performance. Matching the entropy of a human annotation seems to work on the test data, but fails to improve scores on our development data. Moreover, although for methodological simplicity we assume access to the exact target entropy for each annotation, it is unlikely that a real user could express their desired specificity so precisely. Figuring out a way to let the user select the desired entropy remains a challenge.
7. Detecting Conversation Starts
Table 6
Metric values using an oracle new-conversation detector on test data.
Original Model +Oracle New Conversations
Mean one-to-one 41.23 46.75
Max one-to-one 52.13 53.50
Min one-to-one 31.66 42.13
Meanloc3 72.94 73.90
Maxloc3 74.70 76.49
Minloc3 70.77 70.72
As a demonstration of the gains possible if a good classifier could be developed, we show the oracle improvements possible on the test data, using an optimal new-conversation detector as a hard constraint on inference (Table 6). The oracle detector detects a conversation start if it occurs in the majority of human annotations, and the inference algorithm is forced to start a new conversation if and only if the oracle has detected one. Good conversation detection is capable of improving not only one-to-one accuracy but local accuracy as well.
We can track the performance of realistic, non-oracle new-conversation detection via the precision, recall, and F-score of the new conversation class (Table 7). As a starting point, we report the accuracy obtained by the pairwise-linkage model and greedy inference already presented. At 49% F-score, it is clearly not doing a good job.
It is possible to do better than this using information already represented in the pairwise classifier: The time since the speaker of the utterance last spoke (logarithmi-cally bucketed), and whether the utterance mentions a name. A better representation for the problem allows the classifier to make somewhat more effective use of these features. For reasons we cannot explain, adding discourse features like the presence of a question or greeting does not improve performance. The simple classifier does improve slightly on the baseline, up to 51%. These test results, however, are somewhat surprising to us. On our development corpus, the corresponding scores are 69% and 75%. Because that corpus contains an average (over three annotations) of 34 conversations, it is likely that we were misled by coincidentally good results.
On the development set, where the classifier works well, its decisions can be inte-grated with inference to yield substantial improvements in actual system performance. Mean loc3 increases from 72% to about 78% and mean one-to-one accuracy from 41% to about 66%. However, we find no improvement at all on the test data, because the classifier has very low recall, and the resulting test annotations have far too few conversations.
Table 7
Precision, recall, and F-score of thenew conversationclass on test data (average 81 conversations).
Precision Recall F-score
Pairwise system 56.08 43.44 48.96
[image:18.486.48.433.608.664.2]8. Future Work
Although our annotators are reasonably reliable, it seems clear that they think of con-versations as a hierarchy, with digressions and schisms. We are interested to see an an-notation protocol which more closely follows human intuition. One suggestion (David Traum, personal communication) is to drop the idea of partitioning entirely and have annotators mark the data as a graph, linking each utterance to its parents and children with links of various strengths. Such a scheme might yield more reliable annotations than our current one, although testing this hypothesis would require new annotation software and a different set of metrics. Any new annotation project should also investi-gate whether annotators can define their desired specificity, and with what precision.
Our results on new conversation detection suggest that a high-performance clas-sifier for this task could improve results substantially. It is also interesting to consider, given the weakness of our technical words feature and the disappointing results using Latent Dirichlet Allocation from Adams (2008), how semantic similarity might be use-fully modeled.
Finally, we are interested to see how well this feature set performs on speech data, as in Aoki et al. (2003). Spoken conversation is more natural than text chat, but even when participants are face-to-face, disentanglement remains a problem. On the other hand, spoken dialogue contains new sources of information, such as prosody and gaze direction. Turn-taking behavior is also more distinct, which makes the task easier, but according to Aoki et al. (2006), it is certainly not sufficient.
9. Conclusion
This work provides a corpus of annotated data for chat disentanglement, which, along with our proposed metrics, should allow future researchers to evaluate and compare their results quantitatively.9Our annotations are consistent with one another, especially with respect to local agreement. We show that features based on discourse patterns and the content of utterances are helpful in disentanglement. The model we present can outperform a variety of baselines.
Acknowledgments
Our thanks to Suman Karumuri, Steve Sloman, Matt Lease, David McClosky, seven test annotators, three pilot annotators, three anonymous conference reviewers, three anonymous journal reviewers, and the NSF PIRE grant. We would also like to thank Craig Martell and David Traum for their very useful comments at the conference presentation.
References
Acar, Evrim, Seyit Ahmet Camtepe, Mukkai S. Krishnamoorthy, and B ¨ulent Yener. 2005. Modeling and multiway analysis of chatroom tensors. In Paul B. Kantor, Gheorghe Muresan, Fred Roberts,
Daniel Dajun Zeng, Fei-Yue Wang, Hsinchun Chen, and Ralph C. Merkle, editors,ISI, volume 3495 ofLecture Notes in Computer Science. Springer, Berlin, pages 256–268.
Adams, Paige H. 2008.Conversation Thread Extraction and Topic Detection in Text-based Chat. Ph.D. thesis, Naval Postgraduate School.
Adams, Paige H. and Craig H. Martell. 2008. Topic detection and extraction in chat.
International Conference on Semantic Computing, 2:581–588.
Aoki, Paul M., Matthew Romaine, Margaret H. Szymanski, James D. Thornton, Daniel Wilson, and Allison Woodruff. 2003. The mad hatter’s cocktail party: A social mobile audio
space supporting multiple simultaneous conversations. InCHI ’03: Proceedings of the SIGCHI Conference on Human Factors in Computing Systems, pages 425–432, New York, NY.
Aoki, Paul M., Margaret H. Szymanski, Luke D. Plurkowski, James D. Thornton, Allison Woodruff, and Weilie Yi. 2006. Where’s the “party” in “multi-party”?: Analyzing the structure of small-group sociable talk. InCSCW ’06: Proceedings of the 2006 20th Anniversary Conference on Computer Supported Cooperative Work, pages 393–402, New York, NY. Bansal, Nikhil, Avrim Blum, and Shuchi
Chawla. 2004. Correlation clustering.
Machine Learning, 56(1-3):89–113. Camtepe, Seyit Ahmet, Mark K. Goldberg,
Malik Magdon-Ismail, and Mukkai Krishnamoorty. 2005. Detecting
conversing groups of chatters: A model, algorithms, and tests. InIADIS AC, pages 89–96, Algarve.
Chen, Lei. 2008.Incorporating Nonverbal Features into Multimodal Models of Human-to-Human Communication. Ph.D. thesis, Purdue University. Chen, Lei, Mary Harper, Amy Franklin,
Travis R. Rose, Irene Kimbara, Zhongqiang Huang, and Francis Quek. 2006. A multimodal analysis of floor control in meetings. In
Proceedings of MLMI 06, pages 36–49, Bethesda, MD.
Daum´e, III, Hal. 2004. Notes on CG and LM-BFGS optimization of logistic regression. Paper available athttp:// pub.hal3.name#daume04cg-bfgs. Implementation available athttp:// hal3.name/megam/.
Elsner, Micha and Warren Schudy. 2009. Bounding and comparing methods for correlation clustering beyond ILP. In
Proceedings of ILP-NLP, pages 19–27, Boulder, CO.
Graff, David. 1995.North American News Text Corpus. Linguistic Data Consortium. LDC95T21.
Haghighi, Aria and Dan Klein. 2006. Prototype-driven learning for sequence models. InProceedings of HLT-NAACL, pages 320–327, New York, NY. Hawes, Timothy, Jimmy Lin, and
Philip Resnik. 2008. Elements of a computational model for multi-party discourse: The turn-taking behavior of supreme court justices. Technical Report LAMP-TR-147/HCIL-2008-02, University of Maryland, College Park.
Ilog, Inc. 2003. CPLEX solver. Available at
www-01.ibm.com/software/websphere/ ilog migration.html.
Jovanovic, Natasa and Rieks op den Akker. 2004. Towards automatic addressee identification in multi-party dialogues. InProceedings of the 5th SIGdial Workshop, pages 89–92, Cambridge, MA.
Jovanovic, Natasa, Rieks op den Akker, and Anton Nijholt. 2006. Addressee identification in face-to-face meetings. In
Proceedings of EACL, Trento. Luo, Xiaoqiang. 2005. On coreference
resolution performance metrics. In
Proceedings of HLT-EMNLP, pages 25–32, Morristown, NJ.
Malioutov, Igor and Regina Barzilay. 2006. Minimum cut model for spoken lecture segmentation. InProceedings of ACL, pages 25–32, Sydney.
McCallum, Andrew and Ben Wellner. 2004. Conditional models of identity uncertainty with application to noun coreference. InProceedings of the 18th Annual Conference on Neural Information Processing Systems (NIPS), pages 905–912, Vancouver.
Miller, G., A. R. Beckwith, C. Fellbaum, D. Gross, and K. Miller. 1990. Introduction to Wordnet: An on-line lexical database.
International Journal of Lexicography, 3(4):235–244.
Ng, Vincent and Claire Cardie. 2002. Identifying anaphoric and non-anaphoric noun phrases to improve coreference resolution. InCOLING, Taipei.
O’Neill, Jacki and David Martin. 2003. Text chat in action. InGROUP ’03: Proceedings of the 2003 International ACM SIGGROUP Conference on Supporting Group Work, pages 40–49, New York, NY.
Rand, William M. 1971. Objective criteria for the evaluation of clustering methods.
Journal of the American Statistical Association, 66(336):846–850.
Roth, Dan and Wen-tau Yih. 2004. A linear programming formulation for global inference in natural language tasks. In
Proceedings of CoNLL-2004, pages 1–8, Boston, MA.
Sacks, Harvey, Emanuel A. Schegloff, and Gail Jefferson. 1974. A simplest systematics for the organization of turn-taking for conversation.Language, 50(4):696–735.
SIGIR ’06: Proceedings of the 29th Annual International ACM SIGIR Conference, pages 35–42, New York, NY. Soon, Wee Meng, Hwee Tou Ng, and
Daniel Chung Yong Lim. 2001. A machine learning approach to coreference resolution of noun phrases.Computational Linguistics, 27(4):521–544.
Traum, D. 2004. Issues in multi-party dialogues. In F. Dignum, editor,Advances in Agent Communication. Springer Verlag, Berlin, pages 201–211.
Traum, David R., Susan Robinson, and Jens Stephan. 2004. Evaluation of multi-party virtual reality dialogue interaction. InProceedings of the Fourth International Conference on Language
Resources and Evaluation (LREC), pages 1699–1702, Lisbon.
Wang, Lidan and Douglas W. Oard. 2009. Context-based message expansion for disentanglement of interleaved text conversations. InProceedings of
HLT-NAACL, pages 200–208, Boulder, CO. Wang, Yi-Chia, Mahesh Joshi, William
Cohen, and Carolyn Ros´e. 2008. Recovering implicit thread structure in newsgroup style conversations. In
Proceedings of the 2nd International Conference on Weblogs and Social Media (ICWSM II), Seattle, WA.