478
©IJRASET: All Rights are Reserved
Explicit Dynamic Analysis of Single Point Cutting
Tool using ANSYS
Rajat Soni1, Dr. Raghwendra Banchhor2
1, 2
Department of Mechanical Engineering, Chhattisgarh Swami Vivekananda Technical University
Abstract: The desirable properties for any machining tool is to have high fracture strength and hardness at high temperatures which depends upon thermal conductivity of cutting tool material. The current research investigates thermal behaviour of single point cutting tool made from high speed steel ( HSS ) and high carbon high chromium steel ( HCHC ). The CAD model is developed using Creo 3.0 design package and thermal analysis is conducted using ANSYS explicit dynamic based on Finite Element Analysis. The stress deformation curves are generated for different depths of cut at specific cutting speed and comparative analysis are made on the basis of this curve. The findings have shown comparison between the two materials i.e. HSS and HCHC.
Keywords: FEA analysis, ANSYS, Single Point Cutting Tool
I. INTRODUCTION
The cutting tools need to be capable to meet the growing demands for higher productivity and economy as well as to machine the exotic materials which are coming up with the rapid progress in science and technology. The cutting tool material of the day and future essentially require the following properties to resist or retard the phenomenon leading to random or early tool failure.
1) High mechanical strength; compressive, tensile, and TRA 2) Fracture toughness – high or at least adequate
3) High hardness for abrasion resistance
4) High hot hardness to resist plastic deformation and reduce wear rate at elevated temperature 5) Chemical stability or inertness against work material, atmospheric gases and cutting fluids 6) Resistance to adhesion and diffusion
7) Thermal conductivity – low at the surface to resist incoming of heat and high at the core to quickly dissipate the heat entered 8) High heat resistance and stiffness
9) Manufacturability, availability and low cost.
II. LITERATUREREVIEW
Kim et al. [1] studied the effect of the edge radius for a cemented carbide tool on the cutting forces and temperature, using an FE orthogonal cutting model based on the Eulerian formulation, and compared the results with the experiments. The temperature distribution on tool is affected by tool edge radius which are validated from experimental results also.
Shintani et al. [2,3] analyzed the effect of tool geometry on the cutting performance of CBN tools for carburized hardened steel (600–720 HV) under both continuous and interrupted cutting conditions. Based on experimental results, covering an extensive range of tool geometric parameters, the optimum tool geometry for continuous cutting was specified to have a negative chamfer angle of 35◦, a chamfer width larger than the tool–chip contact length (0.2 mm), a nose radius of 0.8 mm, and a hone radius of 0.05 mm. Matsumoto et al. [4] has analysed double chamfered tool, honed tool designs. The analysis is conducted to determine residual stresses in bar turning operation. The residual stresses became more compressive on machined surface which largely affected sublayer beneath.
Ren and Altintas [5] proposed an analytical cutting model for chamfer tools, based on Oxley’s slip-line field model for sharp tools. They proposed to minimize the cutting energies in the deformation zones by analyzing the influence of chamfer angle and cutting conditions on the cutting forces and temperature.
III.OBJECTIVE
479
©IJRASET: All Rights are Reserved
IV.RESEARCHMETHODOLOGY
The CAD model of cutting tool and metal work is developed using Creo 2.0 software as per dimensions which is then converted into .iges file format and imported in ANSYS design modeller as shown in figure 1 below
[image:2.612.70.511.107.404.2][image:2.612.70.505.119.248.2]
Figure 1: Imported CAD model in ANSYS design modeller
Figure 2: Meshed CAD mode
The CAD model is meshed using brick elements and fine sizing as shown in figure 2 above. Number of elements generates is 15308 and number of nodes generated is 19347. The size function was set to adaptive, relevance center fine, transition set to slow, relevance center 1. Fixed support and displacement support are given at different faces of cutting tool and metal work. The details are
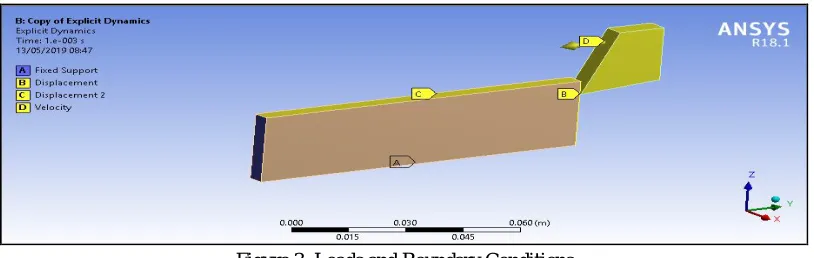
[image:2.612.104.511.536.665.2]A. Fixed support at bottom face of metal work B. Displacement at right edge of metal work C. Displacement support at top face of metal work D. Initial velocity of 140m/s on cutting tool
Figure 3: Loads and Boundary Conditions
480
©IJRASET: All Rights are Reserved
V. RESULTSANDDISCUSSION
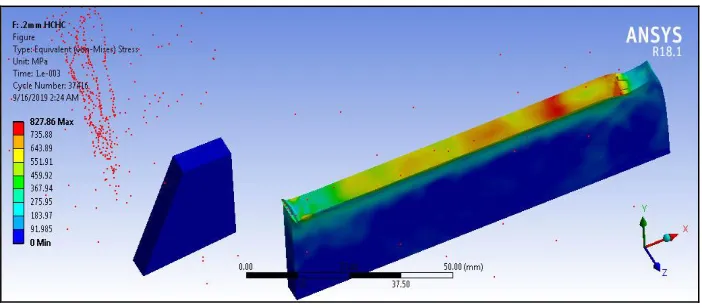
[image:3.612.132.482.130.287.2]In this case analysis is conducted using HCHC tool for different depths of cut. The depth of cuts were 0.2mm, 0.4mm, 0.6mm, 0.8mm, 1mm. The analysis is conducted using ANSYS EXPLICIT dynamics software. The analysis is conducted at 0.2mm depth of cut and equivalent stress, strain and deformation are computed. The results are discussed below.
[image:3.612.131.483.315.467.2]Figure 4: Total deformation at 0.2mm depth of cut using HCHC tool
Figure 5: Equivalent strain at 0.2mm depth of cut using HCHC tool
Figure 6: Equivalent stress at 0.2mm depth of cut using HCHC tool
[image:3.612.131.482.494.648.2]481
©IJRASET: All Rights are Reserved
0 200 400 600 800 1000 1200
0 50 100 150 200 250
Eq
u
iv
al
e
n
t
st
re
ss
(
M
p
a)
Deformation(mm)
[image:4.612.85.535.61.328.2].2mm Depth of cut with HCHC tool
Figure 7: Equivalent stress vs deformation at 0.2mm depth of cut
The equivalent stress value at 0.2mm depth increases steeply up to 5 mm chip deformation up to504 Mpa. For further deformation the equivalent stress generated shows an abrupt increase and decrease.
0 200 400 600 800 1000 1200
0 50 100 150 200 250
Eq
u
iv
al
en
t
st
re
ss
(
M
p
a)
Deformation(mm)
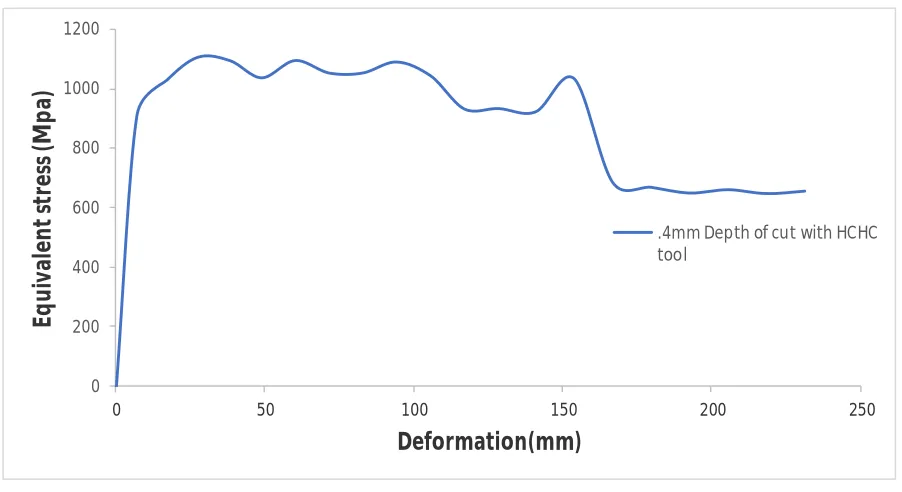
.4mm Depth of cut with HCHC tool
Figure 8: Equivalent stress vs deformation at 0.4mm depth of cut
[image:4.612.81.532.395.641.2]482
[image:5.612.75.535.64.330.2]©IJRASET: All Rights are Reserved
Figure 9: Equivalent stress vs deformation at 0.6mm depth of cut
The equivalent stress value at 0.6mm depth increases steeply up to 2 mm chip deformation up to 719MPa. For further deformation the equivalent stress generated shows an abrupt increase and decrease.
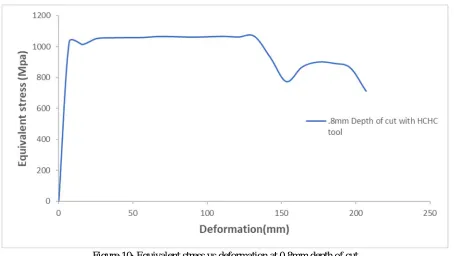
Figure 10: Equivalent stress vs deformation at 0.8mm depth of cut
[image:5.612.81.535.384.640.2]483
[image:6.612.76.535.66.328.2]©IJRASET: All Rights are Reserved
Figure 11: Equivalent stress vs deformation at 1mm depth of cut
The equivalent stress value at 1mm depth increases steeply up to 2 mm chip deformation up to 866MPa. For further deformation the equivalent stress generated shows an abrupt increase and decrease. The stresses generated using HSS tool at different depths of cut with respect to deformation of metal work is shown in section below.
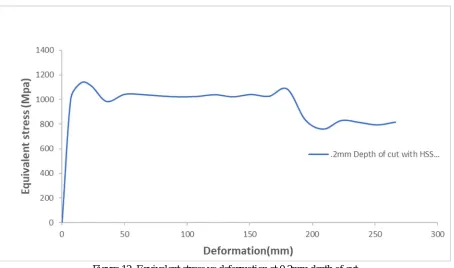
Figure 12: Equivalent stress vs deformation at 0.2mm depth of cut
[image:6.612.81.535.396.664.2]484
[image:7.612.81.532.68.305.2]©IJRASET: All Rights are Reserved
Figure 13: Equivalent stress vs deformation at 0.4mm depth of cut
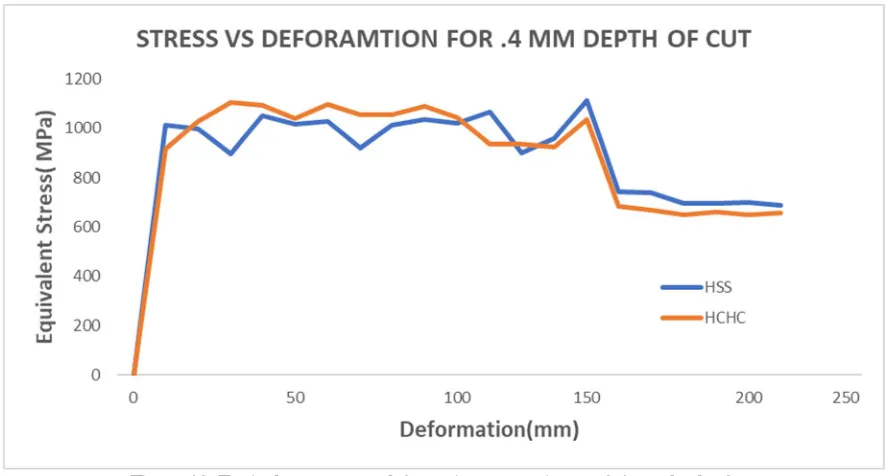
The equivalent stress value at 0.4mm depth increases steeply up to 8 mm chip deformation up to 795 MPa. For further deformation the equivalent stress generated shows an abrupt increase and decrease at different deformation values.
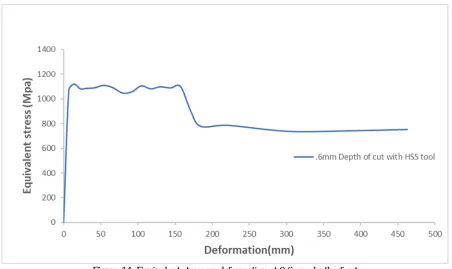
Figure 14: Equivalent stress vs deformation at 0.6mm depth of cut
[image:7.612.81.533.365.634.2]485
[image:8.612.88.534.62.302.2]©IJRASET: All Rights are Reserved
Figure 15: Equivalent stress vs deformation at 0.8mm depth of cut
The equivalent stress value at 0.8mm depth increases steeply up to 8 mm chip deformation up to 719 MPa. For further deformation the equivalent stress generated shows an abrupt increase and decrease at different deformation values.
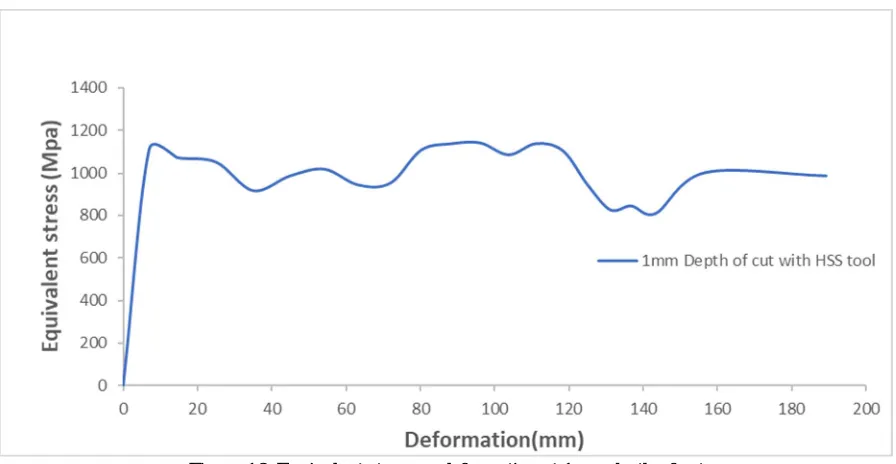
Figure 16: Equivalent stress vs deformation at 1mm depth of cut
The equivalent stress value at 1mm depth increases steeply up to 8 mm chip deformation up to 987 MPa. For further deformation the equivalent stress generated shows an abrupt increase and decrease at different deformation values.
[image:8.612.83.531.363.595.2]486
©IJRASET: All Rights are Reserved
0 200 400 600 800 1000 1200
0 50 100 150 200 250
Eq
u
iv
al
e
n
t
St
re
ss
(
M
P
a)
Deformation(mm)
STRESS VS DEFORAMTION FOR .2MM DEPTH OF CUT
HSS
[image:9.612.90.526.71.327.2]HCHC
Figure 17: Equivalent stress vs deformation comparison at 0.2mm depth of cut
The stress vs deformation curve for 0.2mm depth of cut shows similar values of stresses for chip deformation up to 70mm and thereafter fluctuations are higher for HSS and HCHC material.
Figure 18: Equivalent stress vs deformation comparison at 0.4mm depth of cut
[image:9.612.84.528.394.632.2]487
©IJRASET: All Rights are Reserved
400 600 800 1000 1200 1400
Eq
u
iv
al
e
n
t
St
re
ss(
M
P
a)
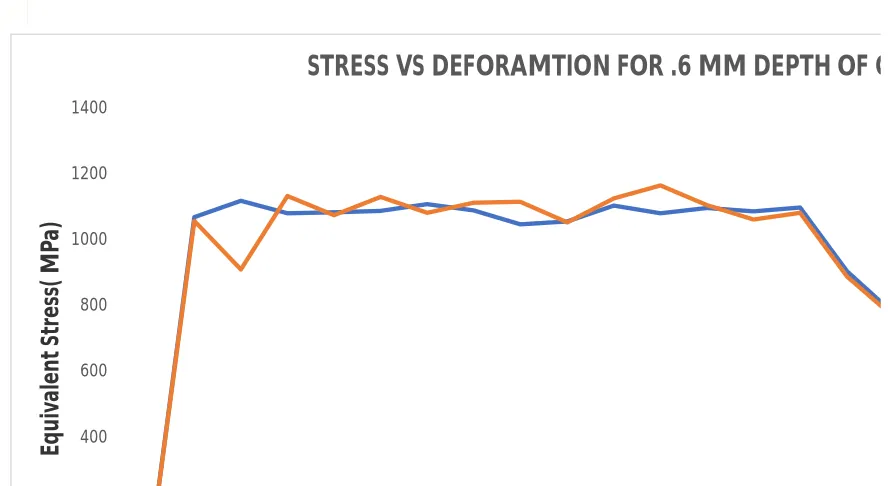
[image:10.612.85.530.64.307.2]STRESS VS DEFORAMTION FOR .6 MM DEPTH OF CUT
Figure 19: Equivalent stress vs deformation comparison at 0.6mm depth of cut
The equivalent stress for both HSS and HCHC material at .6 mm depth of cut shows similar variation for all chip deformation values throughout. This depth of cut can be asserted as optimum depth of cut for both tool materials i.e. HSS and HCHC.
Figure 20: Equivalent stress vs deformation comparison at 0.8mm depth of cut
[image:10.612.88.525.372.612.2]488
©IJRASET: All Rights are Reserved
0 200 400 600 800 1000 1200
0 50 100 150 200 250
Eq
u
iv
al
en
t
St
re
ss
( M
P
a)
Deformation(mm)
STRESS VS DEFORAMTION FOR 1 MM DEPTH OF CUT
[image:11.612.94.521.75.311.2]HSS HCHC
Figure 21: Equivalent stress vs deformation comparison at 1mm depth of cut
The equivalent stress for both HSS and HCHC material at 1mm depth of cut shows similar variation for all chip deformation up to 15mm and thereafter fluctuations are higher for HSS and HCHC material
VI.CONCLUSION
The FEA analysis of single point cutting tool and metal work is conducted using ANSYS explicit dynamics platform at 140m/s speed of cutting. The equivalent stress vs chip deformation at different depths of cut are generated and findings are discussed below: 1) Equivalent stress generated for different depths of cut ranges from 650Mpa and 900MPa at speed of 140m/s for both HSS and
HCHC tool material.
2) The maximum equivalent stress generated increases nearly to 750MPa for all depths of cut and thereafter shows abrupt increase and decrease without following clear trend.
3) The stress generated using HCHC cutting tool is lower as compared to HSS tool for all depths of cut. 4) Chip deformation achieved using HCHC tool is more as compared to HSS tool.
5) At .8 mm depth of cut the equivalent stress generated is nearly same for both materials (HSS and HCHC)
REFERENCES
[1] K.W. Kim, W.Y. Lee, H.C. Sin, A finite-element analysis of machining with the tool edge considered, J. Mater. Process. Technol. 86 (1999) 45–55
[2] K. Shintani, M. Ueki, Y. Fujimura, Optimum tool geometry of CBN tool for continuous turning of carburized steel, Int. J. Mach. Tools Manuf. 26 (3) (1989) 403–413.
[3] K. Shintani, M. Ueki, Y. Fujimura, Optimum cutting tool geometry when interrupted cutting carburized steel by CBN tool, Int. J. Mach. Tools Manuf. 26 (3) (1989) 415– 423.