Abstract—Turnover prediction of a company in the ever fluctuating stock market has always proved to be a herculean task at hand. Data mining is a well-known research area of Computer Science that aims at extracting meaningful information from large databases. However, despite the existence of many algorithms for the purpose of predicting future trends, their efficiencies are questionable. The objective of this paper is to improve the accuracy of the prediction process by implementing various clustering, discretization and feature selection techniques on stock market data. The authorized Stock market dataset was taken fromwww.bsc.com and included the everyday stock values of various companies over the past 10 years. The algorithms were investigated using ‘R’ and ‘Weka’ tool. To begin with, four clustering techniques- K-means clustering, Farthest first, Expectation Maximization and Canopy algorithm were used to divide the attributes into various clusters. After clustering, data discretization was performed using both supervised and unsupervised algorithms. A new data discretization algorithm was proposed in order to make the data mining investigations easier. Then, several feature selection algorithms like CFS Subset, Information Gain, Gain Ration, One R Attribute and Principal component Analysis were used to extract the important features. Finally, the Random Forest algorithm was utilized to predict the turnover. The above four steps were implemented to predict the turnover of a company on an everyday basis. An accuracy rate of 97% was achieved by the proposed methodology and the importance of the stock market attributes was established as well.
Index Terms— clustering, data mining, discretization, clustering.
I. INTRODUCTION
Estimation of the stock market prices have constantly proved to be a tedious task mainly due to the volatile nature of the market [1-3]. However data mining techniques and other computational intelligence techniques have been applied to achieve the same over the years. Some of the approaches undertaken include the use of decision tree algorithms, concepts of neural networks and Midas [4-6].
Manuscript received July10, 2015; revised August 05, 2015.
Shashaank D S is an Undergraduate CSE student with SSN College of Engineering, Tamilnadu,India.
ia: [email protected].
Sruthi V is an Undergraduate CSE student with SSN College of Engineering, Tamilnadu,India: [email protected].
Vijayalakshimi MLS is an Undergraduate CSE student with SSN College of Engineering, Tamilnadu,India: [email protected].
Shomona G J is Associate Professor, Department of CSE, SSN College of Engineering, Tamilnadu,India: [email protected].
However through this paper, a comparative study was done to estimate and predict the turnover of companies viz, Infosys, Sintex, HDFC and Apollo hospitals using Random Forest classification algorithm. In order to predict the turnover, Random Forest algorithm was applied post data discretization and feature selection. Prior to that, data mining techniques like clustering, discretization and feature selection were applied to improve the performance. Based on the predictions made by the algorithm with respect to the total turnover of a company (on an everyday basis), an accuracy rate was estimated from the number of true positives/negatives and false positives/negatives. A brief review of the state-of-the-art in predicting stock market share data is given below.
II. RELATEDWORK
The objective of any nation at large is to enhance the lifestyle of common man and that is the driving force to undertake research to predict the market trends [7-9]. In the recent decade, much research has been done on neural networks to predict the stock market changes [10].
Matsui and Sato [12] proposed a new evaluation method to dissolve the over fitting problem in the Genetic Algorithm (GA) training phase. On comparing the conventional and the neighbourhood evaluation the atuhors found the new evaluation method to perform better than the conventional one. Gupta, Aditya, and Dhingra [13] proposed a stock market prediction technique based on Hidden Markov Models. In that approach, the authors considered the fractional change in stock value and the intra-day high and low values of the stock to train the continuous Hidden Markov Model (HMM). Then this HMM was used to make a Posteriori decision over all the possible stock values for the next day. The authors applied this approach on several stocks, and compared the performance to the existing methods. Lin, Guo, and Hu [14] proposed a SVM based stock market prediction system .This system selected a good feature subset, evaluated stock indicator and controlled over fitting on the stock market tendency prediction. The authors tested this approach on Taiwan stock market datasets and found that the proposed system surpassed the conventional stock market prediction system in terms of performance. In an earlier paper (Shashaank et,al, 2015), an accuracy of 95% was achieved by using the Random Forest classification algorithm which was much higher than the other algorithms. For this reason, we have used the same algorithm for classification and evaluation purposes.
.
Investigations on the Suitability of Data Mining
Techniques in Stock Market Turnover
Prediction
III. PROPOSEDFRAMEWORKFORINVESTIGATING BUSINESSDATA
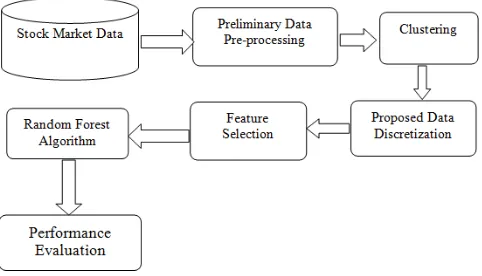
The stock turnover prediction framework proposed in this paper is portrayed in Figure 1. The basic methodology involved Data Collection, Pre-processing, Feature Selection and Classification, each of which is explained below.
Figure 1: Proposed Computational Framework for Investigating Business Data
IV. CLUSTERING
Clustering is the process of transforming a set of abstract objects into individual sets of similar objects with an objective to achieve high intra-class similarity and low inter-class similarity. Clustering is a kind of unsupervised classification of data as none of the classes are initially identified, predefined or structured. A clustering algorithm is expected to have the following characteristics:
Scalability: a clustering algorithm must have the ability to deal with both average sized databases and large ones.
Versatile nature: a clustering algorithm must be capable of working on different kinds of data including numerical data, categorical data and binary data.
Clustering algorithm must be able to handle noisy data.
Dimensionality independent: A clustering algorithm must not be dependent on the dimensionality of the data. It must have the ability to handle low dimensional and high dimensional data.
K-MEANS ALGORITHM:
K-means algorithm is a widely used partitioned clustering algorithm. It is one of the most efficient ones due to its low execution time. In this algorithm, ‘k’ objects are arbitrarily chosen from the data set to act as the cluster centers. The values of the ‘k’ chosen objects are considered as the cluster centers of the ‘k’ clusters respectively. The procedure is repeated by choosing ‘k’ more objects from the dataset and further assigning these objects to the ‘k’ clusters based on similarity between the object to be assigned and the object present in the cluster. In the previous step
similarity is determined by computing the Euclidean distance between the object and the cluster centers and comparing this distance with the various ‘k’ clusters. The cluster center is recalculated for each cluster once its contents are updated using the following formula:
Where, Ci is the number of objects in the cluster. The above procedure is repeated until no change is observed in the cluster center value of the clusters.
FARTHEST FIRST CLUSTERING
The farthest first algorithm is a variant of the K-means algorithm. In the farthest first algorithm, an object is assigned to a cluster with its center farthest away from the object to be assigned. However the cluster center and the assigned object must belong to the same data area.
EM (Expectation– Maximization) Algorithm:
It is a widely used method for determining Maximum Likelihood Estimate (MLE) of data when certain data is missing, hidden or unavailable. The algorithm alternates between the expectation step (E) and maximization step (M).
Expectation step (E):
The probability of each object belonging to each cluster is estimated and recorded. A function is created for the evaluation of log-likelihood taking all parameters in to consideration.
Maximization step (M):
The parameters maximizing the expected log-likelihood are computed. This step is responsible to estimate the parameters of the probability distribution of each class for the next step.
Initially, the mean of all points belonging to a class is computed. (μj). The covariance matrix is calculated in each iteration using Bayes theorem.
The probability of occurrence of each class is computed through the mean of probabilities.
CANOPY ALGORITHM:
The canopy clustering algorithm is often used as a pre-clustering algorithm as well as a pre-processing one. Canopy is most often used as a pre-clustering algorithm in order to work with large datasets and hence enables k-means algorithm to work on the simplified data set. It is mainly used to speed up the process of clustering in case of large data sets.
Procedure:
Input: k-number of clusters T1 - loose distance
[image:2.595.50.291.152.290.2]Step 1- From C, one point is chosen at random. This is done in order to form the canopy.
Step 2- The distance between all points to be clustered and the arbitrarily chosen point is determined.
Step 3- Each point belonging to C is added to the canopy if the estimated distance from the point in the canopy is lesser than T1.
Step 4- If the above specified distance is < T2 as well, the point is removed from C.
Step 5- Repeat until all points in C have been considered. V. DATAPREPROCESSING
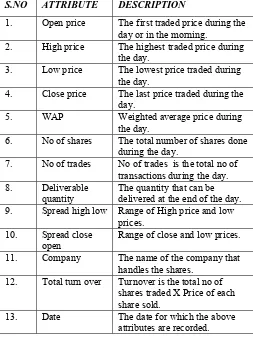
The data that we obtain from the real world is generally incomplete, noisy and inconsistent. The need and opportunity to extract knowledge and information from databases lead us to do data pre-processing. The stock data was characterised by attributes described in Table 1. The stock market starts at 9:15 in the morning and ends at 3:30 in the afternoon. The attributes described in Table 1 are recorded within this time frame
.
Table1. Stock Market Share Data – Attribute Description S.NO ATTRIBUTE DESCRIPTION
1. Open price The first traded price during the day or in the morning.
2. High price The highest traded price during the day.
3. Low price The lowest price traded during the day.
4. Close price The last price traded during the day.
5. WAP Weighted average price during the day.
6. No of shares The total number of shares done during the day.
7. No of trades No of trades is the total no of transactions during the day. 8. Deliverable
quantity The quantity that can be delivered at the end of the day. 9. Spread high low Range of High price and low
prices. 10. Spread close
open
Range of close and low prices. 11. Company The name of the company that
handles the shares. 12. Total turn over Turnover is the total no of
shares traded X Price of each share sold.
13. Date The date for which the above attributes are recorded.
Proposed Data Discretization Method
The whole purpose of data preprocessing is to make the data easier to understand, use and explain. It is known that learning using discrete features is more accurate and faster than using continuous data .Hence the number of distinct values for a given continuous variable is obtained by dividing the range of the variable into intervals that are disjoint and these intervals are associated with meaningful
[image:3.595.42.295.330.667.2]labels [20].To begin with, the 4 basic steps used for discretization are as given in figure 4. In order to maximize accuracy, we combine equiwidth binning and equidepth binning
.
Figure 2: Basic steps involved in discretization
According to Figure 2, the data is ordered according to Total_turnover and the split point is calculated using equidepth binning [20].
Total number of rows: 9873; Number of intervals: 5; Depth = 9873/5 =1974 ~ 2000
So, 2000 tuples belong to 1st interval. As there are only 9873 tuples, the last class E will have only 1873 tuples. Then the total turnover will be discretized into:
A - 58,320 to 18,291,986 B – 18,296,597 to 37,731,606 C – 37,749,751 to 121,233,543 D – 121,245,870 to 300,360,881 E- 300,465,316 to 19,085,311,470
The proposed discretization method was found to be the most efficient and gave an accuracy of 96.91% with the Random forest classifier which is higher than the one obtained using equidepth binning and various other supervised and unsupervised methods. So, it was concluded that the proposed algorithm depicted higher performance among all algorithms that we have investigated. Also, the company attribute was converted into dummy variables (0’s/1’s) to make the prediction process easier. Once the data was pre-processed, various feature selection algorithms were applied as elaborated in the sections below.On each of the algorithms, 60% of the data was used as training data and the remaining 40% was used to perform validation. Also, the number of clusters was specified as 5 for each of the algorithms. The results are discussed in Section 4.
VI. FEATURESELECTION
After discretizing the data, various feature selection algorithms were used in order to extract the important features and hence, to increase the accuracy. After extracting the important features, the data was split into training data and testing data. The training data accounted for 60% of the whole data and the remaining was taken as testing data. In order to improve the accuracy and cross
The values of the continuous attribute to be discretized are sorted.
A split point for cutting the continuous values into intervals is found.
The intervals are obtained using the split point from the previous step.
check, random samples were taken in both these splits. Then the Random Forest classification algorithm was used to predict the turnover using the Open Source Weka Software Suite and the evaluators investigated were:
Cfs Subset Evaluator
Information Gain Feature Selection
Gain Ratio Based Feature Selection
One R Attribute Evaluator
The results are discussed in the ensuing section.
VII. EXPERIMENTALRESULTS
The results of this investigation are discussed in two sections viz, Clustering, Data Discretization with Feature Selection.
Clustering
Table 2: Clustering of Stock Market Data S.No Algorithm Clustered Percentage 1. Simple K-means 16%, 8%, 25%, 26%, 25%
2. Canopy 23%, 25%, 17%, 25%, 10%
3. Farthest first 38%, 5%, 6%, 26%, 25%
4. EM 24%, 16%, 25%, 9%, 27%
Clustering did not reveal any interesting patterns or trends in the stock market data and hence investigations were carried on to make the data more intelligible and easier to process by feature selection and prediction algorithms.
Data Discretization
[image:4.595.297.556.71.182.2]The proposed discretization method was found to be the most efficient and gave an accuracy of 96.91% with the Random forest classifier which is higher than the one obtained using equidepth binning. The features that were reported important by the feature selection algorithms are stated in Table 3:
Table 3: Results of feature selection as per their rank
Algorithm Features classified as important
CFS Subset Evaluator Close Price, No of Shares, No of Trades, Deliverable Quantity &Spread
high low Information Gain
(Ranker search)
Apollo, No of Shares, No of Trades, Close Price, WAP, Open Price &
High Price, Gain Ratio (Ranker
search) No of Shares, No of Trades, Close Price, WAP, Open Price & High Price
One R Attribute (Ranker
search) Price, Open Price, High Price & Low No of Trades, No of Shares, Close Price
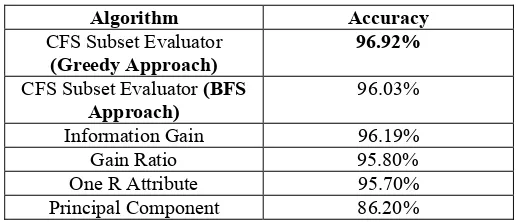
The result after running the Random Forest algorithm through percentage split (60% training and 40% testing) post feature selection.
Table 4: Prediction Accuracy of Stock Market Data
Algorithm Accuracy
CFS Subset Evaluator (Greedy Approach)
96.92%
CFS Subset Evaluator (BFS Approach)
96.03%
Information Gain 96.19%
Gain Ratio 95.80%
One R Attribute 95.70%
Principal Component 86.20%
From Table 4, it can be seen that a maximum accuracy rate of 97% was achieved when CFS subset evaluator was used with the Greedy Step Wise Approach and predicted using Random Forest algorithm.
VIII. CONCLUSION
Application of data mining techniques to predict turnover based on stock market share data is an emerging area of research and is expected to be instrumental in moulding the country’s economy by predicting possible investment trends to increase turnover. In view of this, an efficient way of implementing the Random Forest algorithm is proposed in order to mitigate the risks involved in predicting the turnover of a company. An accuracy rate of 97% was achieved in the prediction process. This accuracy rate was much higher than those obtained before. Also, a new discretization algorithm was proposed by combining the pros of existing ones. Hence we believe that further research using computational methodologies to predict turnover on a daily basis based on share market data will reveal better and more interesting patterns for trade investments.
REFERENCES
[1] Abhishek Gupta, Dr. Samidha , D. Sharma - ”Clustering- Classification Based Prediction of Stock Market Future Prediction” - (IJCSIT) International Journal of Computer Science and Information Technologies,5(3), 2014, 2806-2809.
[2] Dharamveer , Beerendra , Jitendra Kumar –“ Efficient Prediction of Close Value using Genetic algorithm based horizontal partition decision tree in Stock Market“, International Journal of Advance Research in Computer Science and Management Studies, 2(1), 2014 . [3] Kannan, K. Senthamarai, et al. "Financial stock market forecast using
data mining techniques." Proceedings of the International Multi-conference of Engineers and computer scientists. Vol. 1. 2010. [4] Md. Al Mehedi Hasan, Mohammed Nasser, Bi prodip Pal, Shamim
Ahmad– “Support Vector Machine and Random Forest Modeling for Intrusion Detection System (IDS)”- Journal of Intelligent Learning Systems and Applications, 6(1),2014.
[5] Shen, S., Jiang, H., & Zhang, T. (2012). Stock market forecasting using machine learning algorithms.
[6] Bayaga, Anass. "Multinomial logistic regression: usage and application in risk analysis." Journal of applied quantitative methods 5.2 (2010): 288-297.
[7] Shah, Vatsal H. "Machine learning techniques for stock prediction." Foundations of Machine Learning| Spring (2007).
[8] Al-Radaideh, Qasem A., AaAssaf, And Eman Alnagi. "Predicting Stock Prices Using Data Mining Techniques." The International Arab Conference on Information Technology (ACIT’2013). 2013. [9] Wang, Jar-Long, and Shu-Hui Chan. "Stock market trading rule
Discovery using two-layer bias decision tree." Expert Systems with Applications, 30(4), pp. 605-611, 2006.
[11] MahdiPakdamanNaeini, HamidrezaTaremian,
HomaBaradaranHashemi “Stock Market Value Prediction Using Neural Networks”, International Conference on Computer Information Systems and Industrial Management Applications (CISIM), pp. 132-136, 2010.
[12] Matsui, Kazuhiro, and Haruo Sato. "Neighbourhood evaluation in acquiring stock trading strategy using genetic algorithms." Soft Computing and Pattern Recognition (SoCPaR), 2010 International Conference of. IEEE, 2010.
[13] Gupta, Aditya, and Bhuwan Dhingra. "Stock market prediction using hidden markov models." Engineering and Systems (SCES) Students Conference on, IEEE, 2012.
[14] Lin, Yuling, Haixiang Guo, and Jinglu Hu, An SVM-based approach for stock market trend prediction." Neural Networks (IJCNN), the 2013 International Joint Conference on. IEEE, 2013. [15] Sanjana Sahayaraj, Shomona Gracia Jacob, Data Mining to Help
Aphasic Quadriplegic and Coma Patients, International Journal of cience and Research (IJSR), Vol. 3(9), pp.121-125, 2014.
[16] Jacob SG, Ramani RG, Prediction of Rescue Mutants to predict Functional Activity of Tumor Protein TP53 through Data Mining Technniques”, Journal of Scientific and Industrial Research, Vol.74, pp.135-140, 2015.
[17] Zhao, Yanchang. R, Data mining: Examples and case studies. Academic Press, 2012.
[18] Geetha Ramani R, Jacob SG, Prediction of cancer rescue p53 mutants
in silico using Naïve Bayes learning methodology, Protein and
Peptide Letters, 20(11), pp.1280-1291, 2013.
[19] Ghatasheh, Nazeeh. "Business Analytics using Random Forest Trees for Credit Risk Prediction: A Comparison Study." (2014): 19-30.
[20] Jacob SG, Geetha Ramani R, Prediction of Rescue Mutants to Restore Functional Activity of Tumor Protein TP53 through Data Mining Techniques, Journal of Scientific and Industrial Research, 74(3),pp.135-140.
[21] Kohavi, R., John, G.: Wrappers for feature subset selection. Artificial Intelligence 1-2, 273–324 (1997)
[22] Geetha Ramani R, Jacob SG, Improved classification of lung cancer tumors Based on structural and physicochemical properties of proteins using data mining models, Plos One, 8(3), 2013.
Shashaank D.S is currently pursuing B.E. ComputerScience and Engineering in SSN College of EngineeringChennai, India. He is doing research in the field of Machine Learning.
Sruthi.V is currently pursuing B.E computer Science and
Engineering in SSN College of Engineering Chennai, India.
She is doing research in the field of machine learning.
Vijayalakshimi M.L.S is currently pursuing B.E computer Science and Engineering in SSN College of Engineering Chennai, India. She is doing research in the field of machine learning.